Belgium Agronomic Amino Acids Market (2026-2032) | Growth, Size & Revenue, Segmentation, Industry, Value, Analysis, Competitive Landscape, Outlook, Forecast, Trends, Share, Companies
Market Forecast By Type (Lysine, Thymine, Methionine, Glutamic Acid, Alanine, Leucine, Arginine, Others), By Source (Plant-based, Animal-based, Synthetic, Treatment Method, Foliar, Seed, Soil, Others), By Application (Soil Amendment, Chlorophyll Synthesis, Roots Development, Bud Growth and Leaves Development, Crop Resistance, Ripening, Others) And Competitive Landscape
| Product Code: ETC6346653 | Publication Date: Sep 2024 | Updated Date: Apr 2026 | Product Type: Market Research Report | |
| Publisher: 6Wresearch | Author: Summon Dutta | No. of Pages: 75 | No. of Figures: 35 | No. of Tables: 20 |
Belgium Agronomic Amino Acids Market Size (2020-2030)
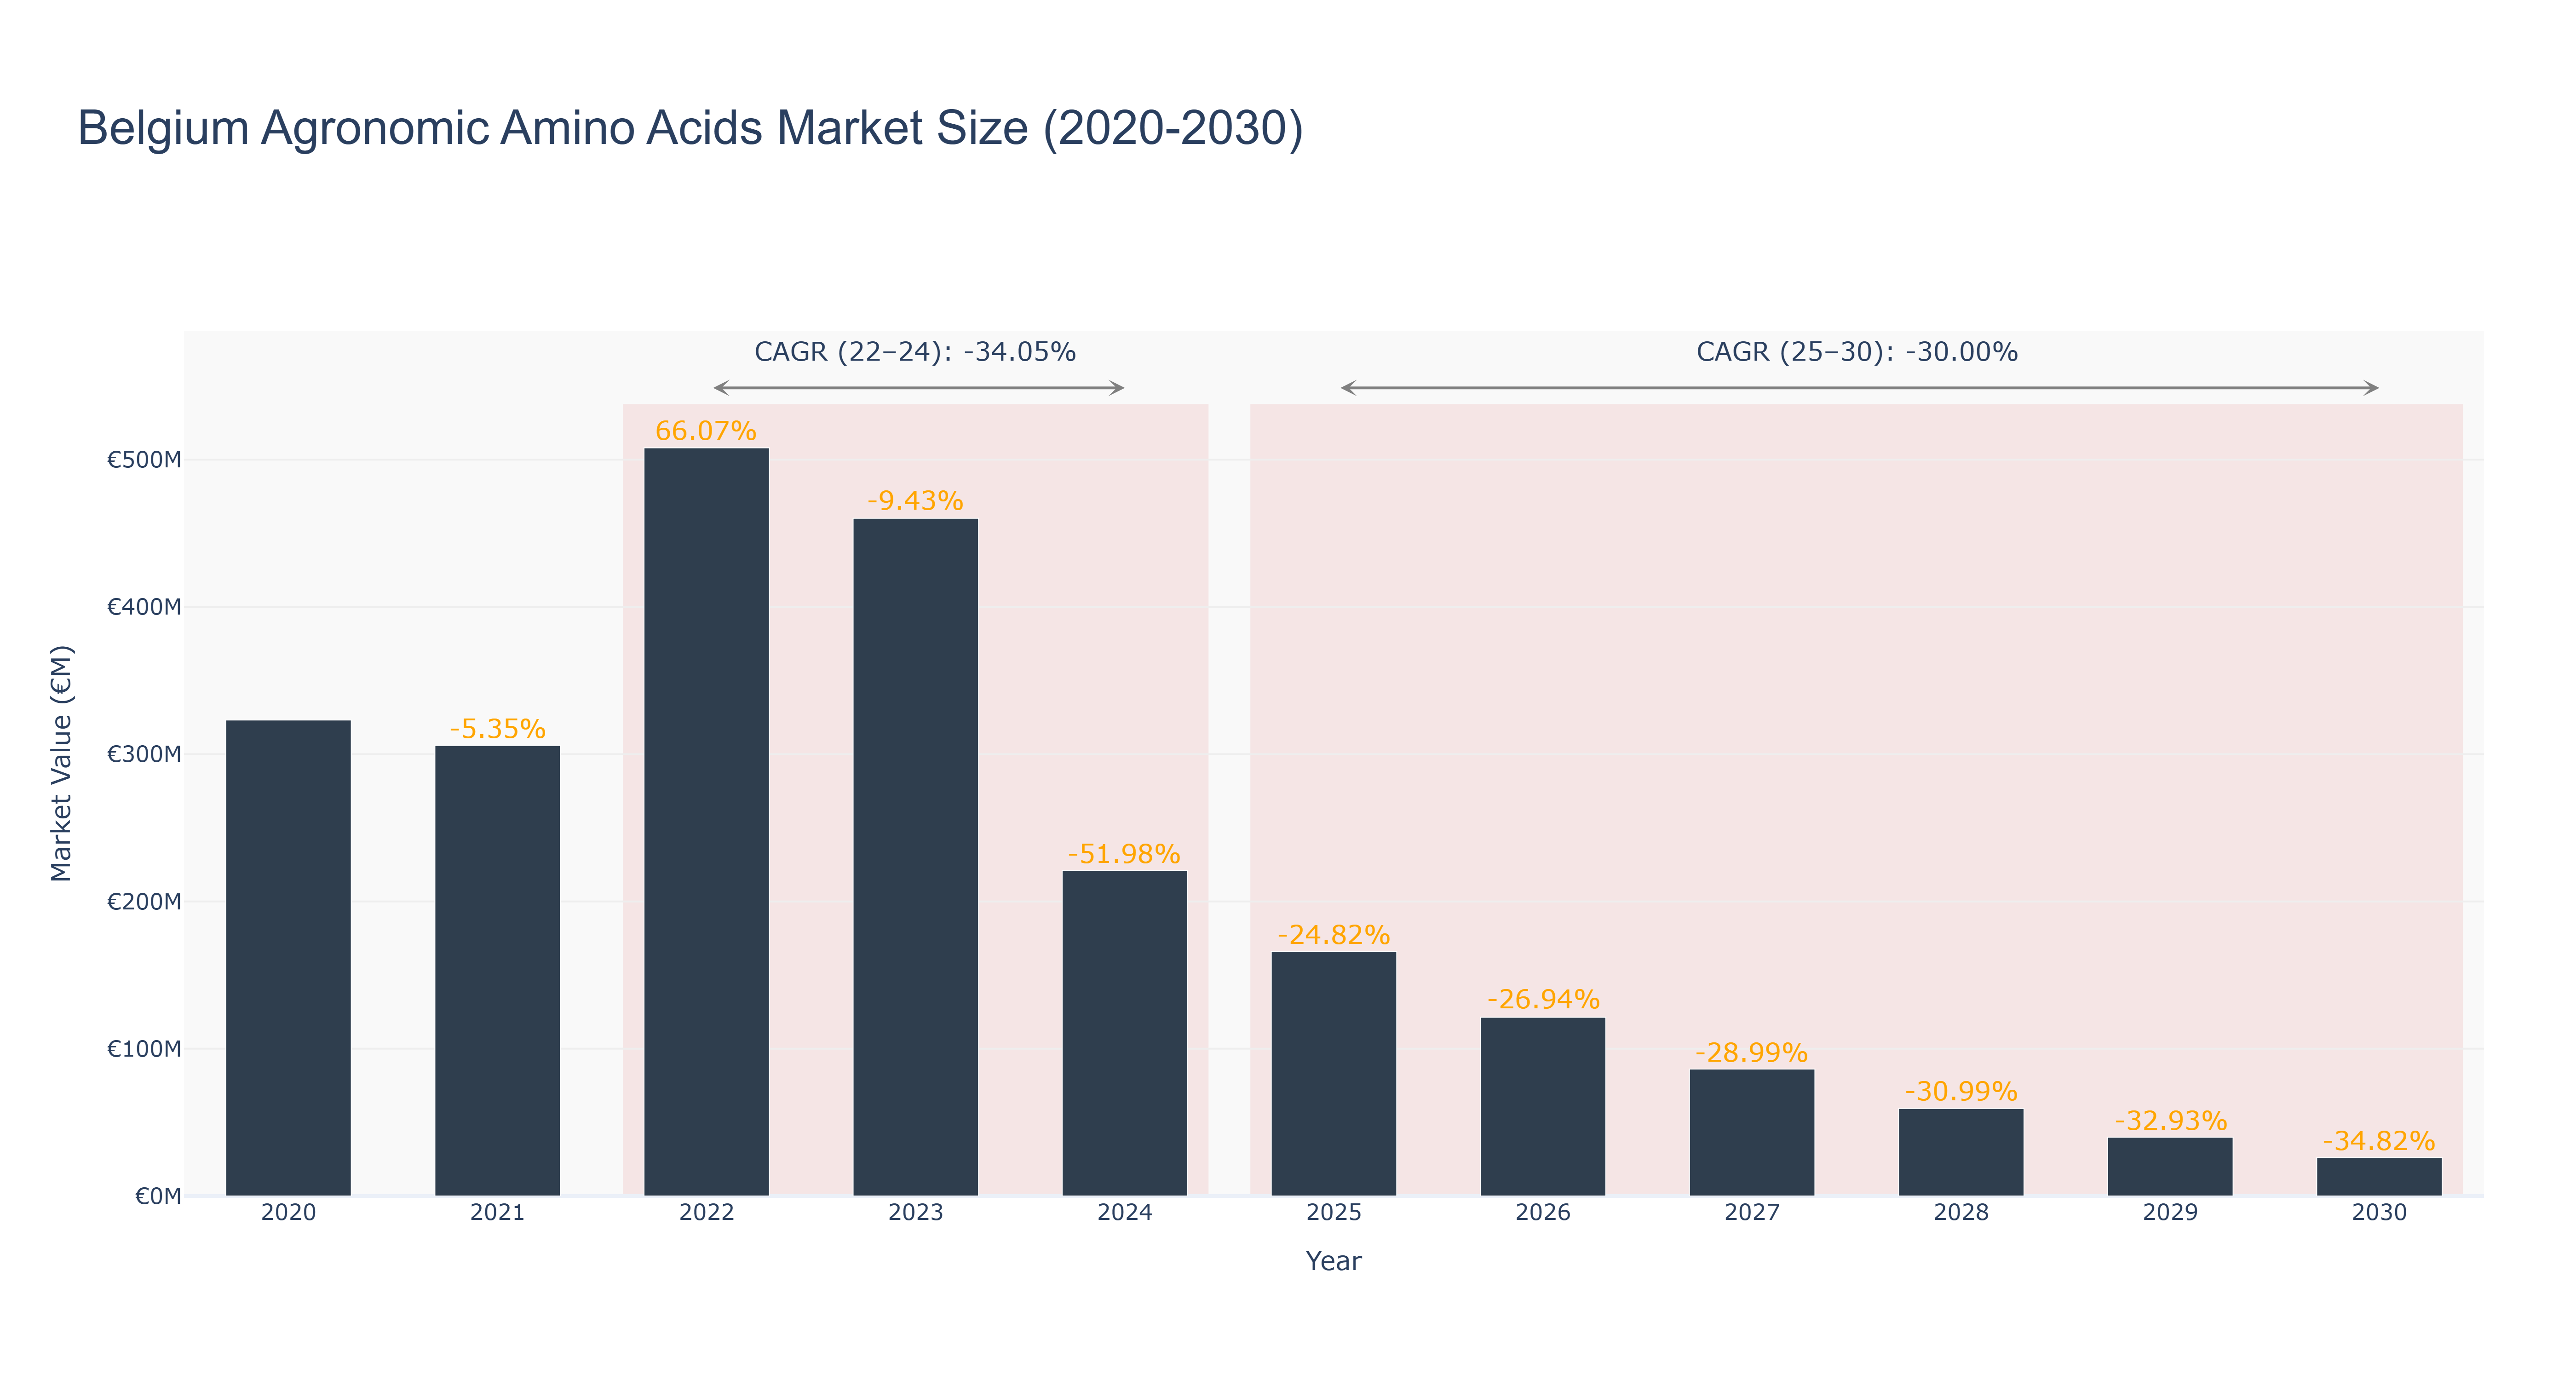
The Belgium Agronomic Amino Acids Market experienced significant fluctuations from 2020 to 2024, peaking in 2022 with a market size of €508.06 million, followed by a notable decline to €220.95 million in 2024, resulting in an actual CAGR of -34.05%. The decline can be attributed to market volatility, changing agricultural practices, and increased competition from alternative nutrients. Looking ahead, the forecasted period from 2025 to 2030 anticipates a continued contraction, with projected market sizes decreasing from €166.10 million in 2025 to €25.99 million by 2030, reflecting a CAGR of -30.00%. This declining trend may be driven by reduced demand for traditional agronomic amino acids as farmers increasingly adopt innovative fertilization techniques and biostimulants. While there are no specific upcoming projects highlighted, the overall move towards sustainable agriculture and precision farming may influence future market dynamics in Belgium.
Belgium Agronomic Amino Acids Market: Production & Trade Performance (2019-2025)
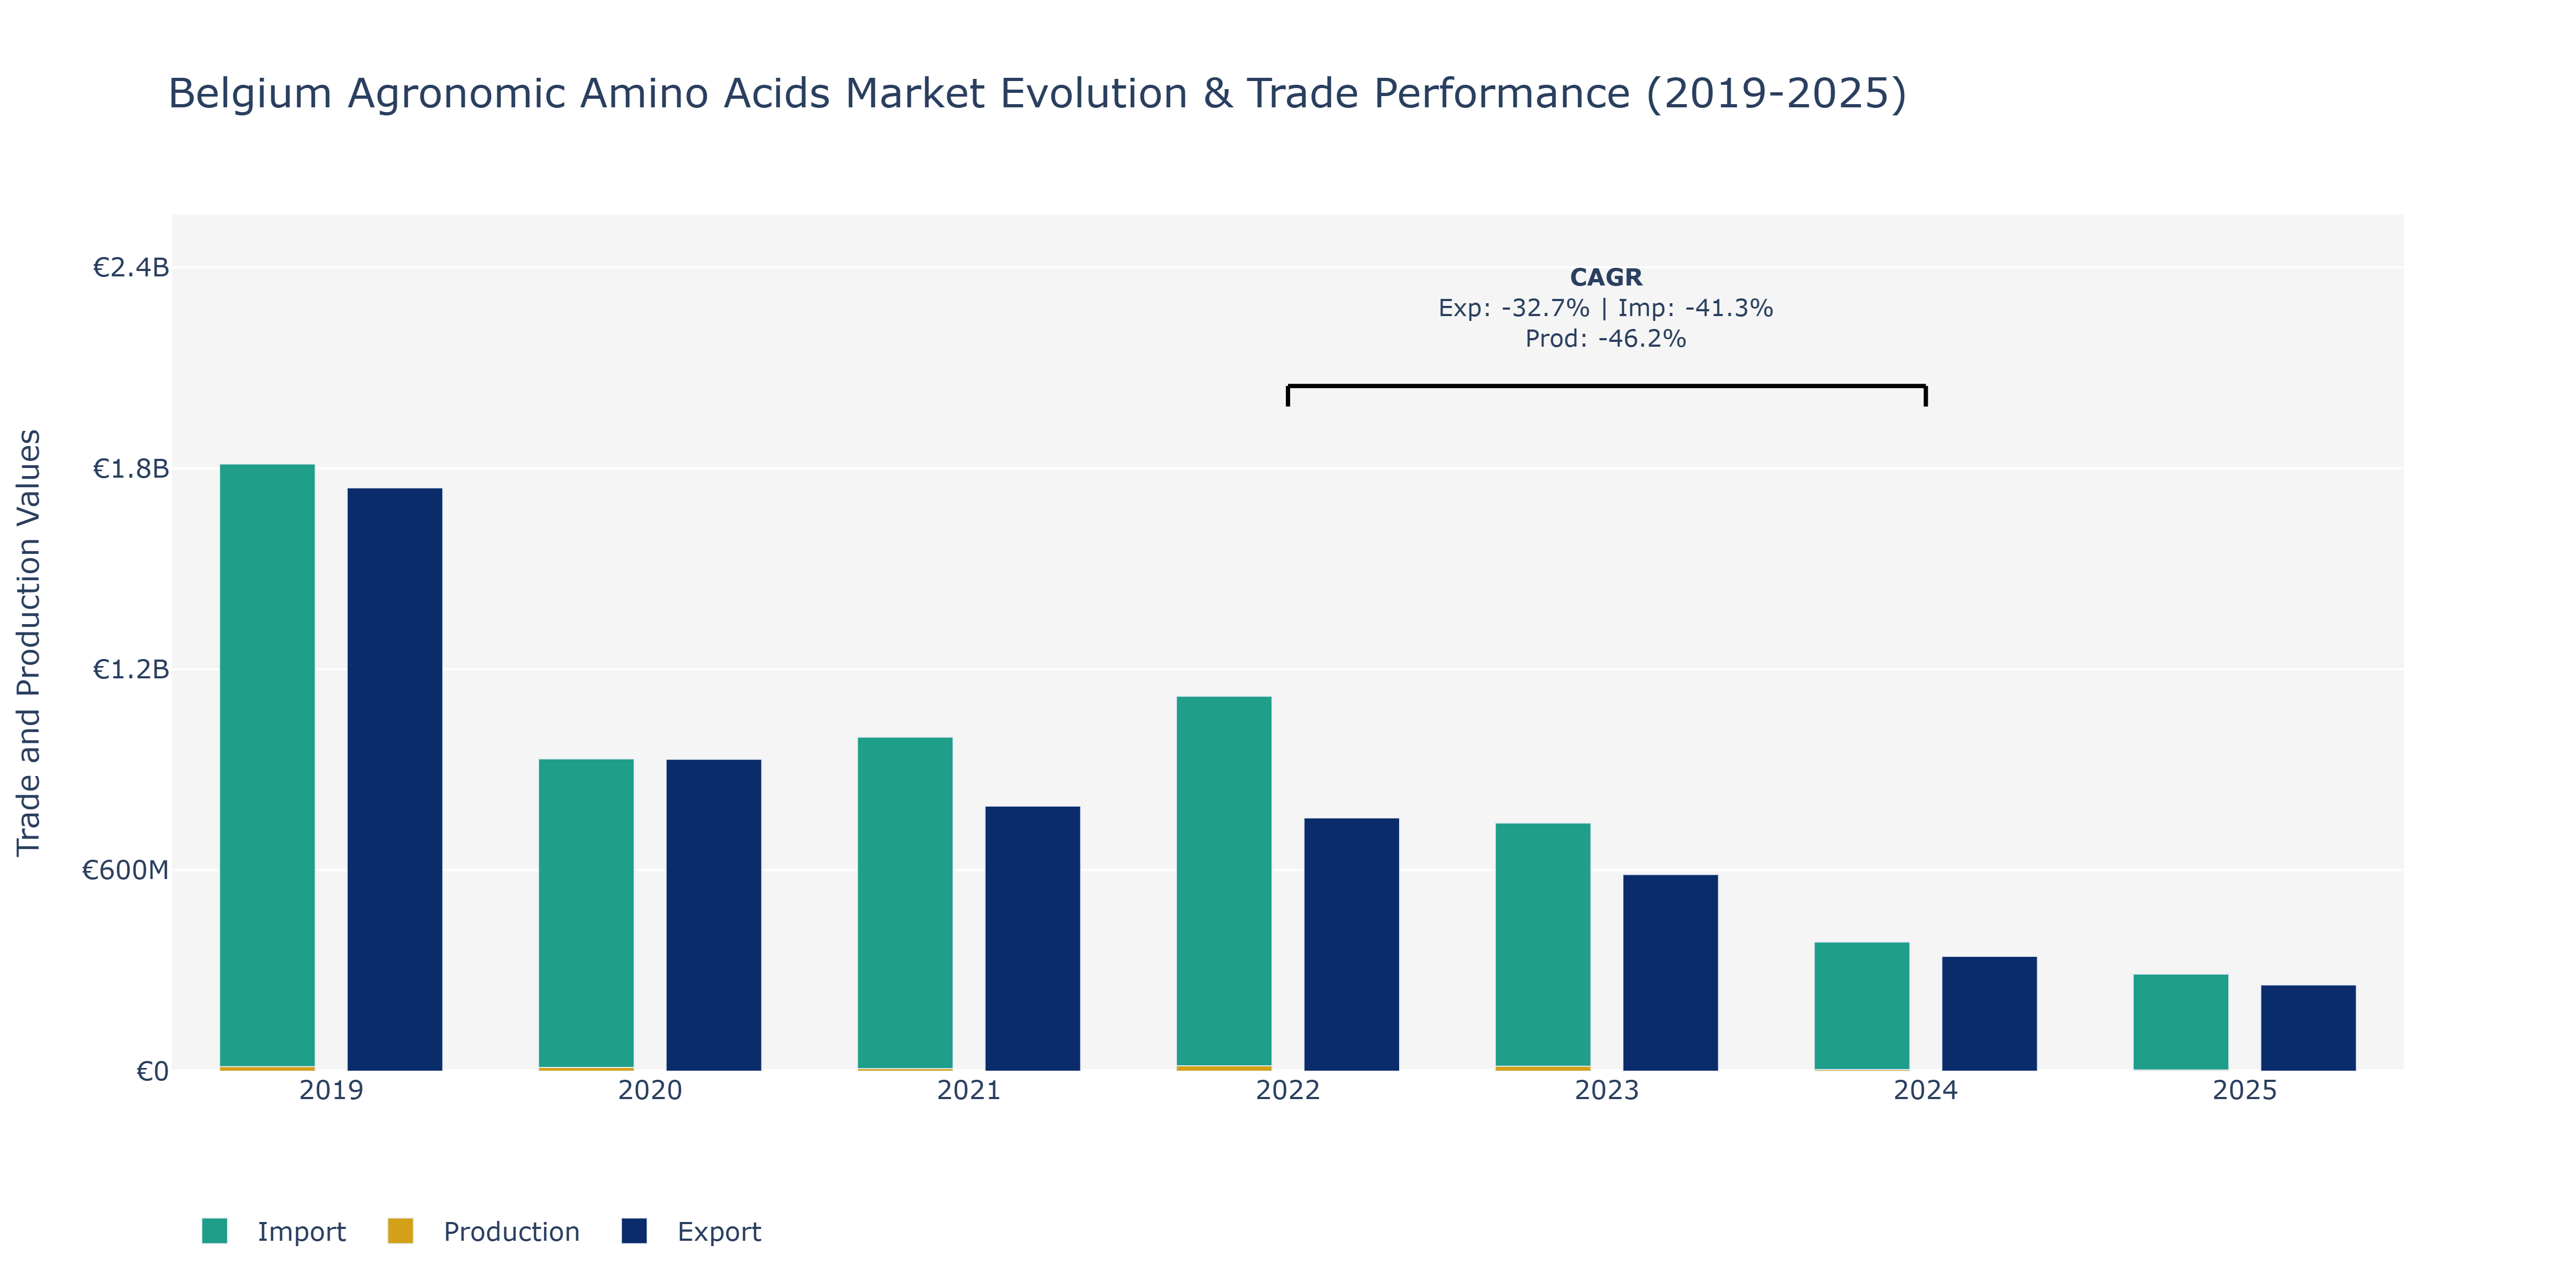
Between 2019 and 2025, Belgium's Agronomic Amino Acids Market experienced notable shifts in Exports, Imports, and Production. Exports saw a consistent decline, from €1.74 billion in 2019 to €0.26 billion in 2025. This decrease may be attributed to changing global demand patterns, impacting Belgium's competitiveness in the market. Imports remained relatively stable, hovering around €1.81 billion in 2019 and €0.29 billion by 2025. The stability may indicate a consistent need for imports to meet domestic demands. In contrast, Production levels fluctuated significantly, dropping from €13.47 million in 2019 to a low of €3.47 million in 2025. This decline could be due to various factors such as technological advancements leading to increased efficiency or shifts in resource allocation towards other product lines. To maintain competitiveness, stakeholders might consider diversifying product offerings or exploring new markets to mitigate the impact of declining production levels.
Key Highlights of the Report:
- Belgium Agronomic Amino Acids Market Outlook
- Market Size of Belgium Agronomic Amino Acids Market, 2025
- Forecast of Belgium Agronomic Amino Acids Market, 2032
- Historical Data and Forecast of Belgium Agronomic Amino Acids Revenues & Volume for the Period 2022 - 2032
- Belgium Agronomic Amino Acids Market Trend Evolution
- Belgium Agronomic Amino Acids Market Drivers and Challenges
- Belgium Agronomic Amino Acids Price Trends
- Belgium Agronomic Amino Acids Porter's Five Forces
- Belgium Agronomic Amino Acids Industry Life Cycle
- Historical Data and Forecast of Belgium Agronomic Amino Acids Market Revenues & Volume By Type for the Period 2022 - 2032
- Historical Data and Forecast of Belgium Agronomic Amino Acids Market Revenues & Volume By Lysine for the Period 2022 - 2032
- Historical Data and Forecast of Belgium Agronomic Amino Acids Market Revenues & Volume By Thymine for the Period 2022 - 2032
- Historical Data and Forecast of Belgium Agronomic Amino Acids Market Revenues & Volume By Methionine for the Period 2022 - 2032
- Historical Data and Forecast of Belgium Agronomic Amino Acids Market Revenues & Volume By Glutamic Acid for the Period 2022 - 2032
- Historical Data and Forecast of Belgium Agronomic Amino Acids Market Revenues & Volume By Alanine for the Period 2022 - 2032
- Historical Data and Forecast of Belgium Agronomic Amino Acids Market Revenues & Volume By Leucine for the Period 2022 - 2032
- Historical Data and Forecast of Belgium Agronomic Amino Acids Market Revenues & Volume By Arginine for the Period 2022 - 2032
- Historical Data and Forecast of Belgium Lysine Agronomic Amino Acids Market Revenues & Volume By Others for the Period 2022 - 2032
- Historical Data and Forecast of Belgium Agronomic Amino Acids Market Revenues & Volume By Source for the Period 2022 - 2032
- Historical Data and Forecast of Belgium Agronomic Amino Acids Market Revenues & Volume By Plant-based for the Period 2022 - 2032
- Historical Data and Forecast of Belgium Agronomic Amino Acids Market Revenues & Volume By Animal-based for the Period 2022 - 2032
- Historical Data and Forecast of Belgium Agronomic Amino Acids Market Revenues & Volume By Synthetic for the Period 2022 - 2032
- Historical Data and Forecast of Belgium Agronomic Amino Acids Market Revenues & Volume By Treatment Method for the Period 2022 - 2032
- Historical Data and Forecast of Belgium Agronomic Amino Acids Market Revenues & Volume By Foliar for the Period 2022 - 2032
- Historical Data and Forecast of Belgium Agronomic Amino Acids Market Revenues & Volume By Seed for the Period 2022 - 2032
- Historical Data and Forecast of Belgium Agronomic Amino Acids Market Revenues & Volume By Soil for the Period 2022 - 2032
- Historical Data and Forecast of Belgium Agronomic Amino Acids Market Revenues & Volume By Others for the Period 2022 - 2032
- Historical Data and Forecast of Belgium Agronomic Amino Acids Market Revenues & Volume By Application for the Period 2022 - 2032
- Historical Data and Forecast of Belgium Agronomic Amino Acids Market Revenues & Volume By Soil Amendment for the Period 2022 - 2032
- Historical Data and Forecast of Belgium Agronomic Amino Acids Market Revenues & Volume By Chlorophyll Synthesis for the Period 2022 - 2032
- Historical Data and Forecast of Belgium Agronomic Amino Acids Market Revenues & Volume By Roots Development for the Period 2022 - 2032
- Historical Data and Forecast of Belgium Agronomic Amino Acids Market Revenues & Volume By Bud Growth and Leaves Development for the Period 2022 - 2032
- Historical Data and Forecast of Belgium Agronomic Amino Acids Market Revenues & Volume By Crop Resistance for the Period 2022 - 2032
- Historical Data and Forecast of Belgium Agronomic Amino Acids Market Revenues & Volume By Ripening for the Period 2022 - 2032
- Historical Data and Forecast of Belgium Agronomic Amino Acids Market Revenues & Volume By Others for the Period 2022 - 2032
- Belgium Agronomic Amino Acids Import Export Trade Statistics
- Market Opportunity Assessment By Type
- Market Opportunity Assessment By Source
- Market Opportunity Assessment By Application
- Belgium Agronomic Amino Acids Top Companies Market Share
- Belgium Agronomic Amino Acids Competitive Benchmarking By Technical and Operational Parameters
- Belgium Agronomic Amino Acids Company Profiles
- Belgium Agronomic Amino Acids Key Strategic Recommendations
Frequently Asked Questions About the Market Study (FAQs):
6Wresearch actively monitors the Belgium Agronomic Amino Acids Market and publishes its comprehensive annual report, highlighting emerging trends, growth drivers, revenue analysis, and forecast outlook. Our insights help businesses to make data-backed strategic decisions with ongoing market dynamics. Our analysts track relevent industries related to the Belgium Agronomic Amino Acids Market, allowing our clients with actionable intelligence and reliable forecasts tailored to emerging regional needs.
Yes, we provide customisation as per your requirements. To learn more, feel free to contact us on sales@6wresearch.com
1 Executive Summary |
2 Introduction |
2.1 Key Highlights of the Report |
2.2 Report Description |
2.3 Market Scope & Segmentation |
2.4 Research Methodology |
2.5 Assumptions |
3 Belgium Agronomic Amino Acids Market Overview |
3.1 Belgium Country Macro Economic Indicators |
3.2 Belgium Agronomic Amino Acids Market Revenues & Volume, 2022 & 2032F |
3.3 Belgium Agronomic Amino Acids Market - Industry Life Cycle |
3.4 Belgium Agronomic Amino Acids Market - Porter's Five Forces |
3.5 Belgium Agronomic Amino Acids Market Revenues & Volume Share, By Type, 2022 & 2032F |
3.6 Belgium Agronomic Amino Acids Market Revenues & Volume Share, By Source, 2022 & 2032F |
3.7 Belgium Agronomic Amino Acids Market Revenues & Volume Share, By Application, 2022 & 2032F |
4 Belgium Agronomic Amino Acids Market Dynamics |
4.1 Impact Analysis |
4.2 Market Drivers |
4.2.1 Increasing demand for sustainable agricultural practices |
4.2.2 Growing awareness about the benefits of amino acids in crop production |
4.2.3 Government initiatives promoting organic farming practices |
4.3 Market Restraints |
4.3.1 Stringent regulations on the usage of amino acids in agriculture |
4.3.2 High production costs associated with agronomic amino acids |
4.3.3 Limited availability of advanced technology for amino acid production |
5 Belgium Agronomic Amino Acids Market Trends |
6 Belgium Agronomic Amino Acids Market, By Types |
6.1 Belgium Agronomic Amino Acids Market, By Type |
6.1.1 Overview and Analysis |
6.1.2 Belgium Agronomic Amino Acids Market Revenues & Volume, By Type, 2022 - 2032F |
6.1.3 Belgium Agronomic Amino Acids Market Revenues & Volume, By Lysine, 2022 - 2032F |
6.1.4 Belgium Agronomic Amino Acids Market Revenues & Volume, By Thymine, 2022 - 2032F |
6.1.5 Belgium Agronomic Amino Acids Market Revenues & Volume, By Methionine, 2022 - 2032F |
6.1.6 Belgium Agronomic Amino Acids Market Revenues & Volume, By Glutamic Acid, 2022 - 2032F |
6.1.7 Belgium Agronomic Amino Acids Market Revenues & Volume, By Alanine, 2022 - 2032F |
6.1.8 Belgium Agronomic Amino Acids Market Revenues & Volume, By Leucine, 2022 - 2032F |
6.1.9 Belgium Agronomic Amino Acids Market Revenues & Volume, By Others, 2022 - 2032F |
6.1.10 Belgium Agronomic Amino Acids Market Revenues & Volume, By Others, 2022 - 2032F |
6.2 Belgium Agronomic Amino Acids Market, By Source |
6.2.1 Overview and Analysis |
6.2.2 Belgium Agronomic Amino Acids Market Revenues & Volume, By Plant-based, 2022 - 2032F |
6.2.3 Belgium Agronomic Amino Acids Market Revenues & Volume, By Animal-based, 2022 - 2032F |
6.2.4 Belgium Agronomic Amino Acids Market Revenues & Volume, By Synthetic, 2022 - 2032F |
6.2.5 Belgium Agronomic Amino Acids Market Revenues & Volume, By Treatment Method, 2022 - 2032F |
6.2.6 Belgium Agronomic Amino Acids Market Revenues & Volume, By Foliar, 2022 - 2032F |
6.2.7 Belgium Agronomic Amino Acids Market Revenues & Volume, By Seed, 2022 - 2032F |
6.2.8 Belgium Agronomic Amino Acids Market Revenues & Volume, By Others, 2022 - 2032F |
6.2.9 Belgium Agronomic Amino Acids Market Revenues & Volume, By Others, 2022 - 2032F |
6.3 Belgium Agronomic Amino Acids Market, By Application |
6.3.1 Overview and Analysis |
6.3.2 Belgium Agronomic Amino Acids Market Revenues & Volume, By Soil Amendment, 2022 - 2032F |
6.3.3 Belgium Agronomic Amino Acids Market Revenues & Volume, By Chlorophyll Synthesis, 2022 - 2032F |
6.3.4 Belgium Agronomic Amino Acids Market Revenues & Volume, By Roots Development, 2022 - 2032F |
6.3.5 Belgium Agronomic Amino Acids Market Revenues & Volume, By Bud Growth and Leaves Development, 2022 - 2032F |
6.3.6 Belgium Agronomic Amino Acids Market Revenues & Volume, By Crop Resistance, 2022 - 2032F |
6.3.7 Belgium Agronomic Amino Acids Market Revenues & Volume, By Ripening, 2022 - 2032F |
7 Belgium Agronomic Amino Acids Market Import-Export Trade Statistics |
7.1 Belgium Agronomic Amino Acids Market Export to Major Countries |
7.2 Belgium Agronomic Amino Acids Market Imports from Major Countries |
8 Belgium Agronomic Amino Acids Market Key Performance Indicators |
8.1 Average yield improvement percentage in crops using agronomic amino acids |
8.2 Adoption rate of amino acid-based fertilizers in Belgium |
8.3 Number of research and development projects focused on enhancing amino acid formulations for agricultural use |
9 Belgium Agronomic Amino Acids Market - Opportunity Assessment |
9.1 Belgium Agronomic Amino Acids Market Opportunity Assessment, By Type, 2022 & 2032F |
9.2 Belgium Agronomic Amino Acids Market Opportunity Assessment, By Source, 2022 & 2032F |
9.3 Belgium Agronomic Amino Acids Market Opportunity Assessment, By Application, 2022 & 2032F |
10 Belgium Agronomic Amino Acids Market - Competitive Landscape |
10.1 Belgium Agronomic Amino Acids Market Revenue Share, By Companies, 2025 |
10.2 Belgium Agronomic Amino Acids Market Competitive Benchmarking, By Operating and Technical Parameters |
11 Company Profiles |
12 Recommendations |
13 Disclaimer |
Export potential assessment - trade Analytics for 2030
Export potential enables firms to identify high-growth global markets with greater confidence by combining advanced trade intelligence with a structured quantitative methodology. The framework analyzes emerging demand trends and country-level import patterns while integrating macroeconomic and trade datasets such as GDP and population forecasts, bilateral import–export flows, tariff structures, elasticity differentials between developed and developing economies, geographic distance, and import demand projections. Using weighted trade values from 2020–2024 as the base period to project country-to-country export potential for 2030, these inputs are operationalized through calculated drivers such as gravity model parameters, tariff impact factors, and projected GDP per-capita growth. Through an analysis of hidden potentials, demand hotspots, and market conditions that are most favorable to success, this method enables firms to focus on target countries, maximize returns, and global expansion with data, backed by accuracy.
By factoring in the projected importer demand gap that is currently unmet and could be potential opportunity, it identifies the potential for the Exporter (Country) among 190 countries, against the general trade analysis, which identifies the biggest importer or exporter.
To discover high-growth global markets and optimize your business strategy:
Click Here
Pricing
- Single User License$ 1,995
- Department License$ 2,400
- Site License$ 3,120
- Global License$ 3,795

Search
Thought Leadership and Analyst Meet


Our Clients
Latest Reports
- China Electric Appliance Rental Market (2026-2032) | Trends, Revenue, Growth, Challenges, Size, Value, Outlook, Pricing, Strategy, Insights, Restraints, segmentation, Companies, Investment Opportunities, Analysis, Demand, Drivers, Competition, Forecast, Share
- Chile Electric Appliance Rental Market (2026-2032) | Outlook, Competition, Drivers, Strategy, Revenue, Analysis, Value, Pricing, Restraints, Size, Demand, Share, Growth, Forecast, Challenges, Insights, Investment Opportunities, Companies, Trends, segmentation
- Cambodia Electric Appliance Rental Market (2026-2032) | Companies, Analysis, Restraints, Pricing, Insights, Challenges, Outlook, Strategy, Forecast, Trends, Competition, Value, Revenue, Investment Opportunities, segmentation, Drivers, Size, Demand, Growth, Share
- Brazil Electric Appliance Rental Market (2026-2032) | Revenue, Strategy, Forecast, Companies, segmentation, Competition, Size, Investment Opportunities, Pricing, Restraints, Outlook, Challenges, Analysis, Drivers, Value, Demand, Insights, Trends, Growth, Share
- Bangladesh Electric Appliance Rental Market (2026-2032) | Drivers, Forecast, Investment Opportunities, Strategy, Insights, Demand, Challenges, Outlook, Trends, Competition, Value, Revenue, Size, Pricing, Analysis, Companies, Restraints, segmentation, Share, Growth
- Bahrain Electric Appliance Rental Market (2026-2032) | Outlook, Size, Competition, Restraints, Drivers, Value, Trends, Investment Opportunities, Insights, Forecast, Revenue, Strategy, Growth, Share, Demand, Analysis, Challenges, Companies, segmentation, Pricing
- Azerbaijan Electric Appliance Rental Market (2026-2032) | Trends, Investment Opportunities, Restraints, Insights, Strategy, Competition, Value, Growth, Demand, Drivers, Analysis, Forecast, Size, Share, Outlook, segmentation, Pricing, Challenges, Revenue, Companies
- Australia Electric Appliance Rental Market (2026-2032) | Challenges, Restraints, Forecast, Demand, Size, Competition, Pricing, Investment Opportunities, Revenue, Trends, Drivers, Growth, Outlook, Analysis, Strategy, Value, segmentation, Insights, Companies, Share
- Argentina Electric Appliance Rental Market (2026-2032) | Growth, Trends, Insights, Outlook, Forecast, Size, Drivers, Analysis, Restraints, Challenges, Share, Revenue, Investment Opportunities, Strategy, Demand, Value, Companies, segmentation, Competition, Pricing
- Algeria Electric Appliance Rental Market (2026-2032) | Share, Size, Value, Strategy, Competition, Outlook, Challenges, Companies, Trends, Pricing, Insights, Forecast, Investment Opportunities, Revenue, Growth, Restraints, segmentation, Analysis, Demand, Drivers
Industry Events and Analyst Meet

HIMTEX 2026

India Refining Summit 2026

India EV Show 2026

EV tech India Expo 2026

Auto Tech Asia 2026
Whitepaper
- Middle East & Africa Commercial Security Market Click here to view more.
- Middle East & Africa Fire Safety Systems & Equipment Market Click here to view more.
- GCC Drone Market Click here to view more.
- Middle East Lighting Fixture Market Click here to view more.
- GCC Physical & Perimeter Security Market Click here to view more.
6WResearch In News
- Doha a strategic location for EV manufacturing hub: IPA Qatar
- Demand for luxury TVs surging in the GCC, says Samsung
- Empowering Growth: The Thriving Journey of Bangladesh’s Cable Industry
- Demand for luxury TVs surging in the GCC, says Samsung
- Video call with a traditional healer? Once unthinkable, it’s now common in South Africa
- Intelligent Buildings To Smooth GCC’s Path To Net Zero