Belgium Digital TV SoC Market (2026-2032) | Drivers, Supply, Analysis, Value, Share, Competitive, Strategic Insights, Restraints, Revenue, Industry, Investment Trends, Opportunities, Consumer Insights, Pricing Analysis, Strategy, Competition, Growth, Forecast, Challenges, Trends, Demand, Companies, Size, Segmentation, Outlook, Segments
Market Forecast By Type (Set-top Boxes, Smart TVs, Streaming Sticks & Dongles), By Resolution (HD, 4K, 8K), By Operating System (Android TV, Roku OS, Amazon Fire TV OS), By Application (Streaming Services (Netflix, Amazon Prime Video, Disney+), Social Media Apps (Facebook, Twitter), Games (Apple Arcade, Google Stadia)), By Connectivity (Wi-Fi, Ethernet, Bluetooth) And Competitive Landscape
| Product Code: ETC11749762 | Publication Date: Apr 2025 | Updated Date: Apr 2026 | Product Type: Market Research Report | |
| Publisher: 6Wresearch | No. of Pages: 65 | No. of Figures: 34 | No. of Tables: 19 | |
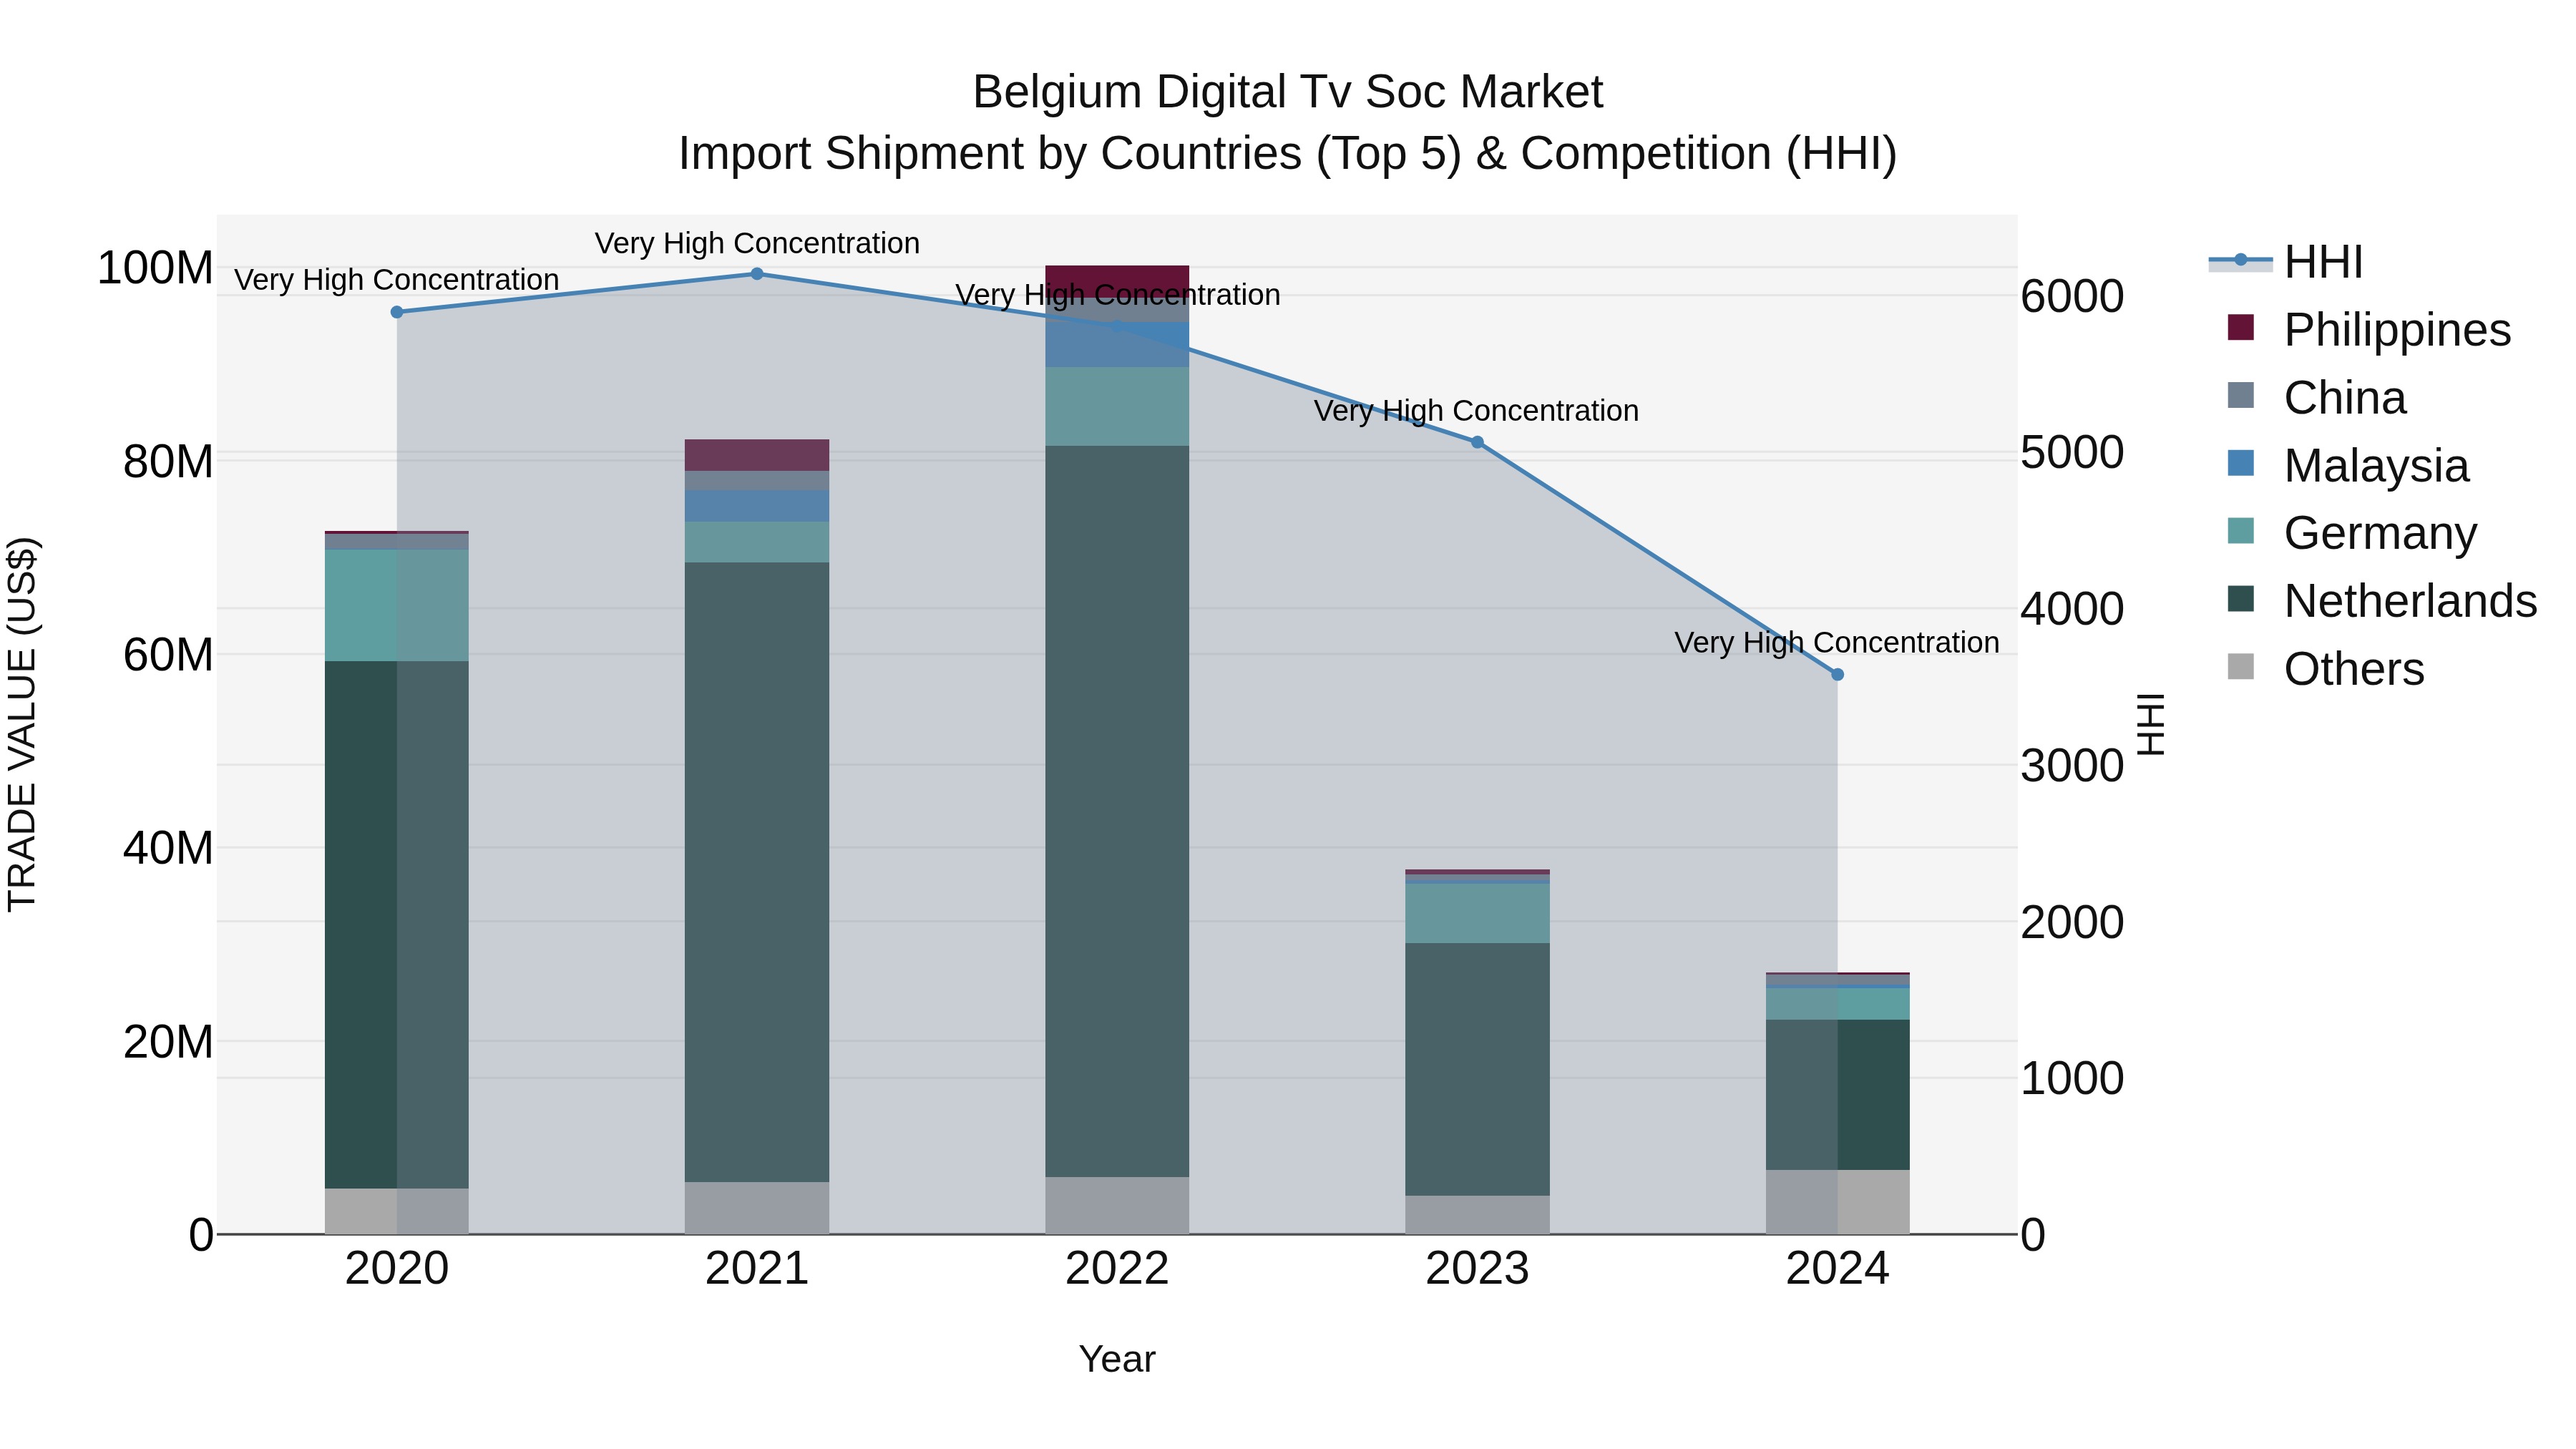
Belgium Digital Tv Soc Market Top 5 Importing Countries and Market Competition (HHI) Analysis
In 2024, Belgium continued to be a key importer of digital TV system-on-chip (SoC) products, with significant shipments coming from top exporting countries such as Netherlands, Germany, Japan, Taiwan, Province of China, and China. Despite the high Herfindahl-Hirschman Index (HHI) indicating concentrated market competition, the industry experienced a sharp decline in growth with a negative Compound Annual Growth Rate (CAGR) of -21.9% from 2020 to 2024. The year-on-year growth rate in 2024 also showed a notable decrease of -28.37%, reflecting challenges and shifts in the digital TV SoC market landscape.
Key Highlights of the Report:
- Belgium Digital TV SoC Market Outlook
- Market Size of Belgium Digital TV SoC Market, 2025
- Forecast of Belgium Digital TV SoC Market, 2032
- Historical Data and Forecast of Belgium Digital TV SoC Revenues & Volume for the Period 2022 - 2032F
- Belgium Digital TV SoC Market Trend Evolution
- Belgium Digital TV SoC Market Drivers and Challenges
- Belgium Digital TV SoC Price Trends
- Belgium Digital TV SoC Porter's Five Forces
- Belgium Digital TV SoC Industry Life Cycle
- Historical Data and Forecast of Belgium Digital TV SoC Market Revenues & Volume By Type for the Period 2022 - 2032F
- Historical Data and Forecast of Belgium Digital TV SoC Market Revenues & Volume By Set-top Boxes for the Period 2022 - 2032F
- Historical Data and Forecast of Belgium Digital TV SoC Market Revenues & Volume By Smart TVs for the Period 2022 - 2032F
- Historical Data and Forecast of Belgium Digital TV SoC Market Revenues & Volume By Streaming Sticks & Dongles for the Period 2022 - 2032F
- Historical Data and Forecast of Belgium Digital TV SoC Market Revenues & Volume By Resolution for the Period 2022 - 2032F
- Historical Data and Forecast of Belgium Digital TV SoC Market Revenues & Volume By HD for the Period 2022 - 2032F
- Historical Data and Forecast of Belgium Digital TV SoC Market Revenues & Volume By 4K for the Period 2022 - 2032F
- Historical Data and Forecast of Belgium Digital TV SoC Market Revenues & Volume By 8K for the Period 2022 - 2032F
- Historical Data and Forecast of Belgium Digital TV SoC Market Revenues & Volume By Operating System for the Period 2022 - 2032F
- Historical Data and Forecast of Belgium Digital TV SoC Market Revenues & Volume By Android TV for the Period 2022 - 2032F
- Historical Data and Forecast of Belgium Digital TV SoC Market Revenues & Volume By Roku OS for the Period 2022 - 2032F
- Historical Data and Forecast of Belgium Digital TV SoC Market Revenues & Volume By Amazon Fire TV OS for the Period 2022 - 2032F
- Historical Data and Forecast of Belgium Digital TV SoC Market Revenues & Volume By Application for the Period 2022 - 2032F
- Historical Data and Forecast of Belgium Digital TV SoC Market Revenues & Volume By Streaming Services (Netflix, Amazon Prime Video, Disney+) for the Period 2022 - 2032F
- Historical Data and Forecast of Belgium Digital TV SoC Market Revenues & Volume By Social Media Apps (Facebook, Twitter) for the Period 2022 - 2032F
- Historical Data and Forecast of Belgium Digital TV SoC Market Revenues & Volume By Games (Apple Arcade, Google Stadia) for the Period 2022 - 2032F
- Historical Data and Forecast of Belgium Digital TV SoC Market Revenues & Volume By Connectivity for the Period 2022 - 2032F
- Historical Data and Forecast of Belgium Digital TV SoC Market Revenues & Volume By Wi-Fi for the Period 2022 - 2032F
- Historical Data and Forecast of Belgium Digital TV SoC Market Revenues & Volume By Ethernet for the Period 2022 - 2032F
- Historical Data and Forecast of Belgium Digital TV SoC Market Revenues & Volume By Bluetooth for the Period 2022 - 2032F
- Belgium Digital TV SoC Import Export Trade Statistics
- Market Opportunity Assessment By Type
- Market Opportunity Assessment By Resolution
- Market Opportunity Assessment By Operating System
- Market Opportunity Assessment By Application
- Market Opportunity Assessment By Connectivity
- Belgium Digital TV SoC Top Companies Market Share
- Belgium Digital TV SoC Competitive Benchmarking By Technical and Operational Parameters
- Belgium Digital TV SoC Company Profiles
- Belgium Digital TV SoC Key Strategic Recommendations
Frequently Asked Questions About the Market Study (FAQs):
6Wresearch actively monitors the Belgium Digital TV SoC Market and publishes its comprehensive annual report, highlighting emerging trends, growth drivers, revenue analysis, and forecast outlook. Our insights help businesses to make data-backed strategic decisions with ongoing market dynamics. Our analysts track relevent industries related to the Belgium Digital TV SoC Market, allowing our clients with actionable intelligence and reliable forecasts tailored to emerging regional needs.
Yes, we provide customisation as per your requirements. To learn more, feel free to contact us on sales@6wresearch.com
1 Executive Summary |
2 Introduction |
2.1 Key Highlights of the Report |
2.2 Report Description |
2.3 Market Scope & Segmentation |
2.4 Research Methodology |
2.5 Assumptions |
3 Belgium Digital TV SoC Market Overview |
3.1 Belgium Country Macro Economic Indicators |
3.2 Belgium Digital TV SoC Market Revenues & Volume, 2022 & 2032F |
3.3 Belgium Digital TV SoC Market - Industry Life Cycle |
3.4 Belgium Digital TV SoC Market - Porter's Five Forces |
3.5 Belgium Digital TV SoC Market Revenues & Volume Share, By Type, 2022 & 2032F |
3.6 Belgium Digital TV SoC Market Revenues & Volume Share, By Resolution, 2022 & 2032F |
3.7 Belgium Digital TV SoC Market Revenues & Volume Share, By Operating System, 2022 & 2032F |
3.8 Belgium Digital TV SoC Market Revenues & Volume Share, By Application, 2022 & 2032F |
3.9 Belgium Digital TV SoC Market Revenues & Volume Share, By Connectivity, 2022 & 2032F |
4 Belgium Digital TV SoC Market Dynamics |
4.1 Impact Analysis |
4.2 Market Drivers |
4.2.1 Increasing demand for high-definition content |
4.2.2 Growth in internet penetration and digitalization |
4.2.3 Technological advancements in digital TV set-top boxes |
4.2.4 Rising disposable income leading to higher spending on entertainment |
4.2.5 Shift towards on-demand and streaming services |
4.3 Market Restraints |
4.3.1 Regulatory challenges in the digital TV market |
4.3.2 High initial investment for customers to switch to digital TV |
4.3.3 Competition from alternative entertainment options like online gaming |
4.3.4 Limited availability of high-speed internet in certain regions |
4.3.5 Concerns over data privacy and security in digital TV services |
5 Belgium Digital TV SoC Market Trends |
6 Belgium Digital TV SoC Market, By Types |
6.1 Belgium Digital TV SoC Market, By Type |
6.1.1 Overview and Analysis |
6.1.2 Belgium Digital TV SoC Market Revenues & Volume, By Type, 2022 - 2032F |
6.1.3 Belgium Digital TV SoC Market Revenues & Volume, By Set-top Boxes, 2022 - 2032F |
6.1.4 Belgium Digital TV SoC Market Revenues & Volume, By Smart TVs, 2022 - 2032F |
6.1.5 Belgium Digital TV SoC Market Revenues & Volume, By Streaming Sticks & Dongles, 2022 - 2032F |
6.2 Belgium Digital TV SoC Market, By Resolution |
6.2.1 Overview and Analysis |
6.2.2 Belgium Digital TV SoC Market Revenues & Volume, By HD, 2022 - 2032F |
6.2.3 Belgium Digital TV SoC Market Revenues & Volume, By 4K, 2022 - 2032F |
6.2.4 Belgium Digital TV SoC Market Revenues & Volume, By 8K, 2022 - 2032F |
6.3 Belgium Digital TV SoC Market, By Operating System |
6.3.1 Overview and Analysis |
6.3.2 Belgium Digital TV SoC Market Revenues & Volume, By Android TV, 2022 - 2032F |
6.3.3 Belgium Digital TV SoC Market Revenues & Volume, By Roku OS, 2022 - 2032F |
6.3.4 Belgium Digital TV SoC Market Revenues & Volume, By Amazon Fire TV OS, 2022 - 2032F |
6.3.5 Belgium Digital TV SoC Market Revenues & Volume, By LG WebOS, 2022 - 2032F |
6.3.6 Belgium Digital TV SoC Market Revenues & Volume, By Samsung Tizen, 2022 - 2032F |
6.4 Belgium Digital TV SoC Market, By Application |
6.4.1 Overview and Analysis |
6.4.2 Belgium Digital TV SoC Market Revenues & Volume, By Streaming Services (Netflix, Amazon Prime Video, Disney+), 2022 - 2032F |
6.4.3 Belgium Digital TV SoC Market Revenues & Volume, By Social Media Apps (Facebook, Twitter), 2022 - 2032F |
6.4.4 Belgium Digital TV SoC Market Revenues & Volume, By Games (Apple Arcade, Google Stadia), 2022 - 2032F |
6.5 Belgium Digital TV SoC Market, By Connectivity |
6.5.1 Overview and Analysis |
6.5.2 Belgium Digital TV SoC Market Revenues & Volume, By Wi-Fi, 2022 - 2032F |
6.5.3 Belgium Digital TV SoC Market Revenues & Volume, By Ethernet, 2022 - 2032F |
6.5.4 Belgium Digital TV SoC Market Revenues & Volume, By Bluetooth, 2022 - 2032F |
7 Belgium Digital TV SoC Market Import-Export Trade Statistics |
7.1 Belgium Digital TV SoC Market Export to Major Countries |
7.2 Belgium Digital TV SoC Market Imports from Major Countries |
8 Belgium Digital TV SoC Market Key Performance Indicators |
8.1 Average revenue per user (ARPU) for digital TV services |
8.2 Subscriber retention rate |
8.3 Average time spent per user on digital TV content |
8.4 Number of households adopting digital TV services |
8.5 Customer satisfaction scores for digital TV service quality |
9 Belgium Digital TV SoC Market - Opportunity Assessment |
9.1 Belgium Digital TV SoC Market Opportunity Assessment, By Type, 2022 & 2032F |
9.2 Belgium Digital TV SoC Market Opportunity Assessment, By Resolution, 2022 & 2032F |
9.3 Belgium Digital TV SoC Market Opportunity Assessment, By Operating System, 2022 & 2032F |
9.4 Belgium Digital TV SoC Market Opportunity Assessment, By Application, 2022 & 2032F |
9.5 Belgium Digital TV SoC Market Opportunity Assessment, By Connectivity, 2022 & 2032F |
10 Belgium Digital TV SoC Market - Competitive Landscape |
10.1 Belgium Digital TV SoC Market Revenue Share, By Companies, 2025 |
10.2 Belgium Digital TV SoC Market Competitive Benchmarking, By Operating and Technical Parameters |
11 Company Profiles |
12 Recommendations |
13 Disclaimer |
Export potential assessment - trade Analytics for 2030
Export potential enables firms to identify high-growth global markets with greater confidence by combining advanced trade intelligence with a structured quantitative methodology. The framework analyzes emerging demand trends and country-level import patterns while integrating macroeconomic and trade datasets such as GDP and population forecasts, bilateral import–export flows, tariff structures, elasticity differentials between developed and developing economies, geographic distance, and import demand projections. Using weighted trade values from 2020–2024 as the base period to project country-to-country export potential for 2030, these inputs are operationalized through calculated drivers such as gravity model parameters, tariff impact factors, and projected GDP per-capita growth. Through an analysis of hidden potentials, demand hotspots, and market conditions that are most favorable to success, this method enables firms to focus on target countries, maximize returns, and global expansion with data, backed by accuracy.
By factoring in the projected importer demand gap that is currently unmet and could be potential opportunity, it identifies the potential for the Exporter (Country) among 190 countries, against the general trade analysis, which identifies the biggest importer or exporter.
To discover high-growth global markets and optimize your business strategy:
Click Here
Pricing
- Single User License$ 1,995
- Department License$ 2,400
- Site License$ 3,120
- Global License$ 3,795

Search
Thought Leadership and Analyst Meet


Our Clients
Latest Reports
- France Thermally Conductive Filler Dispersants Market (2026-2032) | Challenges, Restraints, Value, Share, Size, segmentation, Analysis, Trends, Investment Opportunities, Outlook, Pricing, Demand, Forecast, Revenue, Companies, Growth, Drivers, Strategy, Insights, Competition
- Egypt Thermally Conductive Filler Dispersants Market (2026-2032) | Competition, Forecast, Strategy, Value, Insights, Outlook, Investment Opportunities, Pricing, Demand, Share, segmentation, Drivers, Size, Companies, Restraints, Growth, Trends, Revenue, Challenges, Analysis
- Czech Republic Thermally Conductive Filler Dispersants Market (2026-2032) | Forecast, Pricing, Analysis, Drivers, Insights, Size, Demand, Growth, Challenges, segmentation, Competition, Outlook, Trends, Investment Opportunities, Companies, Strategy, Revenue, Share, Value, Restraints
- Colombia Thermally Conductive Filler Dispersants Market (2026-2032) | segmentation, Trends, Share, Drivers, Strategy, Companies, Demand, Insights, Size, Challenges, Value, Competition, Analysis, Growth, Revenue, Restraints, Forecast, Pricing, Outlook, Investment Opportunities
- China Thermally Conductive Filler Dispersants Market (2026-2032) | Restraints, Investment Opportunities, Pricing, Companies, Share, Size, Challenges, Trends, Outlook, Value, Analysis, Competition, Revenue, Drivers, Forecast, Demand, Insights, Growth, Strategy, segmentation
- Chile Thermally Conductive Filler Dispersants Market (2026-2032) | Investment Opportunities, Trends, Value, Restraints, Share, Companies, Forecast, segmentation, Pricing, Challenges, Demand, Size, Analysis, Drivers, Outlook, Growth, Competition, Strategy, Revenue, Insights
- Cambodia Thermally Conductive Filler Dispersants Market (2026-2032) | Analysis, Share, Outlook, Strategy, Pricing, Demand, Size, Growth, segmentation, Insights, Revenue, Forecast, Challenges, Competition, Companies, Investment Opportunities, Trends, Restraints, Value, Drivers
- Brazil Thermally Conductive Filler Dispersants Market (2026-2032) | Restraints, Forecast, Competition, Size, Revenue, Value, Investment Opportunities, Trends, Insights, Outlook, Growth, Analysis, Drivers, segmentation, Pricing, Challenges, Strategy, Share, Companies, Demand
- Bangladesh Thermally Conductive Filler Dispersants Market (2026-2032) | Restraints, Trends, Analysis, Competition, Insights, Forecast, Value, Investment Opportunities, Pricing, Share, Demand, Outlook, Revenue, segmentation, Companies, Drivers, Growth, Size, Challenges, Strategy
- Bahrain Thermally Conductive Filler Dispersants Market (2026-2032) | Trends, Outlook, Pricing, Demand, Value, Competition, Forecast, Growth, segmentation, Revenue, Companies, Analysis, Insights, Size, Drivers, Challenges, Strategy, Investment Opportunities, Share, Restraints
Industry Events and Analyst Meet

HIMTEX 2026

India Refining Summit 2026

India EV Show 2026

EV tech India Expo 2026

Auto Tech Asia 2026
Whitepaper
- Middle East & Africa Commercial Security Market Click here to view more.
- Middle East & Africa Fire Safety Systems & Equipment Market Click here to view more.
- GCC Drone Market Click here to view more.
- Middle East Lighting Fixture Market Click here to view more.
- GCC Physical & Perimeter Security Market Click here to view more.
6WResearch In News
- Doha a strategic location for EV manufacturing hub: IPA Qatar
- Demand for luxury TVs surging in the GCC, says Samsung
- Empowering Growth: The Thriving Journey of Bangladesh’s Cable Industry
- Demand for luxury TVs surging in the GCC, says Samsung
- Video call with a traditional healer? Once unthinkable, it’s now common in South Africa
- Intelligent Buildings To Smooth GCC’s Path To Net Zero