Belgium Earthenware Market (2026-2032) | Forecast, Share, Industry, Revenue, Trends, Segmentation, Size, Value, Analysis, Growth, Outlook & Companies
Market Forecast By Type (Delftware, Creamware, Terracotta, Ironstone Ware, Yellowware, Raku, Victorian Majolica, Others), By Application (Tableware, Flower Pots, Decorative Articles, Others) And Competitive Landscape
| Product Code: ETC5096297 | Publication Date: Nov 2023 | Updated Date: Apr 2026 | Product Type: Market Research Report | |
| Publisher: 6Wresearch | Author: Shubham Padhi | No. of Pages: 60 | No. of Figures: 30 | No. of Tables: 5 |
Belgium Earthenware Market Size (2020-2030)
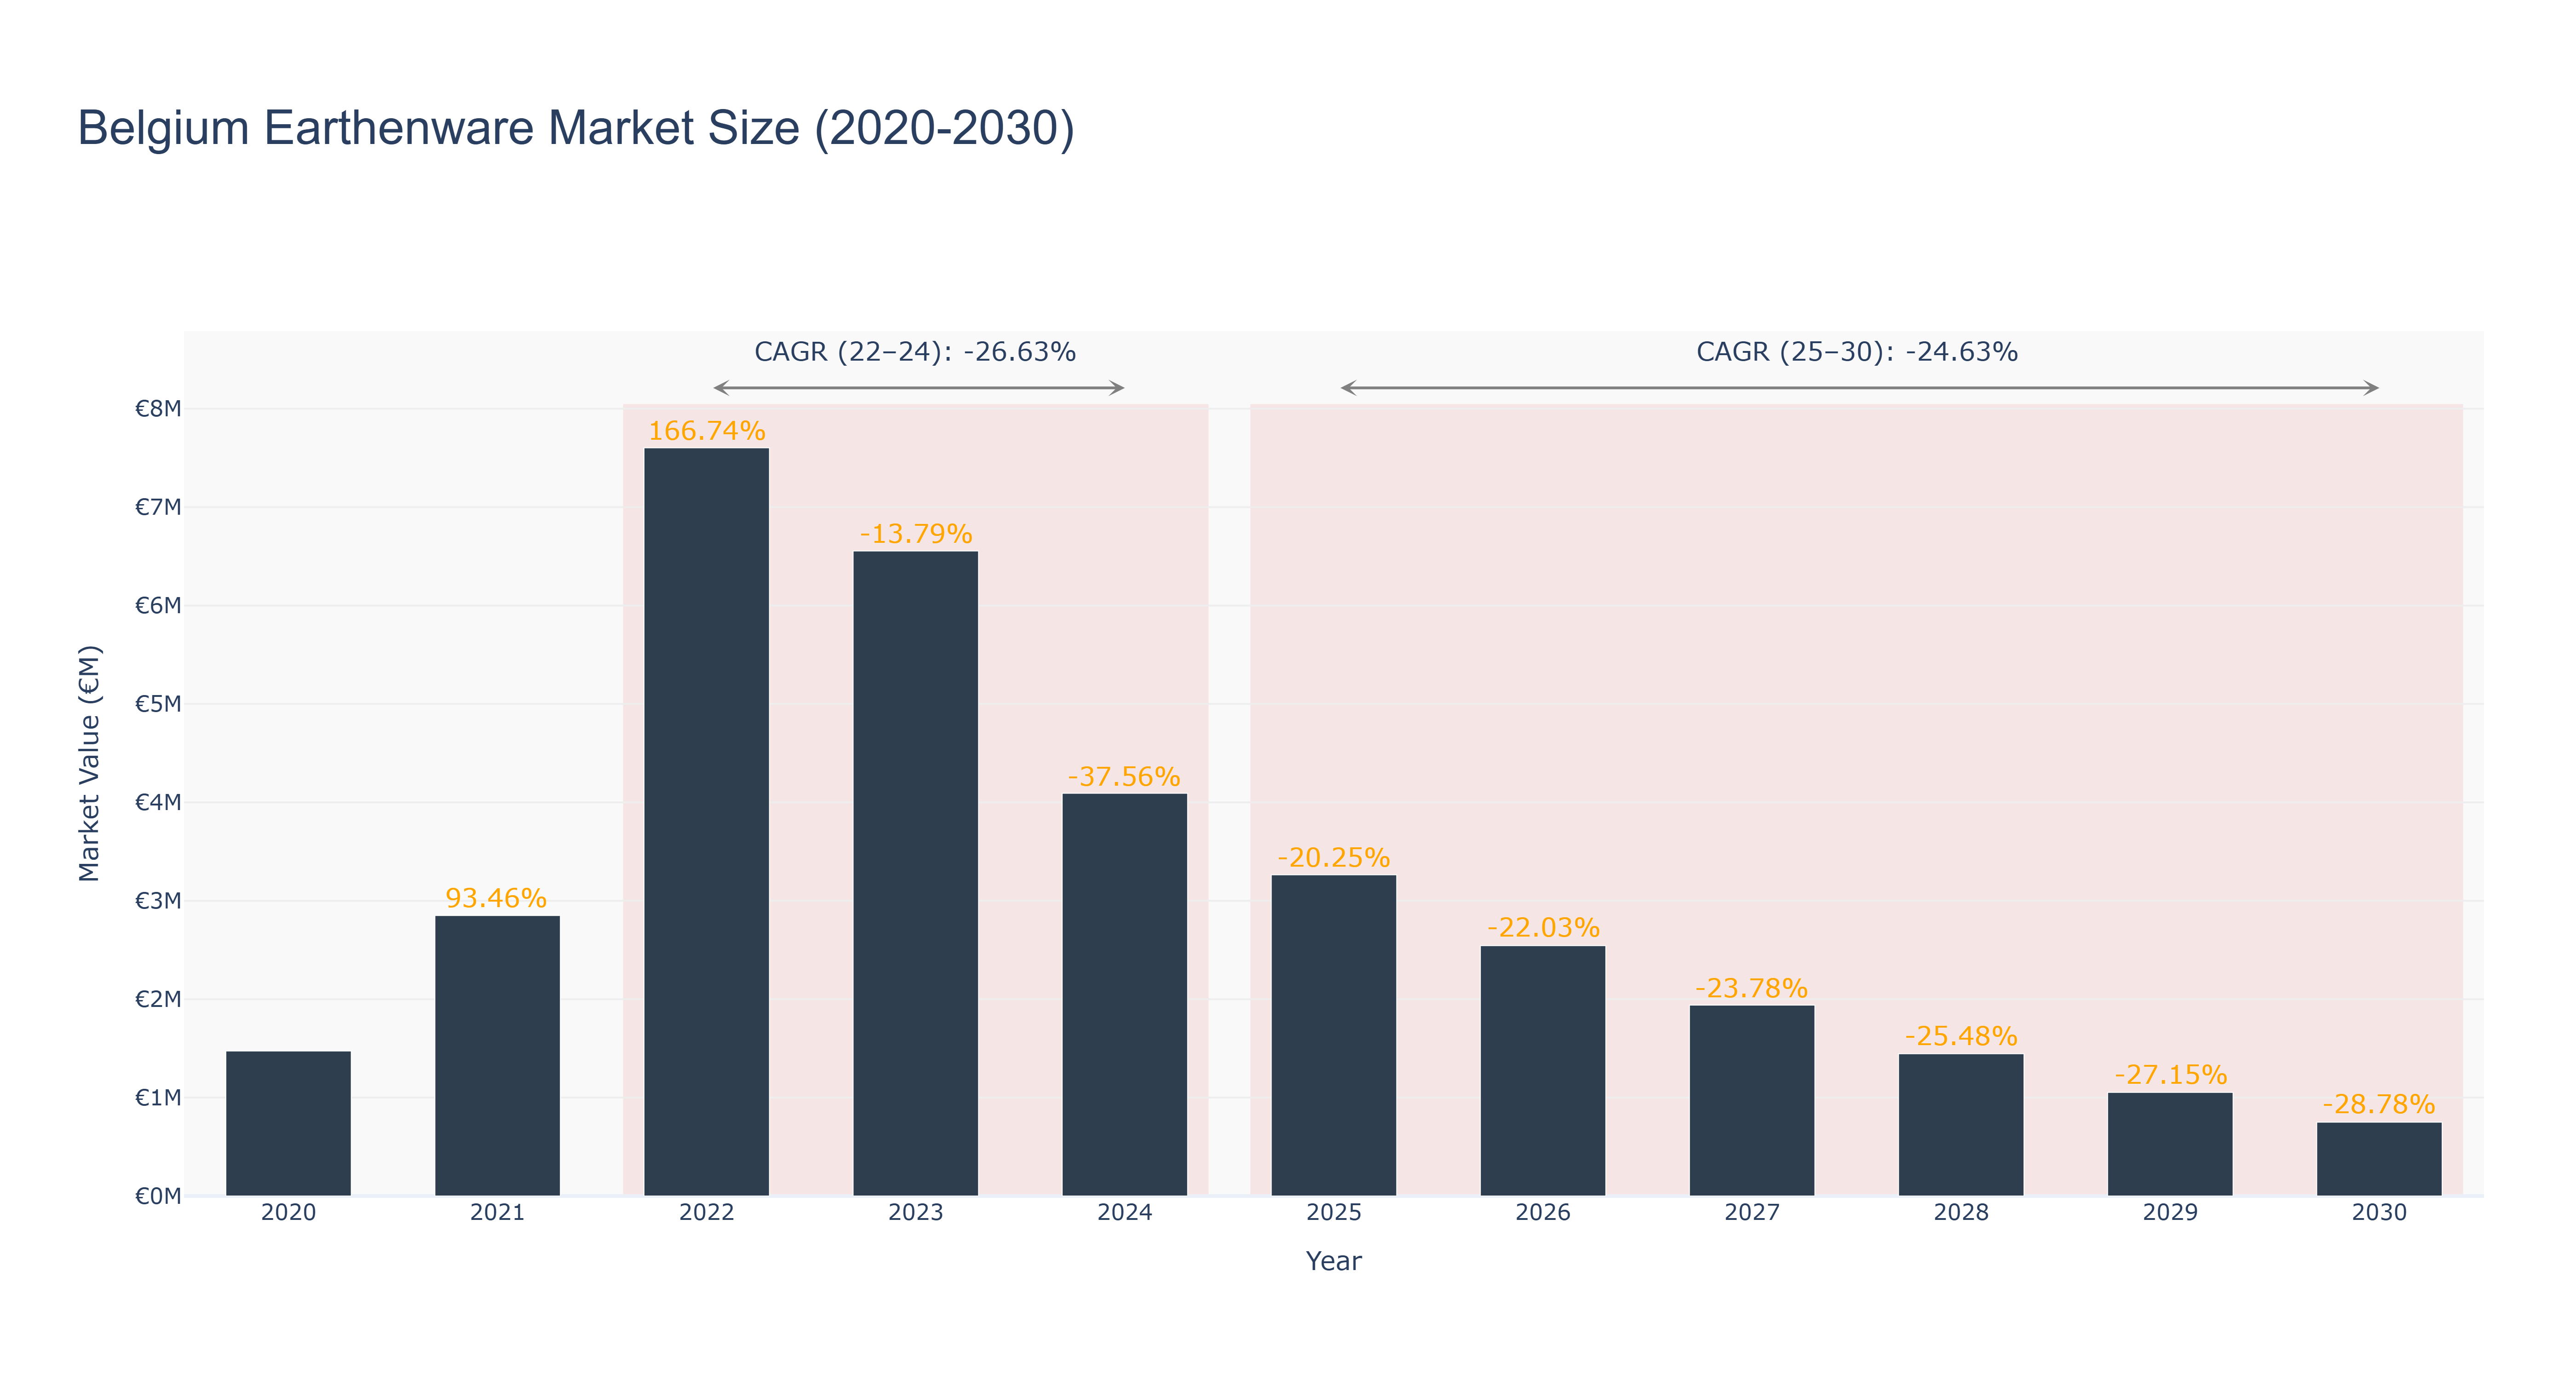
Belgium Earthenware Market has shown a fluctuating trend in recent years. The peak market size of €7.60 million was recorded in 2022, followed by a decline to €3.26 million in 2025. Forecasted market sizes indicate a further decrease to €0.75 million by 2030. The CAGR values also reflect this downward trajectory, with a -26.63% CAGR from 2022 to 2024 and a -24.63% CAGR from 2025 to 2030. The market's decline can be attributed to changing consumer preferences towards more modern materials and designs, as well as economic uncertainties impacting consumer spending. Looking ahead, Belgium is set to invest in sustainable earthenware production processes to align with environmental regulations and consumer demand for eco-friendly products, aiming to revitalize the market and cater to evolving consumer needs.
Belgium Earthenware Market: Production & Trade Performance (2019-2025)
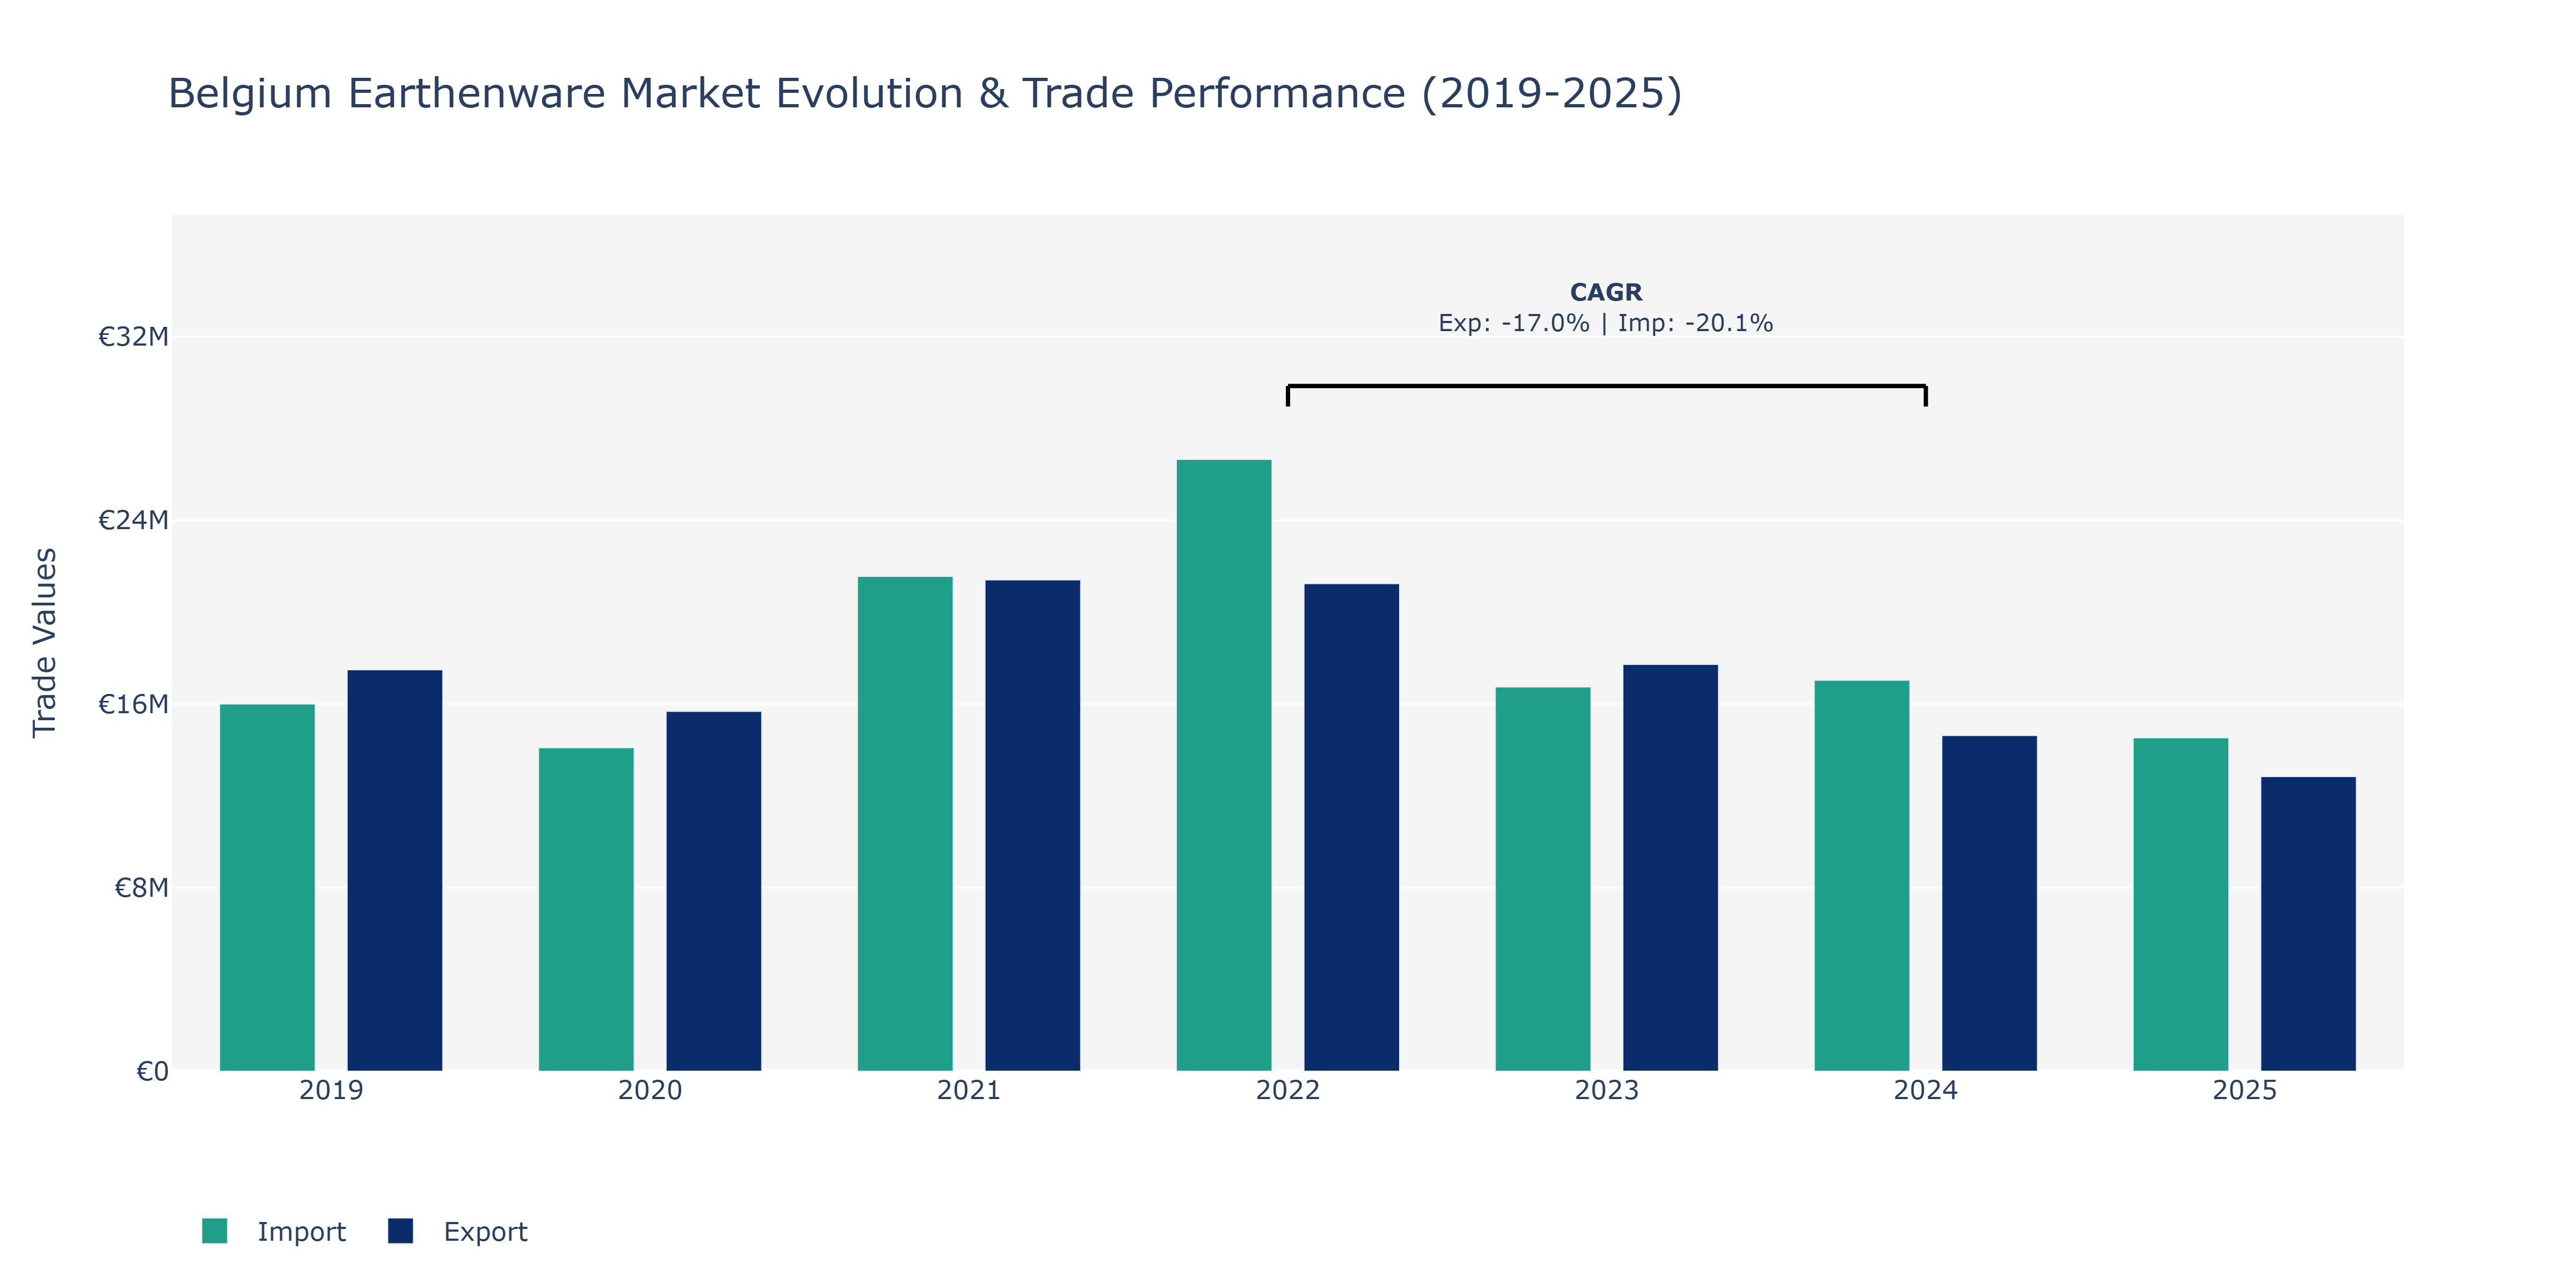
In the Belgium Earthenware Market, exports experienced fluctuations during the period under review. Starting at €17.49 million in 2019, exports declined to €15.68 million in 2020, before showing a significant increase to €21.41 million in 2021. Subsequently, a slight decrease was observed in 2022 to €21.24 million, followed by a notable drop to €17.72 million in 2023 and a further decline to €14.62 million in 2024. By 2025, exports reduced to €12.84 million. On the other hand, imports also displayed variable trends, starting at €16.00 million in 2019. Imports decreased to €14.10 million in 2020 but then rose to €21.56 million in 2021. Import value peaked in 2022 at €26.66 million before declining to €16.74 million in 2023 and further to €17.04 million in 2024, and €14.53 million in 2025. These fluctuations in exports and imports can be attributed to changing consumer preferences, global economic conditions, and trade policies affecting the earthenware market in Belgium.
Key Highlights of the Report:
- Belgium Earthenware Market Outlook
- Market Size of Belgium Earthenware Market, 2025
- Forecast of Belgium Earthenware Market, 2032
- Historical Data and Forecast of Belgium Earthenware Revenues & Volume for the Period 2022 - 2032F
- Belgium Earthenware Market Trend Evolution
- Belgium Earthenware Market Drivers and Challenges
- Belgium Earthenware Price Trends
- Belgium Earthenware Porter`s Five Forces
- Belgium Earthenware Industry Life Cycle
- Historical Data and Forecast of Belgium Earthenware Market Revenues & Volume By Type for the Period 2022 - 2032F
- Historical Data and Forecast of Belgium Earthenware Market Revenues & Volume By Delftware for the Period 2022 - 2032F
- Historical Data and Forecast of Belgium Earthenware Market Revenues & Volume By Creamware for the Period 2022 - 2032F
- Historical Data and Forecast of Belgium Earthenware Market Revenues & Volume By Terracotta for the Period 2022 - 2032F
- Historical Data and Forecast of Belgium Earthenware Market Revenues & Volume By Ironstone Ware for the Period 2022 - 2032F
- Historical Data and Forecast of Belgium Earthenware Market Revenues & Volume By Yellowware for the Period 2022 - 2032F
- Historical Data and Forecast of Belgium Earthenware Market Revenues & Volume By Raku for the Period 2022 - 2032F
- Historical Data and Forecast of Belgium Earthenware Market Revenues & Volume By Victorian Majolica for the Period 2022 - 2032F
- Historical Data and Forecast of Belgium Delftware Earthenware Market Revenues & Volume By Others for the Period 2022 - 2032F
- Historical Data and Forecast of Belgium Earthenware Market Revenues & Volume By Application for the Period 2022 - 2032F
- Historical Data and Forecast of Belgium Earthenware Market Revenues & Volume By Tableware for the Period 2022 - 2032F
- Historical Data and Forecast of Belgium Earthenware Market Revenues & Volume By Flower Pots for the Period 2022 - 2032F
- Historical Data and Forecast of Belgium Earthenware Market Revenues & Volume By Decorative Articles for the Period 2022 - 2032F
- Historical Data and Forecast of Belgium Earthenware Market Revenues & Volume By Others for the Period 2022 - 2032F
- Belgium Earthenware Import Export Trade Statistics
- Market Opportunity Assessment By Type
- Market Opportunity Assessment By Application
- Belgium Earthenware Top Companies Market Share
- Belgium Earthenware Competitive Benchmarking By Technical and Operational Parameters
- Belgium Earthenware Company Profiles
- Belgium Earthenware Key Strategic Recommendations
Frequently Asked Questions About the Market Study (FAQs):
6Wresearch actively monitors the Belgium Earthenware Market and publishes its comprehensive annual report, highlighting emerging trends, growth drivers, revenue analysis, and forecast outlook. Our insights help businesses to make data-backed strategic decisions with ongoing market dynamics. Our analysts track relevent industries related to the Belgium Earthenware Market, allowing our clients with actionable intelligence and reliable forecasts tailored to emerging regional needs.
Yes, we provide customisation as per your requirements. To learn more, feel free to contact us on sales@6wresearch.com
1 Executive Summary |
2 Introduction |
2.1 Key Highlights of the Report |
2.2 Report Description |
2.3 Market Scope & Segmentation |
2.4 Research Methodology |
2.5 Assumptions |
3 Belgium Earthenware Market Overview |
3.1 Belgium Country Macro Economic Indicators |
3.2 Belgium Earthenware Market Revenues & Volume, 2022 & 2032F |
3.3 Belgium Earthenware Market - Industry Life Cycle |
3.4 Belgium Earthenware Market - Porter's Five Forces |
3.5 Belgium Earthenware Market Revenues & Volume Share, By Type, 2022 & 2032F |
3.6 Belgium Earthenware Market Revenues & Volume Share, By Application, 2022 & 2032F |
4 Belgium Earthenware Market Dynamics |
4.1 Impact Analysis |
4.2 Market Drivers |
4.2.1 Growing demand for eco-friendly and sustainable products in the consumer goods sector |
4.2.2 Increasing focus on artisanal and handmade products in the home decor market |
4.2.3 Rising popularity of ethnic and traditional designs in tableware and kitchenware |
4.3 Market Restraints |
4.3.1 Intense competition from alternative materials such as glass, stainless steel, and plastic |
4.3.2 Fluctuations in raw material prices impacting production costs |
4.3.3 Challenges in maintaining consistent quality due to the handmade nature of earthenware products |
5 Belgium Earthenware Market Trends |
6 Belgium Earthenware Market Segmentations |
6.1 Belgium Earthenware Market, By Type |
6.1.1 Overview and Analysis |
6.1.2 Belgium Earthenware Market Revenues & Volume, By Delftware, 2022 - 2032F |
6.1.3 Belgium Earthenware Market Revenues & Volume, By Creamware, 2022 - 2032F |
6.1.4 Belgium Earthenware Market Revenues & Volume, By Terracotta, 2022 - 2032F |
6.1.5 Belgium Earthenware Market Revenues & Volume, By Ironstone Ware, 2022 - 2032F |
6.1.6 Belgium Earthenware Market Revenues & Volume, By Yellowware, 2022 - 2032F |
6.1.7 Belgium Earthenware Market Revenues & Volume, By Raku, 2022 - 2032F |
6.1.9 Belgium Earthenware Market Revenues & Volume, By Others, 2022 - 2032F |
6.1.10 Belgium Earthenware Market Revenues & Volume, By Others, 2022 - 2032F |
6.2 Belgium Earthenware Market, By Application |
6.2.1 Overview and Analysis |
6.2.2 Belgium Earthenware Market Revenues & Volume, By Tableware, 2022 - 2032F |
6.2.3 Belgium Earthenware Market Revenues & Volume, By Flower Pots, 2022 - 2032F |
6.2.4 Belgium Earthenware Market Revenues & Volume, By Decorative Articles, 2022 - 2032F |
6.2.5 Belgium Earthenware Market Revenues & Volume, By Others, 2022 - 2032F |
7 Belgium Earthenware Market Import-Export Trade Statistics |
7.1 Belgium Earthenware Market Export to Major Countries |
7.2 Belgium Earthenware Market Imports from Major Countries |
8 Belgium Earthenware Market Key Performance Indicators |
8.1 Percentage of revenue from new product launches in the earthenware segment |
8.2 Customer satisfaction scores related to product design and quality |
8.3 Number of partnerships with retailers or e-commerce platforms to expand market reach |
9 Belgium Earthenware Market - Opportunity Assessment |
9.1 Belgium Earthenware Market Opportunity Assessment, By Type, 2022 & 2032F |
9.2 Belgium Earthenware Market Opportunity Assessment, By Application, 2022 & 2032F |
10 Belgium Earthenware Market - Competitive Landscape |
10.1 Belgium Earthenware Market Revenue Share, By Companies, 2025 |
10.2 Belgium Earthenware Market Competitive Benchmarking, By Operating and Technical Parameters |
11 Company Profiles |
12 Recommendations | 13 Disclaimer |
Global Go To Market Strategy - 2030
Export potential enables firms to identify high-growth global markets with greater confidence by combining advanced trade intelligence with a structured quantitative methodology. The framework analyzes emerging demand trends and country-level import patterns while integrating macroeconomic and trade datasets such as GDP and population forecasts, bilateral import–export flows, tariff structures, elasticity differentials between developed and developing economies, geographic distance, and import demand projections. Using weighted trade values from 2020–2024 as the base period to project country-to-country export potential for 2030, these inputs are operationalized through calculated drivers such as gravity model parameters, tariff impact factors, and projected GDP per-capita growth. Through an analysis of hidden potentials, demand hotspots, and market conditions that are most favorable to success, this method enables firms to focus on target countries, maximize returns, and global expansion with data, backed by accuracy.
By factoring in the projected importer demand gap that is currently unmet and could be potential opportunity, it identifies the potential for the Exporter (Country) among 190 countries, against the general trade analysis, which identifies the biggest importer or exporter.
To discover high-growth global markets and optimize your business strategy:
Click Here
Pricing
- Single User License$ 1,995
- Department License$ 2,400
- Site License$ 3,120
- Global License$ 3,795

Leadership Perspectives from Industry Events
Search
Thought Leadership and Analyst Meet


Our Clients
6WResearch In News
- India Export Attractiveness Tracker 2026
- India Air Conditioner Market Set for Strong Rebound in 2026 After Weather-Led Correction and GST-Driven Recovery: 6Wresearch
- ADAS in India: How Automatic Emergency Braking, Blind Spot Detection & Driver Monitoring are Transforming Road Safety
- Doha a strategic location for EV manufacturing hub: IPA Qatar
- Demand for luxury TVs surging in the GCC, says Samsung
- Empowering Growth: The Thriving Journey of Bangladesh’s Cable Industry
Latest Reports
- Nicaragua RPG Gaming Market (2026-2032)
- New Zealand RPG Gaming Market (2026-2032)
- Netherlands RPG Gaming Market (2026-2032)
- Nauru RPG Gaming Market (2026-2032)
- Namibia RPG Gaming Market (2026-2032)
- Mozambique RPG Gaming Market (2026-2032)
- Montenegro RPG Gaming Market (2026-2032)
- Mongolia RPG Gaming Market (2026-2032)
- Monaco RPG Gaming Market (2026-2032)
- Micronesia RPG Gaming Market (2026-2032)
Industry Events and Analyst Meet

EV India Expo 2026

HIMTEX 2026

India Refining Summit 2026

India EV Show 2026

EV tech India Expo 2026
Whitepaper
- Middle East & Africa Commercial Security Market Click here to view more.
- Middle East & Africa Fire Safety Systems & Equipment Market Click here to view more.
- GCC Drone Market Click here to view more.
- Middle East Lighting Fixture Market Click here to view more.
- GCC Physical & Perimeter Security Market Click here to view more.