Belgium Electric Wheelchair Market (2026-2032) | Challenges, Revenue, Competition, Segments, Drivers, Investment Trends, Share, Growth, Consumer Insights, Companies, Value, Analysis, Restraints, Pricing Analysis, Outlook, Opportunities, Competitive, Supply, Demand, Industry, Size, Strategic Insights, Forecast, Strategy, Trends, Segmentation
Market Forecast By Wheelchair Type (Front-Wheel Drive, Rear-Wheel Drive, Mid-Wheel Drive, Foldable Electric Wheelchair), By Features (Compact Design, High Stability, Maneuverability, Lightweight & Portable), By Application (Indoor Use, Outdoor Use, Hospitals & Clinics, Travel & Transport), By End User (Individuals with Disabilities, Elderly Users, Medical Facilities, Caregivers), By Battery Type (Lithium-Ion, Lead-Acid, Gel Battery, Nickel-Metal Hydride) And Competitive Landscape
| Product Code: ETC11852674 | Publication Date: Apr 2025 | Updated Date: Apr 2026 | Product Type: Market Research Report | |
| Publisher: 6Wresearch | No. of Pages: 65 | No. of Figures: 34 | No. of Tables: 19 | |
Belgium Electric Wheelchair Market Size (2020-2030)
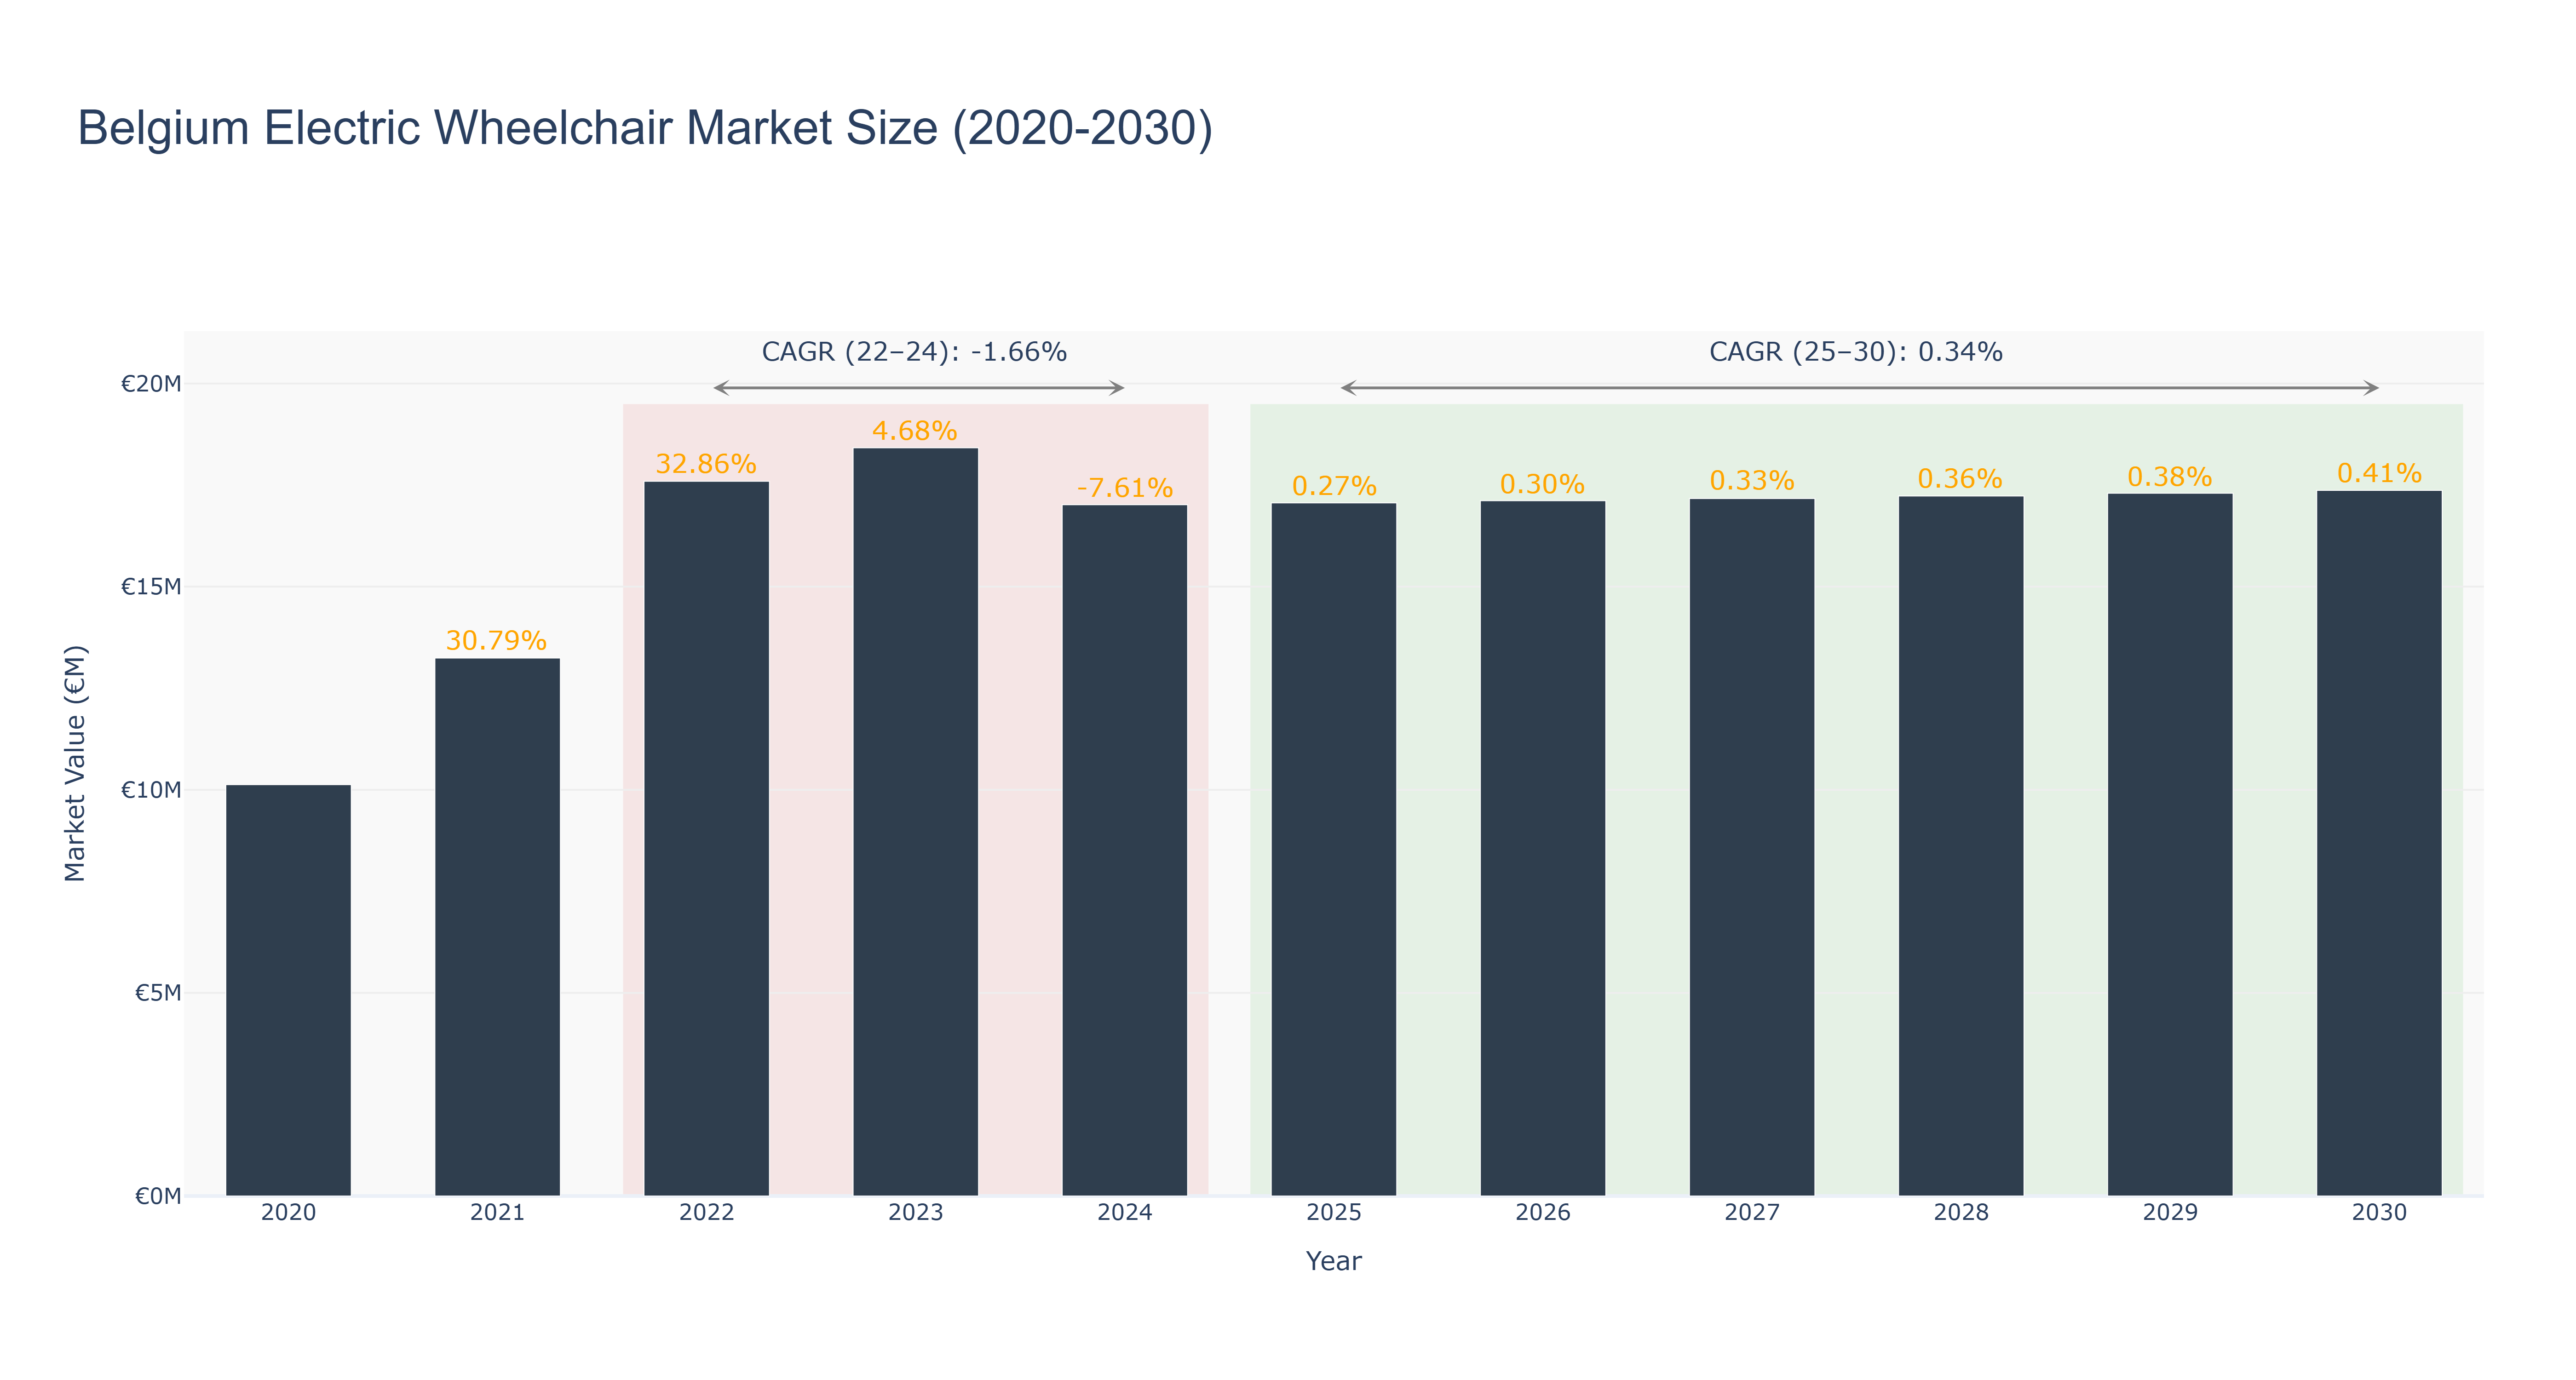
The Belgium Electric Wheelchair Market experienced significant growth from 2021 to 2022, peaking at €17.59 million in 2022, driven by increasing demand for mobility solutions among the aging population and advancements in technology. However, the market saw a decline in 2024, with a size of €17.02 million, reflecting a CAGR of -1.66% from 2022 to 2024. Looking ahead, the forecasted period from 2025 to 2030 indicates a modest recovery, with projected market sizes ranging from €17.06 million to €17.37 million, yielding a CAGR of 0.34%. This growth may be supported by ongoing innovations in electric wheelchair technology, enhanced accessibility policies, and a growing awareness of mobility challenges. As the market stabilizes, stakeholders will need to focus on customer-centric developments to capture potential growth opportunities in this evolving landscape.
Belgium Electric Wheelchair Market: Production & Trade Performance (2019-2025)
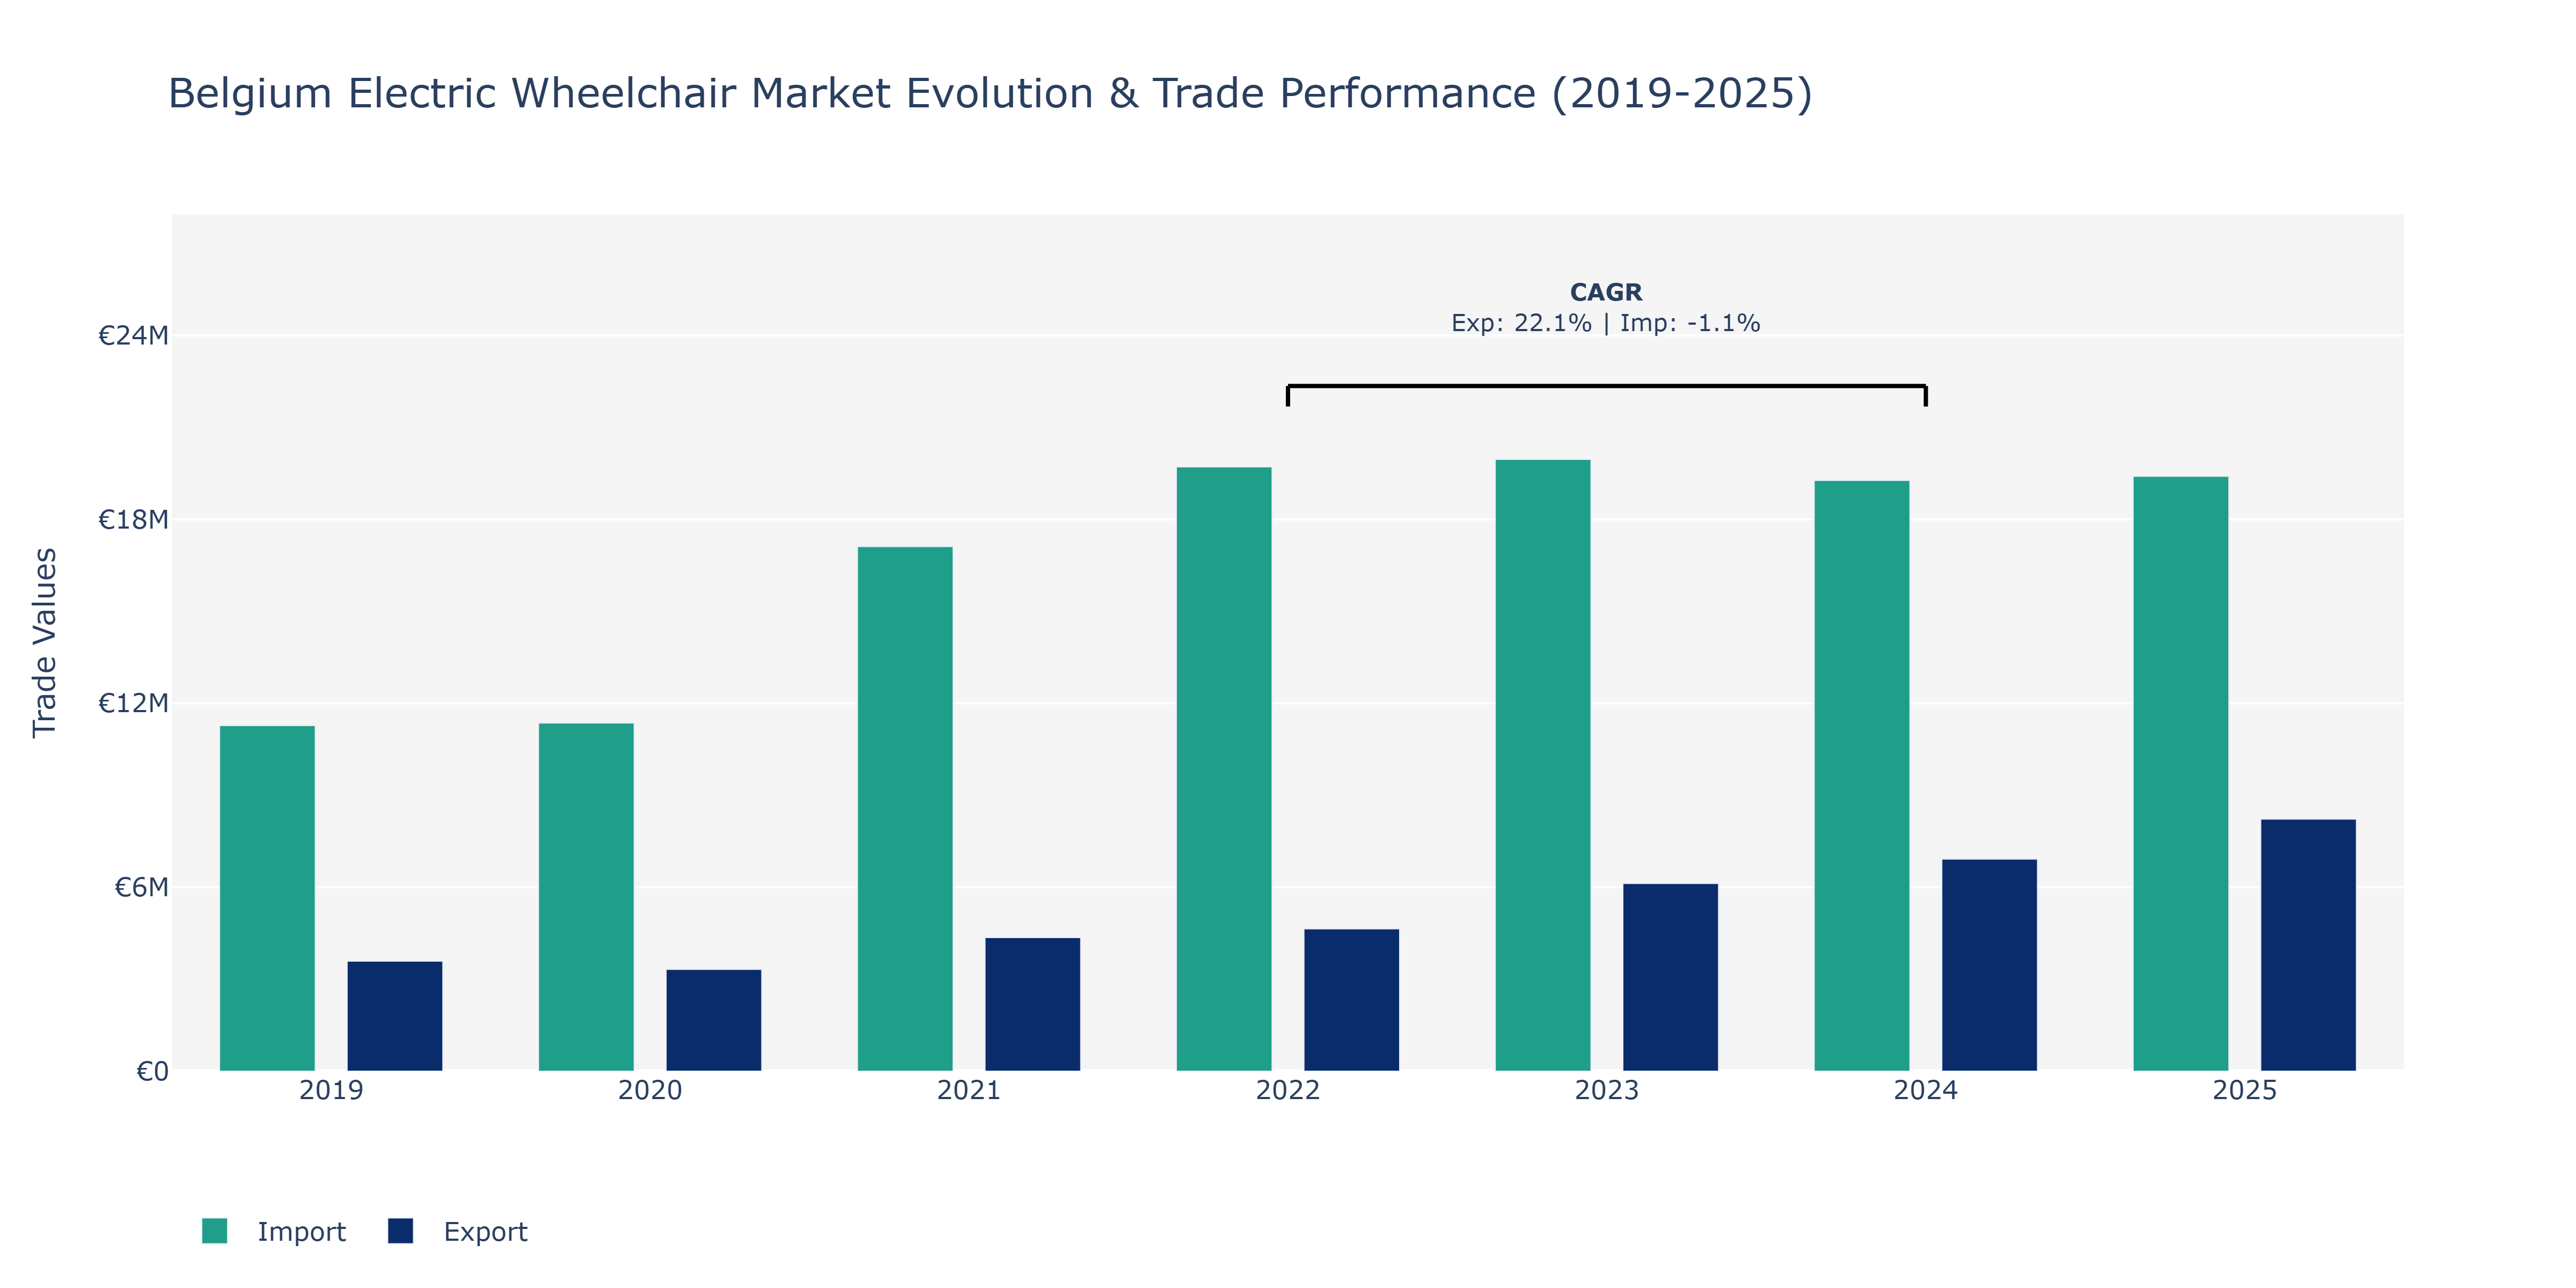
The Belgium Electric Wheelchair Market witnessed fluctuations in both Exports and Imports from 2019 to 2025. Export value started at €3.59 million in 2019, declined to €3.32 million in 2020, and then surged to €8.22 million in 2025, indicating a significant upward trend, possibly driven by technological advancements in electric wheelchair manufacturing and increased demand for assistive mobility devices. On the other hand, Imports began at €11.28 million in 2019, peaked at €19.96 million in 2023, and slightly decreased to €19.41 million in 2025. The rise in Imports until 2023 could be attributed to the global supply chain disruptions and the need for diverse wheelchair models with advanced features. However, the slight decline in 2025 might be due to optimized procurement strategies by local manufacturers or regulatory changes impacting international trade practices in the mobility aid sector.
Key Highlights of the Report:
- Belgium Electric Wheelchair Market Outlook
- Market Size of Belgium Electric Wheelchair Market, 2025
- Forecast of Belgium Electric Wheelchair Market, 2032
- Historical Data and Forecast of Belgium Electric Wheelchair Revenues & Volume for the Period 2022 - 2032F
- Belgium Electric Wheelchair Market Trend Evolution
- Belgium Electric Wheelchair Market Drivers and Challenges
- Belgium Electric Wheelchair Price Trends
- Belgium Electric Wheelchair Porter's Five Forces
- Belgium Electric Wheelchair Industry Life Cycle
- Historical Data and Forecast of Belgium Electric Wheelchair Market Revenues & Volume By Wheelchair Type for the Period 2022 - 2032F
- Historical Data and Forecast of Belgium Electric Wheelchair Market Revenues & Volume By Front-Wheel Drive for the Period 2022 - 2032F
- Historical Data and Forecast of Belgium Electric Wheelchair Market Revenues & Volume By Rear-Wheel Drive for the Period 2022 - 2032F
- Historical Data and Forecast of Belgium Electric Wheelchair Market Revenues & Volume By Mid-Wheel Drive for the Period 2022 - 2032F
- Historical Data and Forecast of Belgium Electric Wheelchair Market Revenues & Volume By Foldable Electric Wheelchair for the Period 2022 - 2032F
- Historical Data and Forecast of Belgium Electric Wheelchair Market Revenues & Volume By Features for the Period 2022 - 2032F
- Historical Data and Forecast of Belgium Electric Wheelchair Market Revenues & Volume By Compact Design for the Period 2022 - 2032F
- Historical Data and Forecast of Belgium Electric Wheelchair Market Revenues & Volume By High Stability for the Period 2022 - 2032F
- Historical Data and Forecast of Belgium Electric Wheelchair Market Revenues & Volume By Maneuverability for the Period 2022 - 2032F
- Historical Data and Forecast of Belgium Electric Wheelchair Market Revenues & Volume By Lightweight & Portable for the Period 2022 - 2032F
- Historical Data and Forecast of Belgium Electric Wheelchair Market Revenues & Volume By Application for the Period 2022 - 2032F
- Historical Data and Forecast of Belgium Electric Wheelchair Market Revenues & Volume By Indoor Use for the Period 2022 - 2032F
- Historical Data and Forecast of Belgium Electric Wheelchair Market Revenues & Volume By Outdoor Use for the Period 2022 - 2032F
- Historical Data and Forecast of Belgium Electric Wheelchair Market Revenues & Volume By Hospitals & Clinics for the Period 2022 - 2032F
- Historical Data and Forecast of Belgium Electric Wheelchair Market Revenues & Volume By Travel & Transport for the Period 2022 - 2032F
- Historical Data and Forecast of Belgium Electric Wheelchair Market Revenues & Volume By End User for the Period 2022 - 2032F
- Historical Data and Forecast of Belgium Electric Wheelchair Market Revenues & Volume By Individuals with Disabilities for the Period 2022 - 2032F
- Historical Data and Forecast of Belgium Electric Wheelchair Market Revenues & Volume By Elderly Users for the Period 2022 - 2032F
- Historical Data and Forecast of Belgium Electric Wheelchair Market Revenues & Volume By Medical Facilities for the Period 2022 - 2032F
- Historical Data and Forecast of Belgium Electric Wheelchair Market Revenues & Volume By Caregivers for the Period 2022 - 2032F
- Historical Data and Forecast of Belgium Electric Wheelchair Market Revenues & Volume By Battery Type for the Period 2022 - 2032F
- Historical Data and Forecast of Belgium Electric Wheelchair Market Revenues & Volume By Lithium-Ion for the Period 2022 - 2032F
- Historical Data and Forecast of Belgium Electric Wheelchair Market Revenues & Volume By Lead-Acid for the Period 2022 - 2032F
- Historical Data and Forecast of Belgium Electric Wheelchair Market Revenues & Volume By Gel Battery for the Period 2022 - 2032F
- Historical Data and Forecast of Belgium Electric Wheelchair Market Revenues & Volume By Nickel-Metal Hydride for the Period 2022 - 2032F
- Belgium Electric Wheelchair Import Export Trade Statistics
- Market Opportunity Assessment By Wheelchair Type
- Market Opportunity Assessment By Features
- Market Opportunity Assessment By Application
- Market Opportunity Assessment By End User
- Market Opportunity Assessment By Battery Type
- Belgium Electric Wheelchair Top Companies Market Share
- Belgium Electric Wheelchair Competitive Benchmarking By Technical and Operational Parameters
- Belgium Electric Wheelchair Company Profiles
- Belgium Electric Wheelchair Key Strategic Recommendations
Frequently Asked Questions About the Market Study (FAQs):
6Wresearch actively monitors the Belgium Electric Wheelchair Market and publishes its comprehensive annual report, highlighting emerging trends, growth drivers, revenue analysis, and forecast outlook. Our insights help businesses to make data-backed strategic decisions with ongoing market dynamics. Our analysts track relevent industries related to the Belgium Electric Wheelchair Market, allowing our clients with actionable intelligence and reliable forecasts tailored to emerging regional needs.
Yes, we provide customisation as per your requirements. To learn more, feel free to contact us on sales@6wresearch.com
1 Executive Summary |
2 Introduction |
2.1 Key Highlights of the Report |
2.2 Report Description |
2.3 Market Scope & Segmentation |
2.4 Research Methodology |
2.5 Assumptions |
3 Belgium Electric Wheelchair Market Overview |
3.1 Belgium Country Macro Economic Indicators |
3.2 Belgium Electric Wheelchair Market Revenues & Volume, 2022 & 2032F |
3.3 Belgium Electric Wheelchair Market - Industry Life Cycle |
3.4 Belgium Electric Wheelchair Market - Porter's Five Forces |
3.5 Belgium Electric Wheelchair Market Revenues & Volume Share, By Wheelchair Type, 2022 & 2032F |
3.6 Belgium Electric Wheelchair Market Revenues & Volume Share, By Features, 2022 & 2032F |
3.7 Belgium Electric Wheelchair Market Revenues & Volume Share, By Application, 2022 & 2032F |
3.8 Belgium Electric Wheelchair Market Revenues & Volume Share, By End User, 2022 & 2032F |
3.9 Belgium Electric Wheelchair Market Revenues & Volume Share, By Battery Type, 2022 & 2032F |
4 Belgium Electric Wheelchair Market Dynamics |
4.1 Impact Analysis |
4.2 Market Drivers |
4.2.1 Increasing awareness and focus on accessibility and mobility solutions for people with disabilities in Belgium |
4.2.2 Technological advancements leading to the development of more advanced and user-friendly electric wheelchairs |
4.2.3 Growing elderly population in Belgium driving the demand for electric wheelchairs |
4.3 Market Restraints |
4.3.1 High cost associated with electric wheelchairs limiting affordability for some potential users |
4.3.2 Lack of reimbursement or insurance coverage for electric wheelchairs in Belgium |
4.3.3 Limited distribution channels and availability of electric wheelchairs in certain regions of Belgium |
5 Belgium Electric Wheelchair Market Trends |
6 Belgium Electric Wheelchair Market, By Types |
6.1 Belgium Electric Wheelchair Market, By Wheelchair Type |
6.1.1 Overview and Analysis |
6.1.2 Belgium Electric Wheelchair Market Revenues & Volume, By Wheelchair Type, 2022 - 2032F |
6.1.3 Belgium Electric Wheelchair Market Revenues & Volume, By Front-Wheel Drive, 2022 - 2032F |
6.1.4 Belgium Electric Wheelchair Market Revenues & Volume, By Rear-Wheel Drive, 2022 - 2032F |
6.1.5 Belgium Electric Wheelchair Market Revenues & Volume, By Mid-Wheel Drive, 2022 - 2032F |
6.1.6 Belgium Electric Wheelchair Market Revenues & Volume, By Foldable Electric Wheelchair, 2022 - 2032F |
6.2 Belgium Electric Wheelchair Market, By Features |
6.2.1 Overview and Analysis |
6.2.2 Belgium Electric Wheelchair Market Revenues & Volume, By Compact Design, 2022 - 2032F |
6.2.3 Belgium Electric Wheelchair Market Revenues & Volume, By High Stability, 2022 - 2032F |
6.2.4 Belgium Electric Wheelchair Market Revenues & Volume, By Maneuverability, 2022 - 2032F |
6.2.5 Belgium Electric Wheelchair Market Revenues & Volume, By Lightweight & Portable, 2022 - 2032F |
6.3 Belgium Electric Wheelchair Market, By Application |
6.3.1 Overview and Analysis |
6.3.2 Belgium Electric Wheelchair Market Revenues & Volume, By Indoor Use, 2022 - 2032F |
6.3.3 Belgium Electric Wheelchair Market Revenues & Volume, By Outdoor Use, 2022 - 2032F |
6.3.4 Belgium Electric Wheelchair Market Revenues & Volume, By Hospitals & Clinics, 2022 - 2032F |
6.3.5 Belgium Electric Wheelchair Market Revenues & Volume, By Travel & Transport, 2022 - 2032F |
6.4 Belgium Electric Wheelchair Market, By End User |
6.4.1 Overview and Analysis |
6.4.2 Belgium Electric Wheelchair Market Revenues & Volume, By Individuals with Disabilities, 2022 - 2032F |
6.4.3 Belgium Electric Wheelchair Market Revenues & Volume, By Elderly Users, 2022 - 2032F |
6.4.4 Belgium Electric Wheelchair Market Revenues & Volume, By Medical Facilities, 2022 - 2032F |
6.4.5 Belgium Electric Wheelchair Market Revenues & Volume, By Caregivers, 2022 - 2032F |
6.5 Belgium Electric Wheelchair Market, By Battery Type |
6.5.1 Overview and Analysis |
6.5.2 Belgium Electric Wheelchair Market Revenues & Volume, By Lithium-Ion, 2022 - 2032F |
6.5.3 Belgium Electric Wheelchair Market Revenues & Volume, By Lead-Acid, 2022 - 2032F |
6.5.4 Belgium Electric Wheelchair Market Revenues & Volume, By Gel Battery, 2022 - 2032F |
6.5.5 Belgium Electric Wheelchair Market Revenues & Volume, By Nickel-Metal Hydride, 2022 - 2032F |
7 Belgium Electric Wheelchair Market Import-Export Trade Statistics |
7.1 Belgium Electric Wheelchair Market Export to Major Countries |
7.2 Belgium Electric Wheelchair Market Imports from Major Countries |
8 Belgium Electric Wheelchair Market Key Performance Indicators |
8.1 Average waiting time for electric wheelchair procurement and delivery |
8.2 Number of government initiatives or policies supporting accessibility and mobility solutions for people with disabilities |
8.3 Percentage of healthcare facilities offering electric wheelchair trials and assessments |
8.4 Average age of electric wheelchair users in Belgium |
8.5 Number of new technological features integrated into electric wheelchairs on the market |
9 Belgium Electric Wheelchair Market - Opportunity Assessment |
9.1 Belgium Electric Wheelchair Market Opportunity Assessment, By Wheelchair Type, 2022 & 2032F |
9.2 Belgium Electric Wheelchair Market Opportunity Assessment, By Features, 2022 & 2032F |
9.3 Belgium Electric Wheelchair Market Opportunity Assessment, By Application, 2022 & 2032F |
9.4 Belgium Electric Wheelchair Market Opportunity Assessment, By End User, 2022 & 2032F |
9.5 Belgium Electric Wheelchair Market Opportunity Assessment, By Battery Type, 2022 & 2032F |
10 Belgium Electric Wheelchair Market - Competitive Landscape |
10.1 Belgium Electric Wheelchair Market Revenue Share, By Companies, 2025 |
10.2 Belgium Electric Wheelchair Market Competitive Benchmarking, By Operating and Technical Parameters |
11 Company Profiles |
12 Recommendations |
13 Disclaimer |
Export potential assessment - trade Analytics for 2030
Export potential enables firms to identify high-growth global markets with greater confidence by combining advanced trade intelligence with a structured quantitative methodology. The framework analyzes emerging demand trends and country-level import patterns while integrating macroeconomic and trade datasets such as GDP and population forecasts, bilateral import–export flows, tariff structures, elasticity differentials between developed and developing economies, geographic distance, and import demand projections. Using weighted trade values from 2020–2024 as the base period to project country-to-country export potential for 2030, these inputs are operationalized through calculated drivers such as gravity model parameters, tariff impact factors, and projected GDP per-capita growth. Through an analysis of hidden potentials, demand hotspots, and market conditions that are most favorable to success, this method enables firms to focus on target countries, maximize returns, and global expansion with data, backed by accuracy.
By factoring in the projected importer demand gap that is currently unmet and could be potential opportunity, it identifies the potential for the Exporter (Country) among 190 countries, against the general trade analysis, which identifies the biggest importer or exporter.
To discover high-growth global markets and optimize your business strategy:
Click Here
Pricing
- Single User License$ 1,995
- Department License$ 2,400
- Site License$ 3,120
- Global License$ 3,795

Search
Thought Leadership and Analyst Meet


Our Clients
Latest Reports
- Syria Air Conditioner Market (2026-2032) | Outlook, Competition, Drivers, Trends, Demand, Competitive, Strategic Insights, Companies, Challenges, Strategy, Consumer Insights, Analysis, Opportunities, Growth, Size, Share, Industry, Revenue, Segments, Value, Segmentation, Supply, Forecast, Restraints,
- Philippines Polyhydroxybutyrate-co-Hydroxyvalerate Market (2026-2032) | Trends, Insights, Challenges, Restraints, Competition, Size, Value, Forecast, Pricing, Share, Outlook, Revenue, Investment Opportunities, Strategy, Drivers, Demand, Growth, segmentation, Analysis, Companies
- Peru Polyhydroxybutyrate-co-Hydroxyvalerate Market (2026-2032) | Growth, Demand, Challenges, Share, Trends, Analysis, Pricing, Investment Opportunities, Drivers, Value, Forecast, Competition, Size, Companies, Insights, Outlook, Restraints, segmentation, Revenue, Strategy
- Pakistan Polyhydroxybutyrate-co-Hydroxyvalerate Market (2026-2032) | Restraints, segmentation, Pricing, Forecast, Share, Strategy, Competition, Trends, Insights, Drivers, Challenges, Growth, Revenue, Outlook, Value, Investment Opportunities, Companies, Size, Analysis, Demand
- Oman Polyhydroxybutyrate-co-Hydroxyvalerate Market (2026-2032) | Drivers, segmentation, Insights, Competition, Pricing, Outlook, Size, Revenue, Challenges, Forecast, Analysis, Growth, Value, Share, Trends, Investment Opportunities, Strategy, Restraints, Companies, Demand
- Nigeria Polyhydroxybutyrate-co-Hydroxyvalerate Market (2026-2032) | Value, Investment Opportunities, Analysis, Revenue, Restraints, Pricing, Outlook, Competition, Demand, Growth, Forecast, Companies, Trends, Challenges, segmentation, Drivers, Insights, Share, Size, Strategy
- Nepal Polyhydroxybutyrate-co-Hydroxyvalerate Market (2026-2032) | Insights, Analysis, Drivers, Share, Revenue, Demand, segmentation, Investment Opportunities, Competition, Forecast, Growth, Pricing, Companies, Strategy, Trends, Restraints, Challenges, Outlook, Size, Value
- Myanmar Polyhydroxybutyrate-co-Hydroxyvalerate Market (2026-2032) | Outlook, Revenue, Strategy, Restraints, Drivers, segmentation, Share, Forecast, Competition, Insights, Growth, Pricing, Size, Demand, Value, Companies, Trends, Challenges, Investment Opportunities, Analysis
- Morocco Polyhydroxybutyrate-co-Hydroxyvalerate Market (2026-2032) | Outlook, Investment Opportunities, Restraints, Strategy, Forecast, Challenges, Drivers, Growth, Companies, segmentation, Trends, Size, Competition, Revenue, Demand, Insights, Share, Analysis, Value, Pricing
- Mexico Polyhydroxybutyrate-co-Hydroxyvalerate Market (2026-2032) | Size, Drivers, Outlook, Share, Strategy, Growth, Pricing, Challenges, Companies, Demand, Value, Investment Opportunities, Restraints, Trends, Forecast, segmentation, Analysis, Insights, Competition, Revenue
Industry Events and Analyst Meet

HIMTEX 2026

India Refining Summit 2026

India EV Show 2026

EV tech India Expo 2026

Auto Tech Asia 2026
Whitepaper
- Middle East & Africa Commercial Security Market Click here to view more.
- Middle East & Africa Fire Safety Systems & Equipment Market Click here to view more.
- GCC Drone Market Click here to view more.
- Middle East Lighting Fixture Market Click here to view more.
- GCC Physical & Perimeter Security Market Click here to view more.
6WResearch In News
- Doha a strategic location for EV manufacturing hub: IPA Qatar
- Demand for luxury TVs surging in the GCC, says Samsung
- Empowering Growth: The Thriving Journey of Bangladesh’s Cable Industry
- Demand for luxury TVs surging in the GCC, says Samsung
- Video call with a traditional healer? Once unthinkable, it’s now common in South Africa
- Intelligent Buildings To Smooth GCC’s Path To Net Zero