Belgium Flip Chip Market (2026-2032) | Strategy, Analysis, Pricing Analysis, Consumer Insights, Competition, Supply, Drivers, Value, Segmentation, Forecast, Challenges, Outlook, Demand, Companies, Trends, Industry, Size, Restraints, Revenue, Competitive, Growth, Investment Trends, Opportunities, Share, Segments, Strategic Insights
Market Forecast By Packaging Type (FCOL (Flip-Chip on Leadframe), FCOB (Flip-Chip on Board), Flip-Chip BGA (Ball Grid Array), Flip-Chip CSP (Chip Scale Package)), By Application (Consumer Electronics, Automotive Electronics, High-End Computers, Medical Devices), By End User (Smartphones, Electric Vehicles, Servers, Wearables), By Material (Copper, Gold, Tin, Silver), By Manufacturing Process (Wafer Bumping, Soldering, Eutectic Bonding, Flip-Chip Bonding) And Competitive Landscape
| Product Code: ETC12171394 | Publication Date: Apr 2025 | Updated Date: Apr 2026 | Product Type: Market Research Report | |
| Publisher: 6Wresearch | No. of Pages: 65 | No. of Figures: 34 | No. of Tables: 19 | |
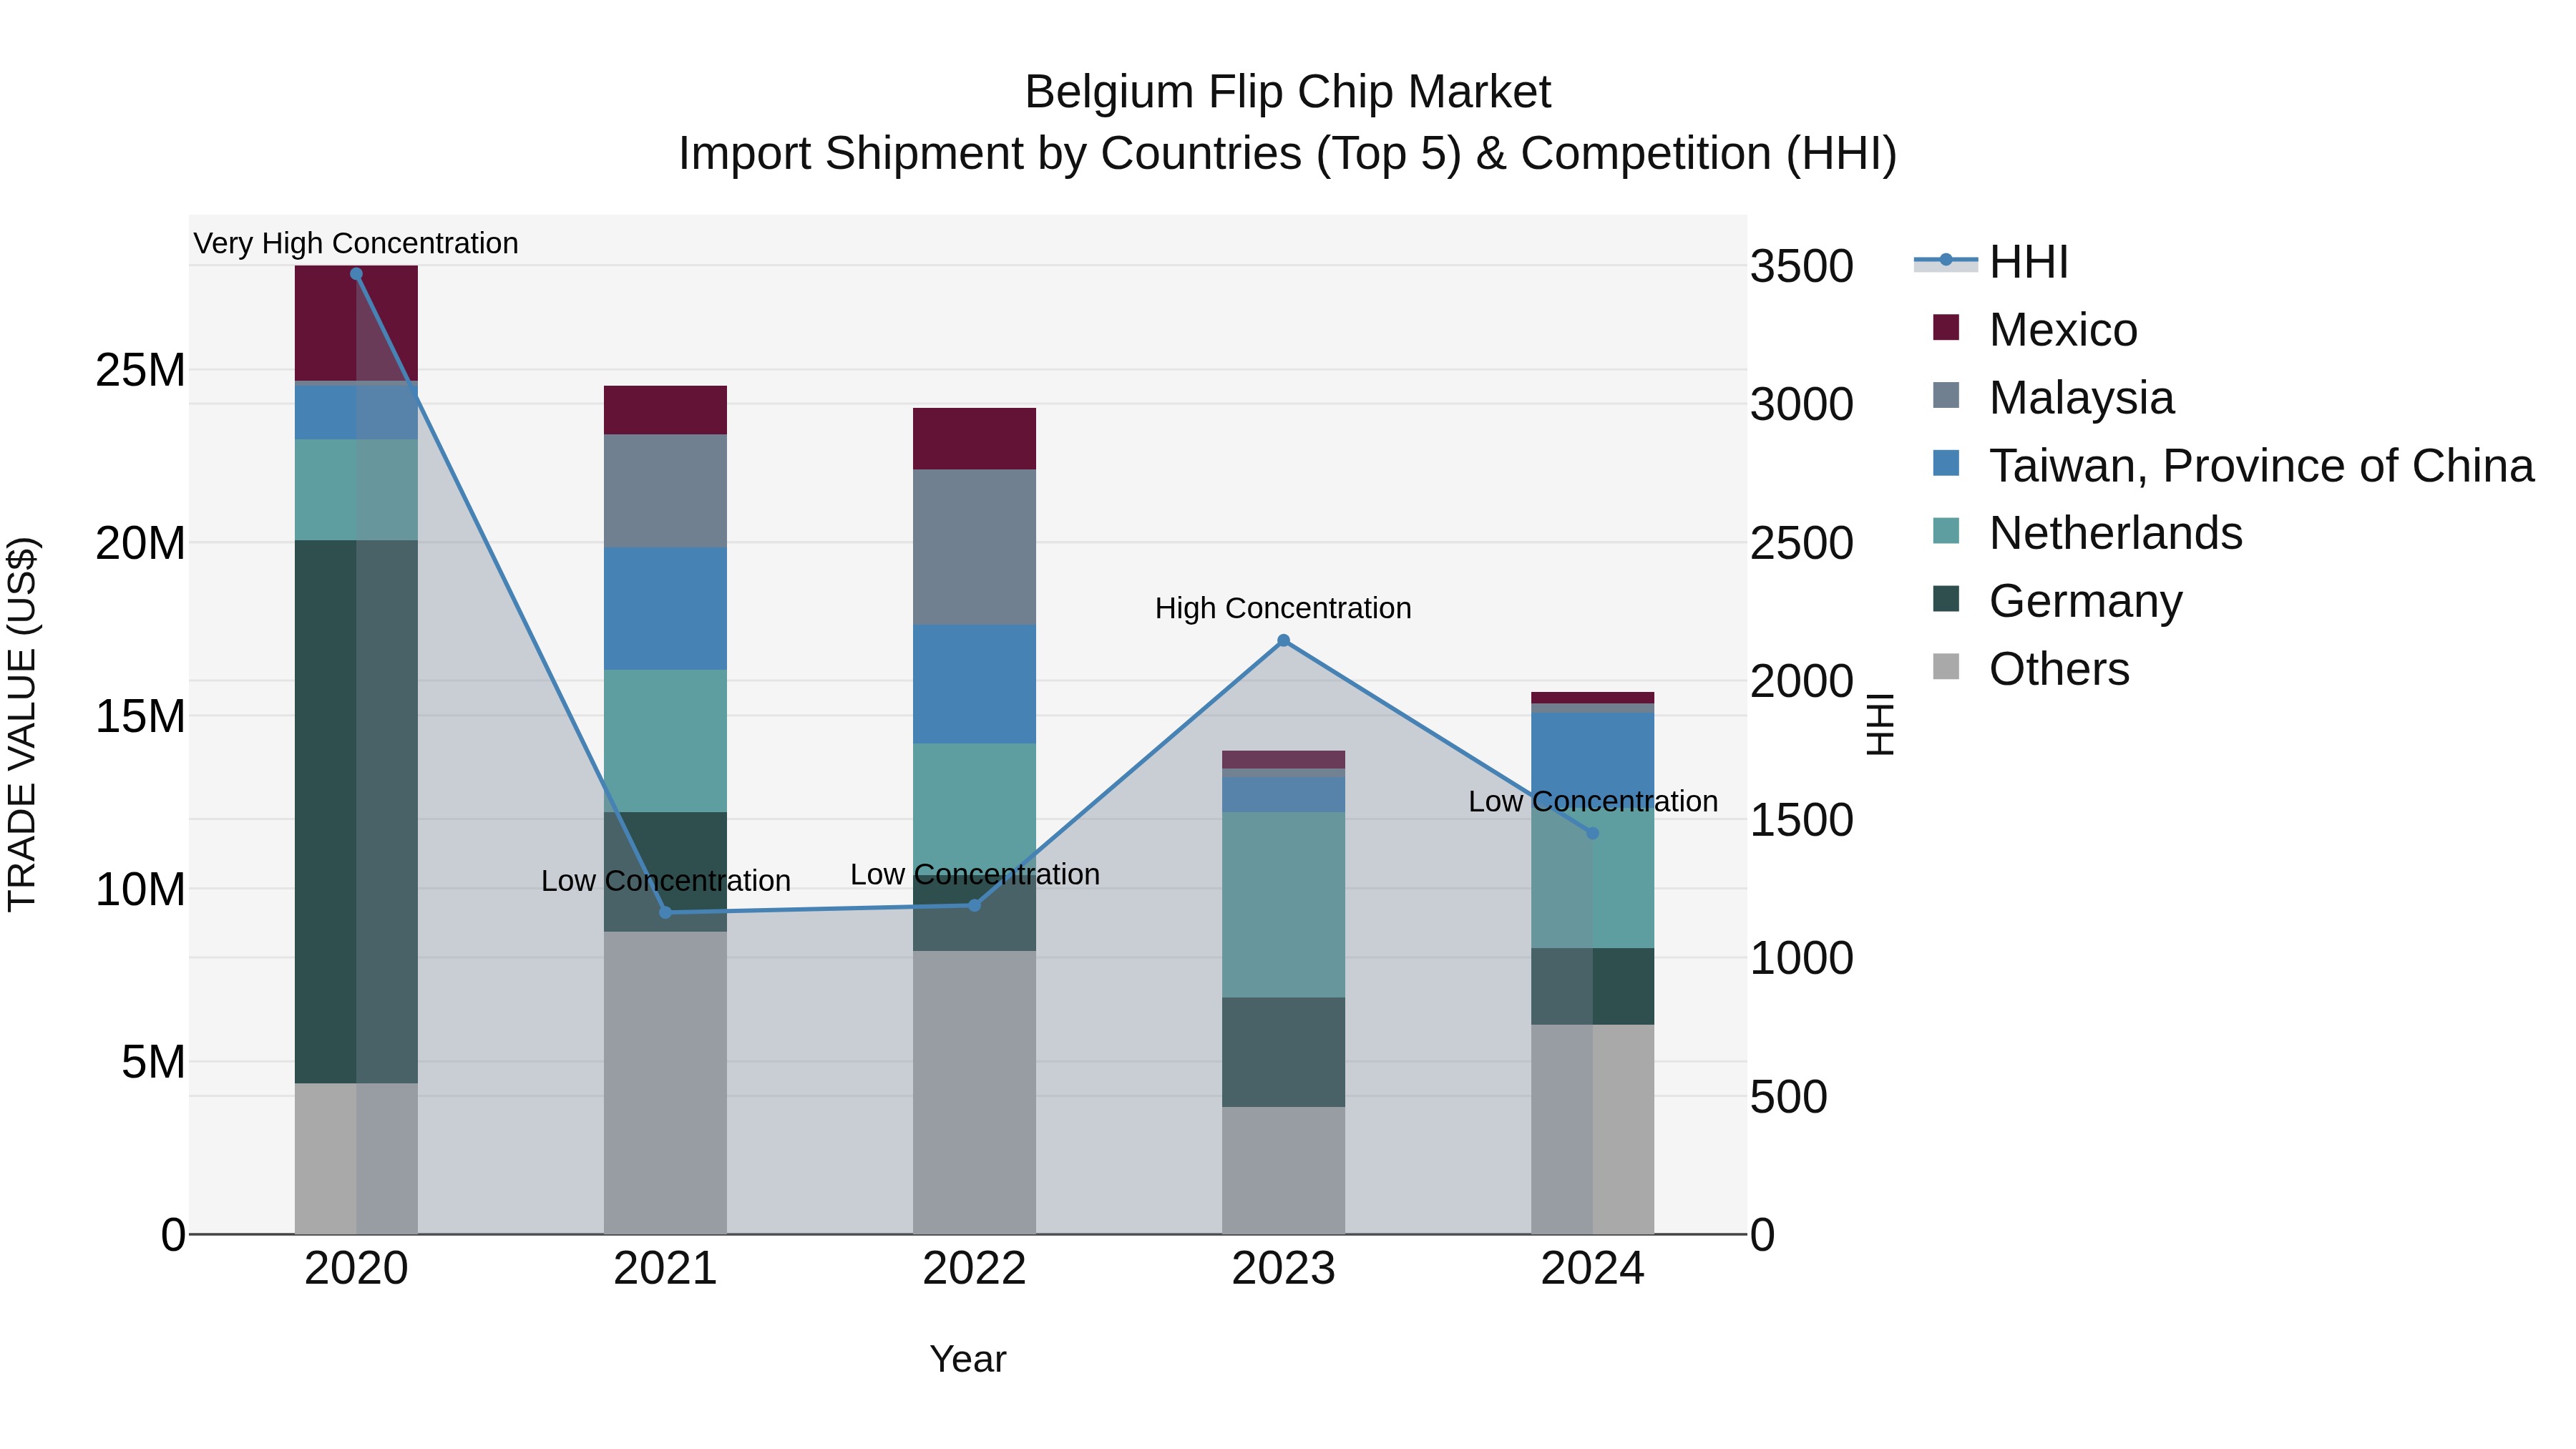
Belgium Flip Chip Market Top 5 Importing Countries and Market Competition (HHI) Analysis
Belgium`s flip chip import market saw a notable shift in concentration from high to low in 2024, with key exporters being the Netherlands, Taiwan, Germany, Italy, and Thailand. Despite a negative CAGR from 2020 to 2024, the market displayed resilience with a growth rate of 12.25% in 2024. This suggests evolving dynamics and opportunities in the sector, potentially driven by technological advancements and changing consumer preferences. Belgium`s import landscape for flip chips remains dynamic and responsive to global market trends.
Key Highlights of the Report:
- Belgium Flip Chip Market Outlook
- Market Size of Belgium Flip Chip Market, 2025
- Forecast of Belgium Flip Chip Market, 2032
- Historical Data and Forecast of Belgium Flip Chip Revenues & Volume for the Period 2022 - 2032F
- Belgium Flip Chip Market Trend Evolution
- Belgium Flip Chip Market Drivers and Challenges
- Belgium Flip Chip Price Trends
- Belgium Flip Chip Porter's Five Forces
- Belgium Flip Chip Industry Life Cycle
- Historical Data and Forecast of Belgium Flip Chip Market Revenues & Volume By Packaging Type for the Period 2022 - 2032F
- Historical Data and Forecast of Belgium Flip Chip Market Revenues & Volume By FCOL (Flip-Chip on Leadframe) for the Period 2022 - 2032F
- Historical Data and Forecast of Belgium Flip Chip Market Revenues & Volume By FCOB (Flip-Chip on Board) for the Period 2022 - 2032F
- Historical Data and Forecast of Belgium Flip Chip Market Revenues & Volume By Flip-Chip BGA (Ball Grid Array) for the Period 2022 - 2032F
- Historical Data and Forecast of Belgium Flip Chip Market Revenues & Volume By Flip-Chip CSP (Chip Scale Package) for the Period 2022 - 2032F
- Historical Data and Forecast of Belgium Flip Chip Market Revenues & Volume By Application for the Period 2022 - 2032F
- Historical Data and Forecast of Belgium Flip Chip Market Revenues & Volume By Consumer Electronics for the Period 2022 - 2032F
- Historical Data and Forecast of Belgium Flip Chip Market Revenues & Volume By Automotive Electronics for the Period 2022 - 2032F
- Historical Data and Forecast of Belgium Flip Chip Market Revenues & Volume By High-End Computers for the Period 2022 - 2032F
- Historical Data and Forecast of Belgium Flip Chip Market Revenues & Volume By Medical Devices for the Period 2022 - 2032F
- Historical Data and Forecast of Belgium Flip Chip Market Revenues & Volume By End User for the Period 2022 - 2032F
- Historical Data and Forecast of Belgium Flip Chip Market Revenues & Volume By Smartphones for the Period 2022 - 2032F
- Historical Data and Forecast of Belgium Flip Chip Market Revenues & Volume By Electric Vehicles for the Period 2022 - 2032F
- Historical Data and Forecast of Belgium Flip Chip Market Revenues & Volume By Servers for the Period 2022 - 2032F
- Historical Data and Forecast of Belgium Flip Chip Market Revenues & Volume By Wearables for the Period 2022 - 2032F
- Historical Data and Forecast of Belgium Flip Chip Market Revenues & Volume By Material for the Period 2022 - 2032F
- Historical Data and Forecast of Belgium Flip Chip Market Revenues & Volume By Copper for the Period 2022 - 2032F
- Historical Data and Forecast of Belgium Flip Chip Market Revenues & Volume By Gold for the Period 2022 - 2032F
- Historical Data and Forecast of Belgium Flip Chip Market Revenues & Volume By Tin for the Period 2022 - 2032F
- Historical Data and Forecast of Belgium Flip Chip Market Revenues & Volume By Silver for the Period 2022 - 2032F
- Historical Data and Forecast of Belgium Flip Chip Market Revenues & Volume By Manufacturing Process for the Period 2022 - 2032F
- Historical Data and Forecast of Belgium Flip Chip Market Revenues & Volume By Wafer Bumping for the Period 2022 - 2032F
- Historical Data and Forecast of Belgium Flip Chip Market Revenues & Volume By Soldering for the Period 2022 - 2032F
- Historical Data and Forecast of Belgium Flip Chip Market Revenues & Volume By Eutectic Bonding for the Period 2022 - 2032F
- Historical Data and Forecast of Belgium Flip Chip Market Revenues & Volume By Flip-Chip Bonding for the Period 2022 - 2032F
- Belgium Flip Chip Import Export Trade Statistics
- Market Opportunity Assessment By Packaging Type
- Market Opportunity Assessment By Application
- Market Opportunity Assessment By End User
- Market Opportunity Assessment By Material
- Market Opportunity Assessment By Manufacturing Process
- Belgium Flip Chip Top Companies Market Share
- Belgium Flip Chip Competitive Benchmarking By Technical and Operational Parameters
- Belgium Flip Chip Company Profiles
- Belgium Flip Chip Key Strategic Recommendations
Frequently Asked Questions About the Market Study (FAQs):
6Wresearch actively monitors the Belgium Flip Chip Market and publishes its comprehensive annual report, highlighting emerging trends, growth drivers, revenue analysis, and forecast outlook. Our insights help businesses to make data-backed strategic decisions with ongoing market dynamics. Our analysts track relevent industries related to the Belgium Flip Chip Market, allowing our clients with actionable intelligence and reliable forecasts tailored to emerging regional needs.
Yes, we provide customisation as per your requirements. To learn more, feel free to contact us on sales@6wresearch.com
1 Executive Summary |
2 Introduction |
2.1 Key Highlights of the Report |
2.2 Report Description |
2.3 Market Scope & Segmentation |
2.4 Research Methodology |
2.5 Assumptions |
3 Belgium Flip Chip Market Overview |
3.1 Belgium Country Macro Economic Indicators |
3.2 Belgium Flip Chip Market Revenues & Volume, 2022 & 2032F |
3.3 Belgium Flip Chip Market - Industry Life Cycle |
3.4 Belgium Flip Chip Market - Porter's Five Forces |
3.5 Belgium Flip Chip Market Revenues & Volume Share, By Packaging Type, 2022 & 2032F |
3.6 Belgium Flip Chip Market Revenues & Volume Share, By Application, 2022 & 2032F |
3.7 Belgium Flip Chip Market Revenues & Volume Share, By End User, 2022 & 2032F |
3.8 Belgium Flip Chip Market Revenues & Volume Share, By Material, 2022 & 2032F |
3.9 Belgium Flip Chip Market Revenues & Volume Share, By Manufacturing Process, 2022 & 2032F |
4 Belgium Flip Chip Market Dynamics |
4.1 Impact Analysis |
4.2 Market Drivers |
4.2.1 Increasing demand for compact electronic devices leading to the adoption of flip chip technology |
4.2.2 Growth in the automotive sector driving the demand for flip chip technology in Belgium |
4.2.3 Technological advancements in flip chip packaging techniques enhancing performance and reliability |
4.3 Market Restraints |
4.3.1 High initial investment required for setting up flip chip manufacturing facilities |
4.3.2 Complexity in the flip chip packaging process leading to higher production costs |
4.3.3 Limited availability of skilled technicians proficient in flip chip technology |
5 Belgium Flip Chip Market Trends |
6 Belgium Flip Chip Market, By Types |
6.1 Belgium Flip Chip Market, By Packaging Type |
6.1.1 Overview and Analysis |
6.1.2 Belgium Flip Chip Market Revenues & Volume, By Packaging Type, 2022 - 2032F |
6.1.3 Belgium Flip Chip Market Revenues & Volume, By FCOL (Flip-Chip on Leadframe), 2022 - 2032F |
6.1.4 Belgium Flip Chip Market Revenues & Volume, By FCOB (Flip-Chip on Board), 2022 - 2032F |
6.1.5 Belgium Flip Chip Market Revenues & Volume, By Flip-Chip BGA (Ball Grid Array), 2022 - 2032F |
6.1.6 Belgium Flip Chip Market Revenues & Volume, By Flip-Chip CSP (Chip Scale Package), 2022 - 2032F |
6.2 Belgium Flip Chip Market, By Application |
6.2.1 Overview and Analysis |
6.2.2 Belgium Flip Chip Market Revenues & Volume, By Consumer Electronics, 2022 - 2032F |
6.2.3 Belgium Flip Chip Market Revenues & Volume, By Automotive Electronics, 2022 - 2032F |
6.2.4 Belgium Flip Chip Market Revenues & Volume, By High-End Computers, 2022 - 2032F |
6.2.5 Belgium Flip Chip Market Revenues & Volume, By Medical Devices, 2022 - 2032F |
6.3 Belgium Flip Chip Market, By End User |
6.3.1 Overview and Analysis |
6.3.2 Belgium Flip Chip Market Revenues & Volume, By Smartphones, 2022 - 2032F |
6.3.3 Belgium Flip Chip Market Revenues & Volume, By Electric Vehicles, 2022 - 2032F |
6.3.4 Belgium Flip Chip Market Revenues & Volume, By Servers, 2022 - 2032F |
6.3.5 Belgium Flip Chip Market Revenues & Volume, By Wearables, 2022 - 2032F |
6.4 Belgium Flip Chip Market, By Material |
6.4.1 Overview and Analysis |
6.4.2 Belgium Flip Chip Market Revenues & Volume, By Copper, 2022 - 2032F |
6.4.3 Belgium Flip Chip Market Revenues & Volume, By Gold, 2022 - 2032F |
6.4.4 Belgium Flip Chip Market Revenues & Volume, By Tin, 2022 - 2032F |
6.4.5 Belgium Flip Chip Market Revenues & Volume, By Silver, 2022 - 2032F |
6.5 Belgium Flip Chip Market, By Manufacturing Process |
6.5.1 Overview and Analysis |
6.5.2 Belgium Flip Chip Market Revenues & Volume, By Wafer Bumping, 2022 - 2032F |
6.5.3 Belgium Flip Chip Market Revenues & Volume, By Soldering, 2022 - 2032F |
6.5.4 Belgium Flip Chip Market Revenues & Volume, By Eutectic Bonding, 2022 - 2032F |
6.5.5 Belgium Flip Chip Market Revenues & Volume, By Flip-Chip Bonding, 2022 - 2032F |
7 Belgium Flip Chip Market Import-Export Trade Statistics |
7.1 Belgium Flip Chip Market Export to Major Countries |
7.2 Belgium Flip Chip Market Imports from Major Countries |
8 Belgium Flip Chip Market Key Performance Indicators |
8.1 Average yield rate of flip chip production processes |
8.2 Average cycle time for flip chip packaging |
8.3 Number of research and development collaborations for flip chip technology advancements |
9 Belgium Flip Chip Market - Opportunity Assessment |
9.1 Belgium Flip Chip Market Opportunity Assessment, By Packaging Type, 2022 & 2032F |
9.2 Belgium Flip Chip Market Opportunity Assessment, By Application, 2022 & 2032F |
9.3 Belgium Flip Chip Market Opportunity Assessment, By End User, 2022 & 2032F |
9.4 Belgium Flip Chip Market Opportunity Assessment, By Material, 2022 & 2032F |
9.5 Belgium Flip Chip Market Opportunity Assessment, By Manufacturing Process, 2022 & 2032F |
10 Belgium Flip Chip Market - Competitive Landscape |
10.1 Belgium Flip Chip Market Revenue Share, By Companies, 2025 |
10.2 Belgium Flip Chip Market Competitive Benchmarking, By Operating and Technical Parameters |
11 Company Profiles |
12 Recommendations |
13 Disclaimer |
Global Go To Market Strategy - 2030
Export potential enables firms to identify high-growth global markets with greater confidence by combining advanced trade intelligence with a structured quantitative methodology. The framework analyzes emerging demand trends and country-level import patterns while integrating macroeconomic and trade datasets such as GDP and population forecasts, bilateral import–export flows, tariff structures, elasticity differentials between developed and developing economies, geographic distance, and import demand projections. Using weighted trade values from 2020–2024 as the base period to project country-to-country export potential for 2030, these inputs are operationalized through calculated drivers such as gravity model parameters, tariff impact factors, and projected GDP per-capita growth. Through an analysis of hidden potentials, demand hotspots, and market conditions that are most favorable to success, this method enables firms to focus on target countries, maximize returns, and global expansion with data, backed by accuracy.
By factoring in the projected importer demand gap that is currently unmet and could be potential opportunity, it identifies the potential for the Exporter (Country) among 190 countries, against the general trade analysis, which identifies the biggest importer or exporter.
To discover high-growth global markets and optimize your business strategy:
Click Here
Pricing
- Single User License$ 1,995
- Department License$ 2,400
- Site License$ 3,120
- Global License$ 3,795

Leadership Perspectives from Industry Events
Search
Thought Leadership and Analyst Meet


Our Clients
6WResearch In News
- Doha a strategic location for EV manufacturing hub: IPA Qatar
- Demand for luxury TVs surging in the GCC, says Samsung
- Empowering Growth: The Thriving Journey of Bangladesh’s Cable Industry
- Demand for luxury TVs surging in the GCC, says Samsung
- Video call with a traditional healer? Once unthinkable, it’s now common in South Africa
- Intelligent Buildings To Smooth GCC’s Path To Net Zero
Latest Reports
- Cape Verde Portable Hand-Thrown Extinguisher Market (2026-2032)
- Canada Portable Hand-Thrown Extinguisher Market (2026-2032)
- Cameroon Portable Hand-Thrown Extinguisher Market (2026-2032)
- Burundi Portable Hand-Thrown Extinguisher Market (2026-2032)
- Burkina Faso Portable Hand-Thrown Extinguisher Market (2026-2032)
- Bulgaria Portable Hand-Thrown Extinguisher Market (2026-2032)
- Brunei Portable Hand-Thrown Extinguisher Market (2026-2032)
- Botswana Portable Hand-Thrown Extinguisher Market (2026-2032)
- Bosnia and Herzegovina Portable Hand-Thrown Extinguisher Market (2026-2032)
- Bolivia Portable Hand-Thrown Extinguisher Market (2026-2032)
Industry Events and Analyst Meet

HIMTEX 2026

India Refining Summit 2026

India EV Show 2026

EV tech India Expo 2026

Auto Tech Asia 2026
Whitepaper
- Middle East & Africa Commercial Security Market Click here to view more.
- Middle East & Africa Fire Safety Systems & Equipment Market Click here to view more.
- GCC Drone Market Click here to view more.
- Middle East Lighting Fixture Market Click here to view more.
- GCC Physical & Perimeter Security Market Click here to view more.