Belgium Jam Jelly and Preserve Market (2026-2032) | Outlook, Revenue, Competition, Size, Segments, Segmentation, Companies, Drivers, Consumer Insights, Supply, Challenges, Strategic Insights, Growth, Value, Pricing Analysis, Opportunities, Trends, Restraints, Competitive, Share, Industry, Investment Trends, Analysis, Forecast, Demand, Strategy
Market Forecast By Product Type (Jam, Jelly, Preserves), By Ingredient Type (Fruit-Based, Sugar-Free, Organic), By Distribution Channel (Supermarkets, Online Stores, Specialty Stores), By Packaging Type (Glass Jar, Plastic Container, Squeeze Bottle) And Competitive Landscape
| Product Code: ETC12878338 | Publication Date: Apr 2025 | Updated Date: Apr 2026 | Product Type: Market Research Report | |
| Publisher: 6Wresearch | Author: Sachin Kumar Rai | No. of Pages: 65 | No. of Figures: 34 | No. of Tables: 19 |
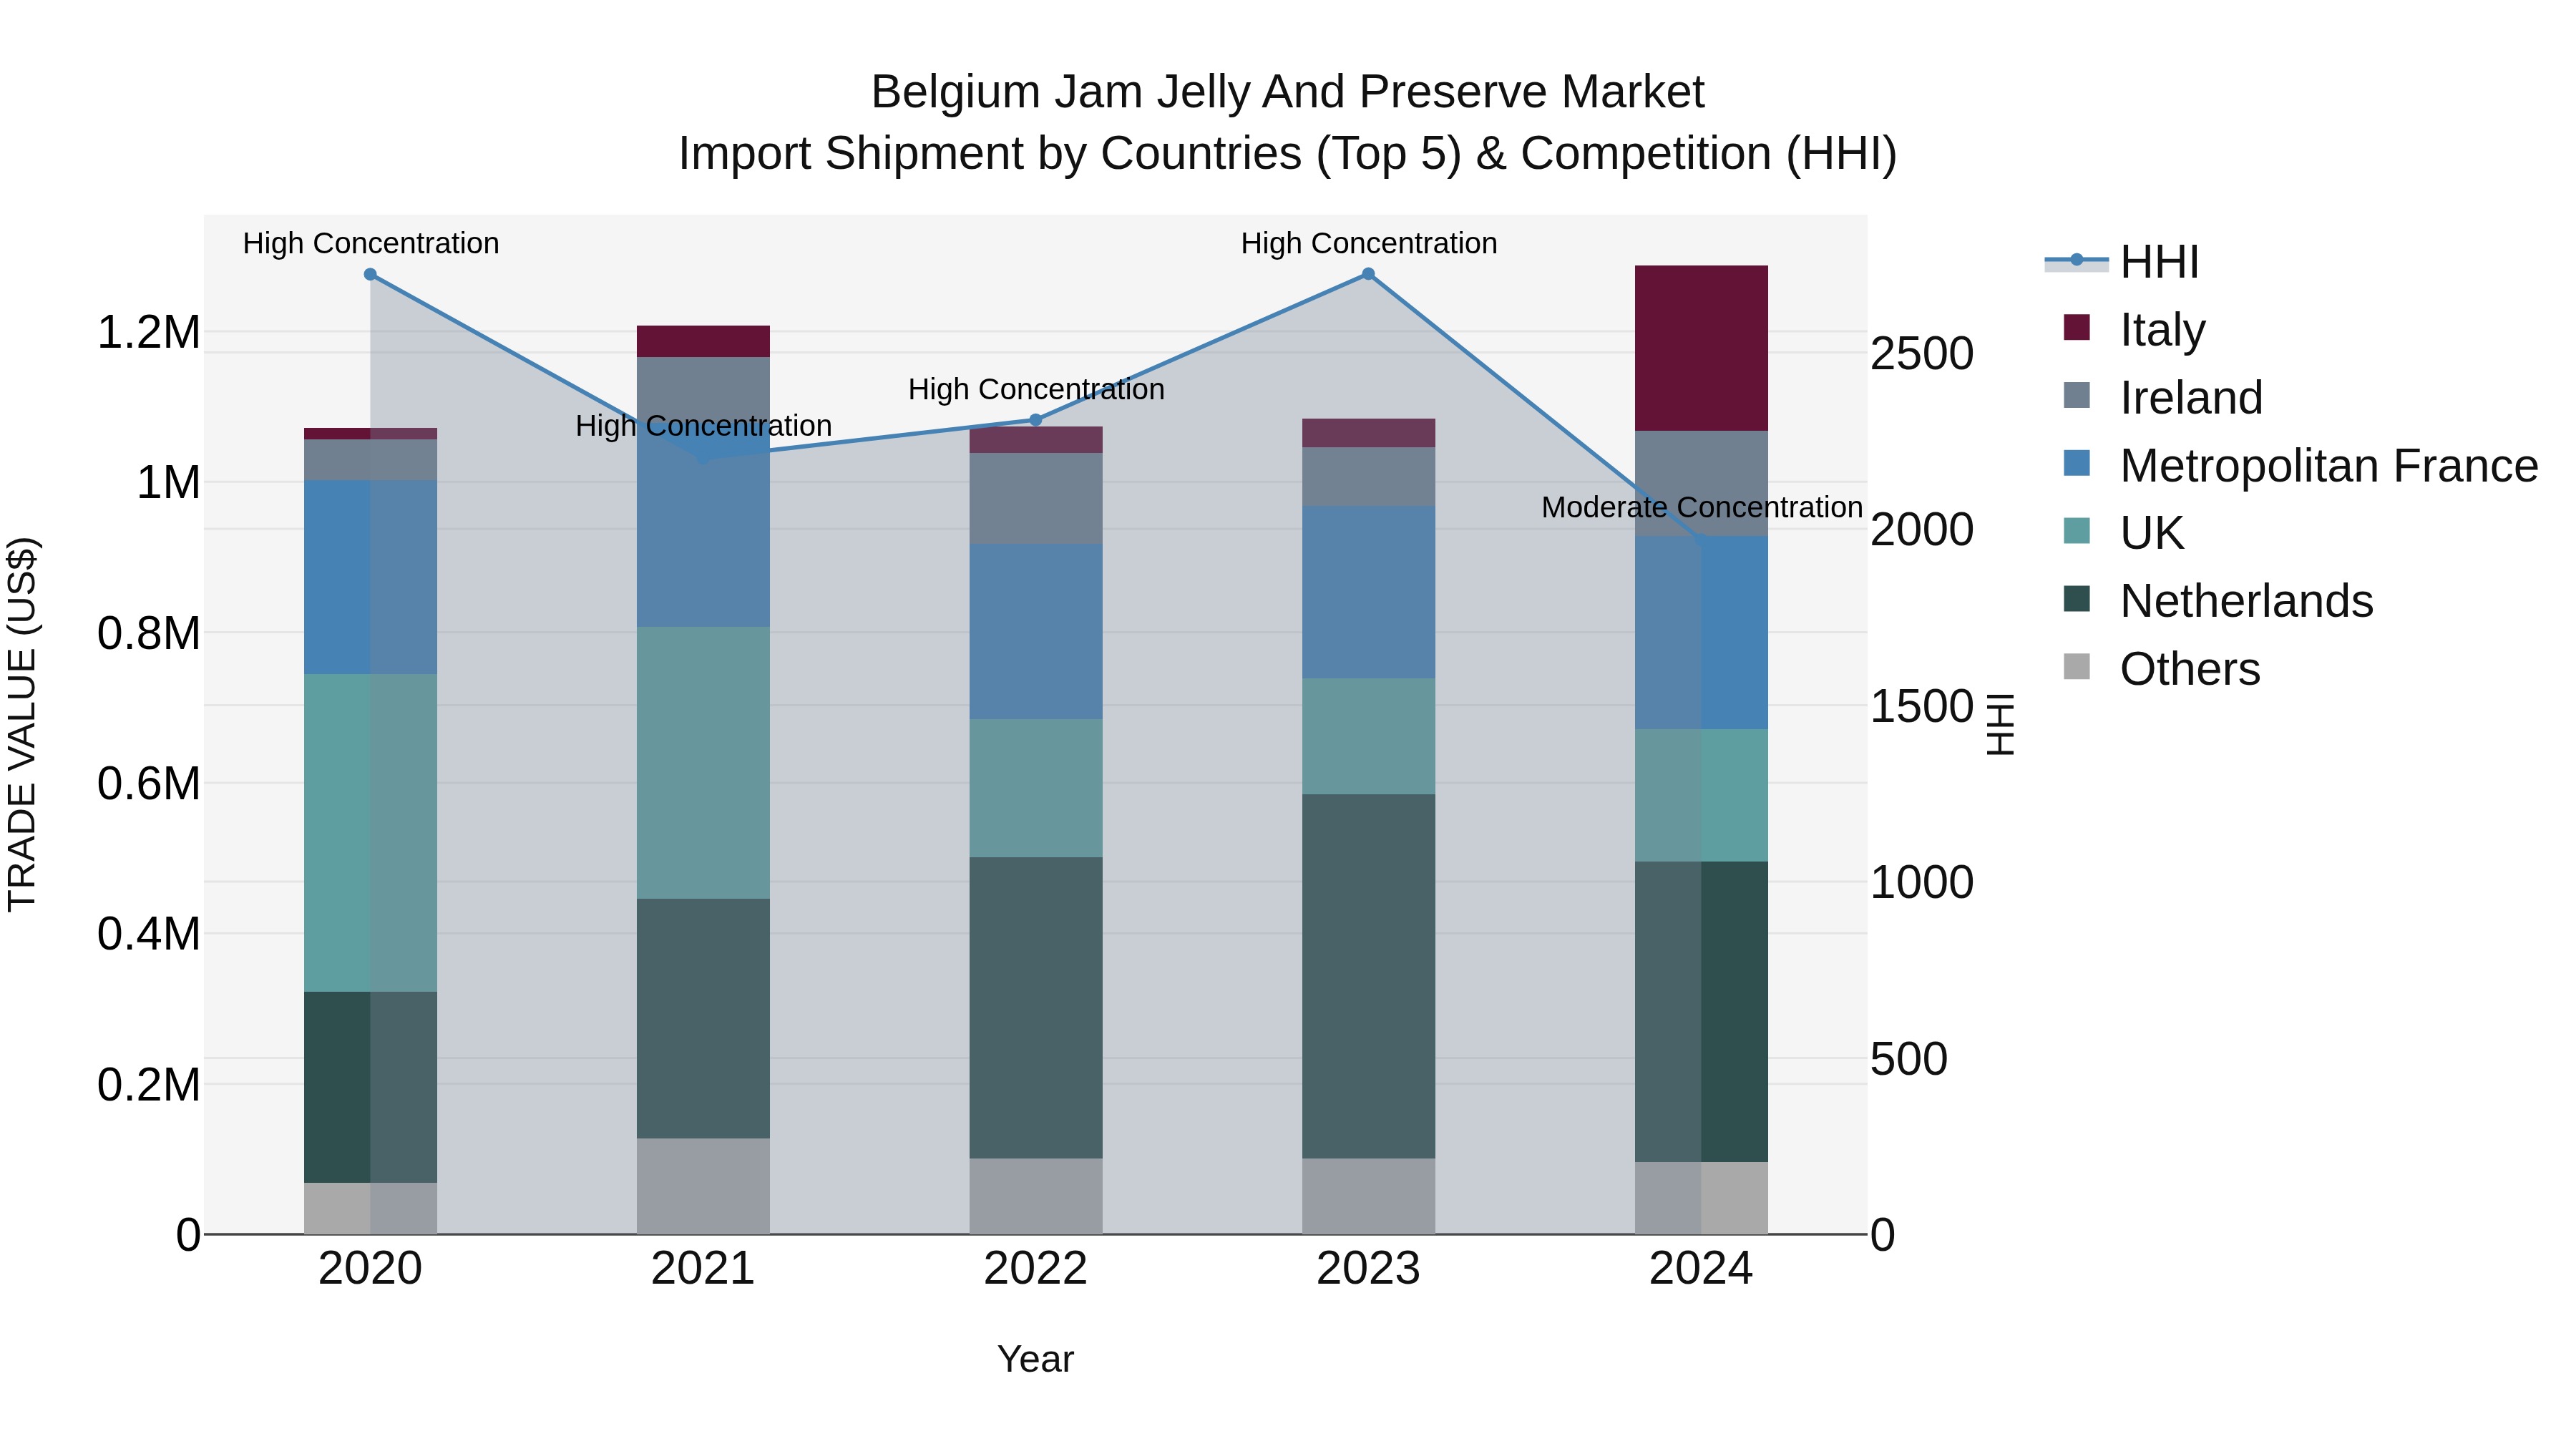
Belgium Jam Jelly and Preserve Market Top 5 Importing Countries and Market Competition (HHI) Analysis
The import shipments of jam, jelly, and preserves into Belgium saw significant growth in 2024, with the top exporting countries being the Netherlands, Metropolitan France, Italy, UK, and Ireland. The market displayed a shift from high concentration in 2023 to moderate concentration in 2024, indicating a more diverse import landscape. The compound annual growth rate (CAGR) from 2020 to 2024 stood at a healthy 4.69%, and the growth rate from 2023 to 2024 spiked at 18.76%, reflecting a strong upward trend in demand for these products in the Belgian market.
Key Highlights of the Report:
- Belgium Jam Jelly and Preserve Market Outlook
- Market Size of Belgium Jam Jelly and Preserve Market, 2025
- Forecast of Belgium Jam Jelly and Preserve Market, 2032
- Historical Data and Forecast of Belgium Jam Jelly and Preserve Revenues & Volume for the Period 2022 - 2032F
- Belgium Jam Jelly and Preserve Market Trend Evolution
- Belgium Jam Jelly and Preserve Market Drivers and Challenges
- Belgium Jam Jelly and Preserve Price Trends
- Belgium Jam Jelly and Preserve Porter's Five Forces
- Belgium Jam Jelly and Preserve Industry Life Cycle
- Historical Data and Forecast of Belgium Jam Jelly and Preserve Market Revenues & Volume By Product Type for the Period 2022 - 2032F
- Historical Data and Forecast of Belgium Jam Jelly and Preserve Market Revenues & Volume By Jam for the Period 2022 - 2032F
- Historical Data and Forecast of Belgium Jam Jelly and Preserve Market Revenues & Volume By Jelly for the Period 2022 - 2032F
- Historical Data and Forecast of Belgium Jam Jelly and Preserve Market Revenues & Volume By Preserves for the Period 2022 - 2032F
- Historical Data and Forecast of Belgium Jam Jelly and Preserve Market Revenues & Volume By Ingredient Type for the Period 2022 - 2032F
- Historical Data and Forecast of Belgium Jam Jelly and Preserve Market Revenues & Volume By Fruit-Based for the Period 2022 - 2032F
- Historical Data and Forecast of Belgium Jam Jelly and Preserve Market Revenues & Volume By Sugar-Free for the Period 2022 - 2032F
- Historical Data and Forecast of Belgium Jam Jelly and Preserve Market Revenues & Volume By Organic for the Period 2022 - 2032F
- Historical Data and Forecast of Belgium Jam Jelly and Preserve Market Revenues & Volume By Distribution Channel for the Period 2022 - 2032F
- Historical Data and Forecast of Belgium Jam Jelly and Preserve Market Revenues & Volume By Supermarkets for the Period 2022 - 2032F
- Historical Data and Forecast of Belgium Jam Jelly and Preserve Market Revenues & Volume By Online Stores for the Period 2022 - 2032F
- Historical Data and Forecast of Belgium Jam Jelly and Preserve Market Revenues & Volume By Specialty Stores for the Period 2022 - 2032F
- Historical Data and Forecast of Belgium Jam Jelly and Preserve Market Revenues & Volume By Packaging Type for the Period 2022 - 2032F
- Historical Data and Forecast of Belgium Jam Jelly and Preserve Market Revenues & Volume By Glass Jar for the Period 2022 - 2032F
- Historical Data and Forecast of Belgium Jam Jelly and Preserve Market Revenues & Volume By Plastic Container for the Period 2022 - 2032F
- Historical Data and Forecast of Belgium Jam Jelly and Preserve Market Revenues & Volume By Squeeze Bottle for the Period 2022 - 2032F
- Belgium Jam Jelly and Preserve Import Export Trade Statistics
- Market Opportunity Assessment By Product Type
- Market Opportunity Assessment By Ingredient Type
- Market Opportunity Assessment By Distribution Channel
- Market Opportunity Assessment By Packaging Type
- Belgium Jam Jelly and Preserve Top Companies Market Share
- Belgium Jam Jelly and Preserve Competitive Benchmarking By Technical and Operational Parameters
- Belgium Jam Jelly and Preserve Company Profiles
- Belgium Jam Jelly and Preserve Key Strategic Recommendations
Frequently Asked Questions About the Market Study (FAQs):
6Wresearch actively monitors the Belgium Jam Jelly and Preserve Market and publishes its comprehensive annual report, highlighting emerging trends, growth drivers, revenue analysis, and forecast outlook. Our insights help businesses to make data-backed strategic decisions with ongoing market dynamics. Our analysts track relevent industries related to the Belgium Jam Jelly and Preserve Market, allowing our clients with actionable intelligence and reliable forecasts tailored to emerging regional needs.
Yes, we provide customisation as per your requirements. To learn more, feel free to contact us on sales@6wresearch.com
1 Executive Summary |
2 Introduction |
2.1 Key Highlights of the Report |
2.2 Report Description |
2.3 Market Scope & Segmentation |
2.4 Research Methodology |
2.5 Assumptions |
3 Belgium Jam Jelly and Preserve Market Overview |
3.1 Belgium Country Macro Economic Indicators |
3.2 Belgium Jam Jelly and Preserve Market Revenues & Volume, 2022 & 2032F |
3.3 Belgium Jam Jelly and Preserve Market - Industry Life Cycle |
3.4 Belgium Jam Jelly and Preserve Market - Porter's Five Forces |
3.5 Belgium Jam Jelly and Preserve Market Revenues & Volume Share, By Product Type, 2022 & 2032F |
3.6 Belgium Jam Jelly and Preserve Market Revenues & Volume Share, By Ingredient Type, 2022 & 2032F |
3.7 Belgium Jam Jelly and Preserve Market Revenues & Volume Share, By Distribution Channel, 2022 & 2032F |
3.8 Belgium Jam Jelly and Preserve Market Revenues & Volume Share, By Packaging Type, 2022 & 2032F |
4 Belgium Jam Jelly and Preserve Market Dynamics |
4.1 Impact Analysis |
4.2 Market Drivers |
4.2.1 Increasing health consciousness among consumers leading to a higher demand for natural and organic jams, jellies, and preserves. |
4.2.2 Growing trend of homemade and artisanal products in the food industry, driving interest in premium and unique flavors in the Belgium market. |
4.2.3 Rising popularity of breakfast culture and snacking habits, creating opportunities for jam, jelly, and preserve consumption throughout the day. |
4.3 Market Restraints |
4.3.1 Fluctuating prices of raw materials such as fruits and sugar impacting production costs and profit margins. |
4.3.2 Intense competition from other spreadable products like chocolate spreads and nut butters, leading to market saturation and pricing pressures. |
4.3.3 Stringent regulations and standards for food labeling, packaging, and ingredients, increasing compliance costs for manufacturers. |
5 Belgium Jam Jelly and Preserve Market Trends |
6 Belgium Jam Jelly and Preserve Market, By Types |
6.1 Belgium Jam Jelly and Preserve Market, By Product Type |
6.1.1 Overview and Analysis |
6.1.2 Belgium Jam Jelly and Preserve Market Revenues & Volume, By Product Type, 2022 - 2032F |
6.1.3 Belgium Jam Jelly and Preserve Market Revenues & Volume, By Jam, 2022 - 2032F |
6.1.4 Belgium Jam Jelly and Preserve Market Revenues & Volume, By Jelly, 2022 - 2032F |
6.1.5 Belgium Jam Jelly and Preserve Market Revenues & Volume, By Preserves, 2022 - 2032F |
6.2 Belgium Jam Jelly and Preserve Market, By Ingredient Type |
6.2.1 Overview and Analysis |
6.2.2 Belgium Jam Jelly and Preserve Market Revenues & Volume, By Fruit-Based, 2022 - 2032F |
6.2.3 Belgium Jam Jelly and Preserve Market Revenues & Volume, By Sugar-Free, 2022 - 2032F |
6.2.4 Belgium Jam Jelly and Preserve Market Revenues & Volume, By Organic, 2022 - 2032F |
6.3 Belgium Jam Jelly and Preserve Market, By Distribution Channel |
6.3.1 Overview and Analysis |
6.3.2 Belgium Jam Jelly and Preserve Market Revenues & Volume, By Supermarkets, 2022 - 2032F |
6.3.3 Belgium Jam Jelly and Preserve Market Revenues & Volume, By Online Stores, 2022 - 2032F |
6.3.4 Belgium Jam Jelly and Preserve Market Revenues & Volume, By Specialty Stores, 2022 - 2032F |
6.4 Belgium Jam Jelly and Preserve Market, By Packaging Type |
6.4.1 Overview and Analysis |
6.4.2 Belgium Jam Jelly and Preserve Market Revenues & Volume, By Glass Jar, 2022 - 2032F |
6.4.3 Belgium Jam Jelly and Preserve Market Revenues & Volume, By Plastic Container, 2022 - 2032F |
6.4.4 Belgium Jam Jelly and Preserve Market Revenues & Volume, By Squeeze Bottle, 2022 - 2032F |
7 Belgium Jam Jelly and Preserve Market Import-Export Trade Statistics |
7.1 Belgium Jam Jelly and Preserve Market Export to Major Countries |
7.2 Belgium Jam Jelly and Preserve Market Imports from Major Countries |
8 Belgium Jam Jelly and Preserve Market Key Performance Indicators |
8.1 Percentage of market penetration in the breakfast segment. |
8.2 Number of new product launches or flavor variants introduced annually. |
8.3 Customer satisfaction scores through surveys or online reviews. |
8.4 Percentage of sales from online channels compared to traditional retail. |
8.5 Rate of repeat purchases or customer loyalty metrics. |
9 Belgium Jam Jelly and Preserve Market - Opportunity Assessment |
9.1 Belgium Jam Jelly and Preserve Market Opportunity Assessment, By Product Type, 2022 & 2032F |
9.2 Belgium Jam Jelly and Preserve Market Opportunity Assessment, By Ingredient Type, 2022 & 2032F |
9.3 Belgium Jam Jelly and Preserve Market Opportunity Assessment, By Distribution Channel, 2022 & 2032F |
9.4 Belgium Jam Jelly and Preserve Market Opportunity Assessment, By Packaging Type, 2022 & 2032F |
10 Belgium Jam Jelly and Preserve Market - Competitive Landscape |
10.1 Belgium Jam Jelly and Preserve Market Revenue Share, By Companies, 2025 |
10.2 Belgium Jam Jelly and Preserve Market Competitive Benchmarking, By Operating and Technical Parameters |
11 Company Profiles |
12 Recommendations |
13 Disclaimer |
Export potential assessment - trade Analytics for 2030
Export potential enables firms to identify high-growth global markets with greater confidence by combining advanced trade intelligence with a structured quantitative methodology. The framework analyzes emerging demand trends and country-level import patterns while integrating macroeconomic and trade datasets such as GDP and population forecasts, bilateral import–export flows, tariff structures, elasticity differentials between developed and developing economies, geographic distance, and import demand projections. Using weighted trade values from 2020–2024 as the base period to project country-to-country export potential for 2030, these inputs are operationalized through calculated drivers such as gravity model parameters, tariff impact factors, and projected GDP per-capita growth. Through an analysis of hidden potentials, demand hotspots, and market conditions that are most favorable to success, this method enables firms to focus on target countries, maximize returns, and global expansion with data, backed by accuracy.
By factoring in the projected importer demand gap that is currently unmet and could be potential opportunity, it identifies the potential for the Exporter (Country) among 190 countries, against the general trade analysis, which identifies the biggest importer or exporter.
To discover high-growth global markets and optimize your business strategy:
Click Here
Pricing
- Single User License$ 1,995
- Department License$ 2,400
- Site License$ 3,120
- Global License$ 3,795

Search
Thought Leadership and Analyst Meet


Our Clients
Latest Reports
- Philippines Polyhydroxybutyrate-co-Hydroxyvalerate Market (2026-2032) | Trends, Insights, Challenges, Restraints, Competition, Size, Value, Forecast, Pricing, Share, Outlook, Revenue, Investment Opportunities, Strategy, Drivers, Demand, Growth, segmentation, Analysis, Companies
- Peru Polyhydroxybutyrate-co-Hydroxyvalerate Market (2026-2032) | Growth, Demand, Challenges, Share, Trends, Analysis, Pricing, Investment Opportunities, Drivers, Value, Forecast, Competition, Size, Companies, Insights, Outlook, Restraints, segmentation, Revenue, Strategy
- Pakistan Polyhydroxybutyrate-co-Hydroxyvalerate Market (2026-2032) | Restraints, segmentation, Pricing, Forecast, Share, Strategy, Competition, Trends, Insights, Drivers, Challenges, Growth, Revenue, Outlook, Value, Investment Opportunities, Companies, Size, Analysis, Demand
- Oman Polyhydroxybutyrate-co-Hydroxyvalerate Market (2026-2032) | Drivers, segmentation, Insights, Competition, Pricing, Outlook, Size, Revenue, Challenges, Forecast, Analysis, Growth, Value, Share, Trends, Investment Opportunities, Strategy, Restraints, Companies, Demand
- Nigeria Polyhydroxybutyrate-co-Hydroxyvalerate Market (2026-2032) | Value, Investment Opportunities, Analysis, Revenue, Restraints, Pricing, Outlook, Competition, Demand, Growth, Forecast, Companies, Trends, Challenges, segmentation, Drivers, Insights, Share, Size, Strategy
- Nepal Polyhydroxybutyrate-co-Hydroxyvalerate Market (2026-2032) | Insights, Analysis, Drivers, Share, Revenue, Demand, segmentation, Investment Opportunities, Competition, Forecast, Growth, Pricing, Companies, Strategy, Trends, Restraints, Challenges, Outlook, Size, Value
- Myanmar Polyhydroxybutyrate-co-Hydroxyvalerate Market (2026-2032) | Outlook, Revenue, Strategy, Restraints, Drivers, segmentation, Share, Forecast, Competition, Insights, Growth, Pricing, Size, Demand, Value, Companies, Trends, Challenges, Investment Opportunities, Analysis
- Morocco Polyhydroxybutyrate-co-Hydroxyvalerate Market (2026-2032) | Outlook, Investment Opportunities, Restraints, Strategy, Forecast, Challenges, Drivers, Growth, Companies, segmentation, Trends, Size, Competition, Revenue, Demand, Insights, Share, Analysis, Value, Pricing
- Mexico Polyhydroxybutyrate-co-Hydroxyvalerate Market (2026-2032) | Size, Drivers, Outlook, Share, Strategy, Growth, Pricing, Challenges, Companies, Demand, Value, Investment Opportunities, Restraints, Trends, Forecast, segmentation, Analysis, Insights, Competition, Revenue
- Malaysia Polyhydroxybutyrate-co-Hydroxyvalerate Market (2026-2032) | Share, segmentation, Size, Companies, Analysis, Insights, Forecast, Value, Revenue, Drivers, Restraints, Challenges, Investment Opportunities, Trends, Competition, Strategy, Demand, Growth, Outlook, Pricing
Industry Events and Analyst Meet

HIMTEX 2026

India Refining Summit 2026

India EV Show 2026

EV tech India Expo 2026

Auto Tech Asia 2026
Whitepaper
- Middle East & Africa Commercial Security Market Click here to view more.
- Middle East & Africa Fire Safety Systems & Equipment Market Click here to view more.
- GCC Drone Market Click here to view more.
- Middle East Lighting Fixture Market Click here to view more.
- GCC Physical & Perimeter Security Market Click here to view more.
6WResearch In News
- Doha a strategic location for EV manufacturing hub: IPA Qatar
- Demand for luxury TVs surging in the GCC, says Samsung
- Empowering Growth: The Thriving Journey of Bangladesh’s Cable Industry
- Demand for luxury TVs surging in the GCC, says Samsung
- Video call with a traditional healer? Once unthinkable, it’s now common in South Africa
- Intelligent Buildings To Smooth GCC’s Path To Net Zero