Belgium Maple syrup Market (2025-2031) | Size, Segmentation, Industry, Companies, Outlook, Value, Forecast, Share, Revenue, Trends, Analysis & Growth
Market Forecast By Raw Material (Red Maple, Black Maple, Sugar Maple), By Application (Baking Powder, Waffles, Pancakes, French Toast, Oatmeal), By Distribution Channel (Online Stores, Retail Stores, Super/Hypermarket) And Competitive Landscape
| Product Code: ETC4808485 | Publication Date: Nov 2023 | Updated Date: Oct 2025 | Product Type: Market Research Report | |
| Publisher: 6Wresearch | Author: Sachin Kumar Rai | No. of Pages: 60 | No. of Figures: 30 | No. of Tables: 5 |
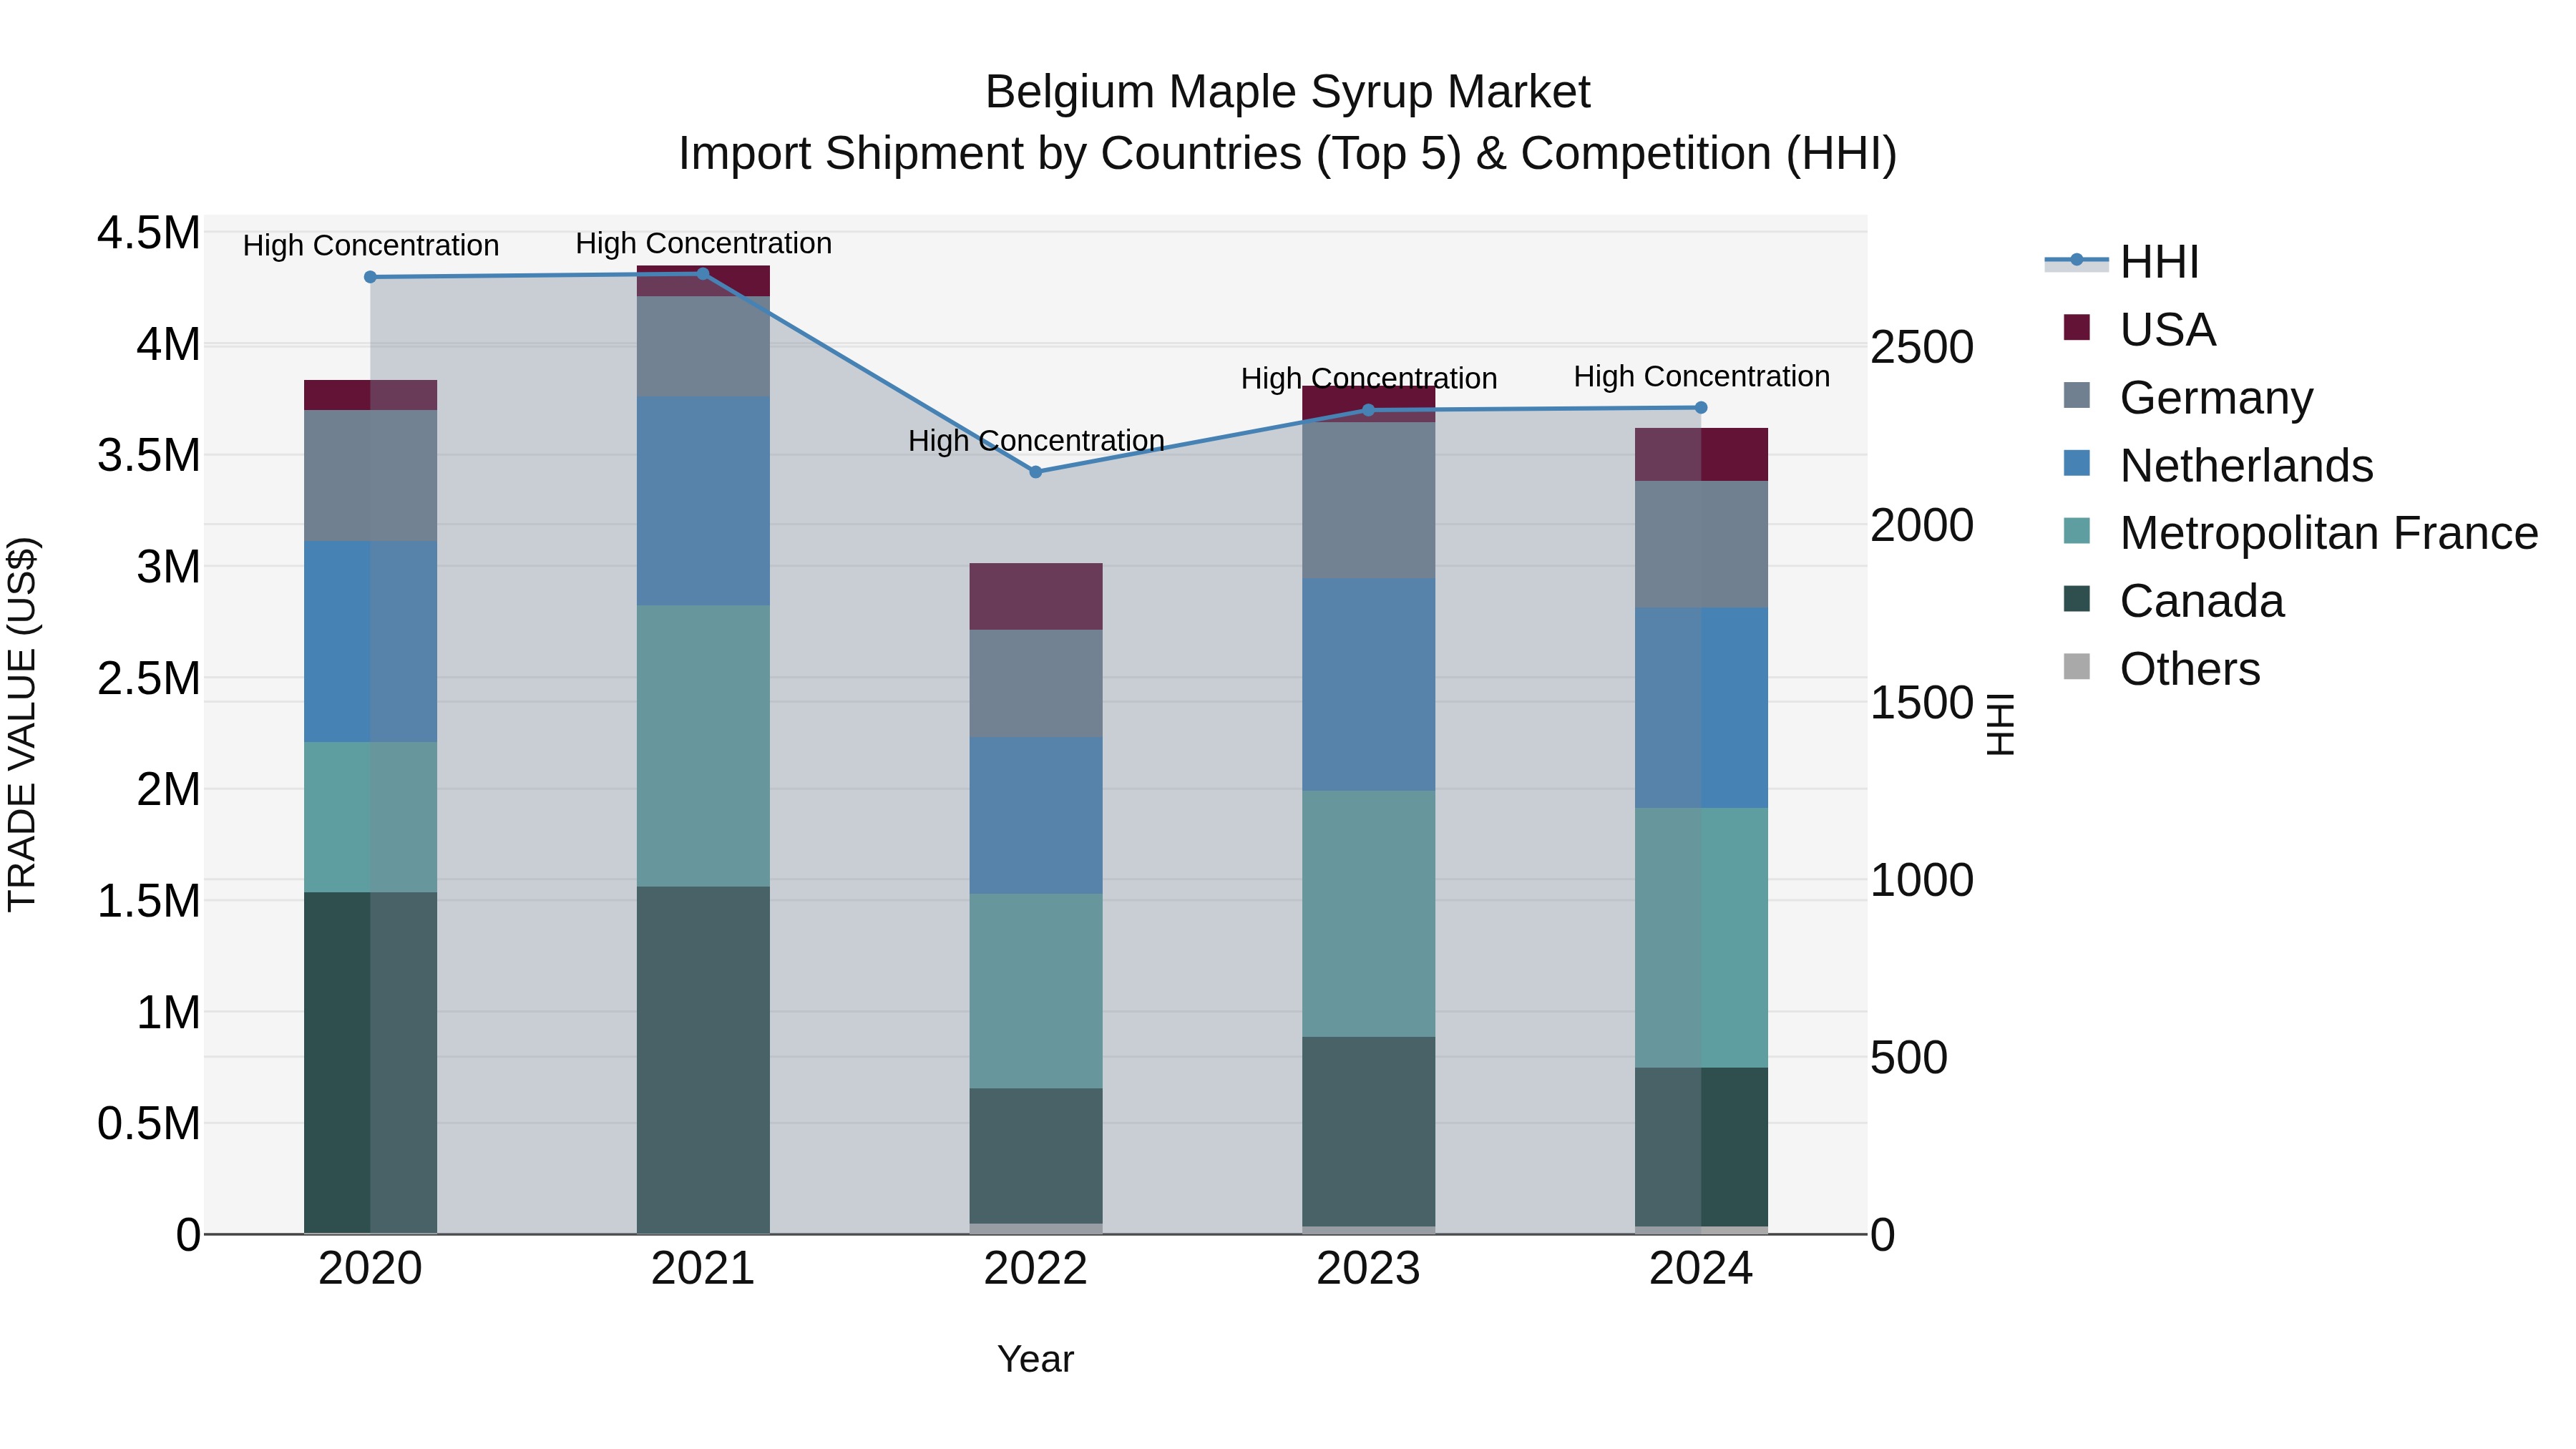
Belgium Maple Syrup Market Top 5 Importing Countries and Market Competition (HHI) Analysis
Despite a decline in both the overall CAGR and the growth rate from 2023 to 2024, Belgium continues to import significant quantities of maple syrup from key exporting countries such as Metropolitan France, Netherlands, Canada, Germany, and the USA. The High Herfindahl-Hirschman Index (HHI) indicates a high level of market concentration, suggesting that these top exporters hold substantial market share in the Belgian maple syrup import market. Monitoring the evolving trends in import volumes and market dynamics will be crucial for stakeholders to navigate the competitive landscape and identify growth opportunities in the coming years.
Belgium Maple syrup Market Overview
The maple syrup market in Belgium is growing, driven by the demand for natural sweeteners. The popularity of maple syrup as a healthy alternative to refined sugar is influencing market dynamics.
Drivers of the market
The maple syrup market in Belgium is characterized by the demand for this natural sweetener used in various food and beverage products. Maple syrup is valued for its unique flavor and natural origin. Belgiums focus on healthy and natural food products supports market growth. The increasing demand for high-quality maple syrup drives market development.
Challenges of the market
The maple syrup market in Belgium faces challenges related to supply chain management and market competition. Maple syrup production is dependent on specific climatic conditions, which can impact supply consistency. Additionally, competition from both local and international producers influences market dynamics. Ensuring a reliable supply chain and managing competition while maintaining product quality are critical challenges for market participants.
Government Policy of the market
Government policies in Belgium support the maple syrup market by promoting sustainable agriculture and quality standards. Financial assistance for producers and incentives for adopting eco-friendly practices enhance market competitiveness. Regulations ensuring food safety and quality drive the adoption of high-quality maple syrup products.
Key Highlights of the Report:
- Belgium Maple syrup Market Outlook
- Market Size of Belgium Maple syrup Market, 2024
- Forecast of Belgium Maple syrup Market, 2031
- Historical Data and Forecast of Belgium Maple syrup Revenues & Volume for the Period 2021-2031
- Belgium Maple syrup Market Trend Evolution
- Belgium Maple syrup Market Drivers and Challenges
- Belgium Maple syrup Price Trends
- Belgium Maple syrup Porter`s Five Forces
- Belgium Maple syrup Industry Life Cycle
- Historical Data and Forecast of Belgium Maple syrup Market Revenues & Volume By Raw Material for the Period 2021-2031
- Historical Data and Forecast of Belgium Maple syrup Market Revenues & Volume By Red Maple for the Period 2021-2031
- Historical Data and Forecast of Belgium Maple syrup Market Revenues & Volume By Black Maple for the Period 2021-2031
- Historical Data and Forecast of Belgium Maple syrup Market Revenues & Volume By Sugar Maple for the Period 2021-2031
- Historical Data and Forecast of Belgium Maple syrup Market Revenues & Volume By Application for the Period 2021-2031
- Historical Data and Forecast of Belgium Maple syrup Market Revenues & Volume By Baking Powder for the Period 2021-2031
- Historical Data and Forecast of Belgium Maple syrup Market Revenues & Volume By Waffles for the Period 2021-2031
- Historical Data and Forecast of Belgium Maple syrup Market Revenues & Volume By Pancakes for the Period 2021-2031
- Historical Data and Forecast of Belgium Maple syrup Market Revenues & Volume By French Toast for the Period 2021-2031
- Historical Data and Forecast of Belgium Maple syrup Market Revenues & Volume By Oatmeal for the Period 2021-2031
- Historical Data and Forecast of Belgium Maple syrup Market Revenues & Volume By Distribution Channel for the Period 2021-2031
- Historical Data and Forecast of Belgium Maple syrup Market Revenues & Volume By Online Stores for the Period 2021-2031
- Historical Data and Forecast of Belgium Maple syrup Market Revenues & Volume By Retail Stores for the Period 2021-2031
- Historical Data and Forecast of Belgium Maple syrup Market Revenues & Volume By Super/Hypermarket for the Period 2021-2031
- Belgium Maple syrup Import Export Trade Statistics
- Market Opportunity Assessment By Raw Material
- Market Opportunity Assessment By Application
- Market Opportunity Assessment By Distribution Channel
- Belgium Maple syrup Top Companies Market Share
- Belgium Maple syrup Competitive Benchmarking By Technical and Operational Parameters
- Belgium Maple syrup Company Profiles
- Belgium Maple syrup Key Strategic Recommendations
Frequently Asked Questions About the Market Study (FAQs):
6Wresearch actively monitors the Belgium Maple syrup Market and publishes its comprehensive annual report, highlighting emerging trends, growth drivers, revenue analysis, and forecast outlook. Our insights help businesses to make data-backed strategic decisions with ongoing market dynamics. Our analysts track relevent industries related to the Belgium Maple syrup Market, allowing our clients with actionable intelligence and reliable forecasts tailored to emerging regional needs.
Yes, we provide customisation as per your requirements. To learn more, feel free to contact us on sales@6wresearch.com
1 Executive Summary |
2 Introduction |
2.1 Key Highlights of the Report |
2.2 Report Description |
2.3 Market Scope & Segmentation |
2.4 Research Methodology |
2.5 Assumptions |
3 Belgium Maple syrup Market Overview |
3.1 Belgium Country Macro Economic Indicators |
3.2 Belgium Maple syrup Market Revenues & Volume, 2021 & 2031F |
3.3 Belgium Maple syrup Market - Industry Life Cycle |
3.4 Belgium Maple syrup Market - Porter's Five Forces |
3.5 Belgium Maple syrup Market Revenues & Volume Share, By Raw Material, 2021 & 2031F |
3.6 Belgium Maple syrup Market Revenues & Volume Share, By Application, 2021 & 2031F |
3.7 Belgium Maple syrup Market Revenues & Volume Share, By Distribution Channel, 2021 & 2031F |
4 Belgium Maple syrup Market Dynamics |
4.1 Impact Analysis |
4.2 Market Drivers |
4.2.1 Increasing consumer awareness about health benefits of maple syrup |
4.2.2 Growing demand for natural and organic food products |
4.2.3 Rising trend of using maple syrup as a sweetener in various dishes and beverages |
4.3 Market Restraints |
4.3.1 Limited maple syrup production in Belgium compared to other countries |
4.3.2 High production costs due to specific climate requirements for maple trees |
4.3.3 Competition from other sweeteners and alternative syrups in the market |
5 Belgium Maple syrup Market Trends |
6 Belgium Maple syrup Market Segmentations |
6.1 Belgium Maple syrup Market, By Raw Material |
6.1.1 Overview and Analysis |
6.1.2 Belgium Maple syrup Market Revenues & Volume, By Red Maple, 2021-2031F |
6.1.3 Belgium Maple syrup Market Revenues & Volume, By Black Maple, 2021-2031F |
6.1.4 Belgium Maple syrup Market Revenues & Volume, By Sugar Maple, 2021-2031F |
6.2 Belgium Maple syrup Market, By Application |
6.2.1 Overview and Analysis |
6.2.2 Belgium Maple syrup Market Revenues & Volume, By Baking Powder, 2021-2031F |
6.2.3 Belgium Maple syrup Market Revenues & Volume, By Waffles, 2021-2031F |
6.2.4 Belgium Maple syrup Market Revenues & Volume, By Pancakes, 2021-2031F |
6.2.5 Belgium Maple syrup Market Revenues & Volume, By French Toast, 2021-2031F |
6.2.6 Belgium Maple syrup Market Revenues & Volume, By Oatmeal, 2021-2031F |
6.3 Belgium Maple syrup Market, By Distribution Channel |
6.3.1 Overview and Analysis |
6.3.2 Belgium Maple syrup Market Revenues & Volume, By Online Stores, 2021-2031F |
6.3.3 Belgium Maple syrup Market Revenues & Volume, By Retail Stores, 2021-2031F |
6.3.4 Belgium Maple syrup Market Revenues & Volume, By Super/Hypermarket, 2021-2031F |
7 Belgium Maple syrup Market Import-Export Trade Statistics |
7.1 Belgium Maple syrup Market Export to Major Countries |
7.2 Belgium Maple syrup Market Imports from Major Countries |
8 Belgium Maple syrup Market Key Performance Indicators |
8.1 Average price of Belgium maple syrup compared to imported maple syrups |
8.2 Number of new product launches featuring Belgium maple syrup |
8.3 Consumer satisfaction levels with the quality and taste of Belgium maple syrup |
8.4 Percentage of restaurants and cafes using Belgium maple syrup in their menu items |
8.5 Growth in online searches and social media mentions related to Belgium maple syrup |
9 Belgium Maple syrup Market - Opportunity Assessment |
9.1 Belgium Maple syrup Market Opportunity Assessment, By Raw Material, 2021 & 2031F |
9.2 Belgium Maple syrup Market Opportunity Assessment, By Application, 2021 & 2031F |
9.3 Belgium Maple syrup Market Opportunity Assessment, By Distribution Channel, 2021 & 2031F |
10 Belgium Maple syrup Market - Competitive Landscape |
10.1 Belgium Maple syrup Market Revenue Share, By Companies, 2024 |
10.2 Belgium Maple syrup Market Competitive Benchmarking, By Operating and Technical Parameters |
11 Company Profiles |
12 Recommendations | 13 Disclaimer |
Export potential assessment - trade Analytics for 2030
Export potential enables firms to identify high-growth global markets with greater confidence by combining advanced trade intelligence with a structured quantitative methodology. The framework analyzes emerging demand trends and country-level import patterns while integrating macroeconomic and trade datasets such as GDP and population forecasts, bilateral import–export flows, tariff structures, elasticity differentials between developed and developing economies, geographic distance, and import demand projections. Using weighted trade values from 2020–2024 as the base period to project country-to-country export potential for 2030, these inputs are operationalized through calculated drivers such as gravity model parameters, tariff impact factors, and projected GDP per-capita growth. Through an analysis of hidden potentials, demand hotspots, and market conditions that are most favorable to success, this method enables firms to focus on target countries, maximize returns, and global expansion with data, backed by accuracy.
By factoring in the projected importer demand gap that is currently unmet and could be potential opportunity, it identifies the potential for the Exporter (Country) among 190 countries, against the general trade analysis, which identifies the biggest importer or exporter.
To discover high-growth global markets and optimize your business strategy:
Click Here
Pricing
- Single User License$ 1,995
- Department License$ 2,400
- Site License$ 3,120
- Global License$ 3,795

Search
Thought Leadership and Analyst Meet


Our Clients
Latest Reports
- Philippines Polyhydroxybutyrate-co-Hydroxyvalerate Market (2026-2032) | Trends, Insights, Challenges, Restraints, Competition, Size, Value, Forecast, Pricing, Share, Outlook, Revenue, Investment Opportunities, Strategy, Drivers, Demand, Growth, segmentation, Analysis, Companies
- Peru Polyhydroxybutyrate-co-Hydroxyvalerate Market (2026-2032) | Growth, Demand, Challenges, Share, Trends, Analysis, Pricing, Investment Opportunities, Drivers, Value, Forecast, Competition, Size, Companies, Insights, Outlook, Restraints, segmentation, Revenue, Strategy
- Pakistan Polyhydroxybutyrate-co-Hydroxyvalerate Market (2026-2032) | Restraints, segmentation, Pricing, Forecast, Share, Strategy, Competition, Trends, Insights, Drivers, Challenges, Growth, Revenue, Outlook, Value, Investment Opportunities, Companies, Size, Analysis, Demand
- Oman Polyhydroxybutyrate-co-Hydroxyvalerate Market (2026-2032) | Drivers, segmentation, Insights, Competition, Pricing, Outlook, Size, Revenue, Challenges, Forecast, Analysis, Growth, Value, Share, Trends, Investment Opportunities, Strategy, Restraints, Companies, Demand
- Nigeria Polyhydroxybutyrate-co-Hydroxyvalerate Market (2026-2032) | Value, Investment Opportunities, Analysis, Revenue, Restraints, Pricing, Outlook, Competition, Demand, Growth, Forecast, Companies, Trends, Challenges, segmentation, Drivers, Insights, Share, Size, Strategy
- Nepal Polyhydroxybutyrate-co-Hydroxyvalerate Market (2026-2032) | Insights, Analysis, Drivers, Share, Revenue, Demand, segmentation, Investment Opportunities, Competition, Forecast, Growth, Pricing, Companies, Strategy, Trends, Restraints, Challenges, Outlook, Size, Value
- Myanmar Polyhydroxybutyrate-co-Hydroxyvalerate Market (2026-2032) | Outlook, Revenue, Strategy, Restraints, Drivers, segmentation, Share, Forecast, Competition, Insights, Growth, Pricing, Size, Demand, Value, Companies, Trends, Challenges, Investment Opportunities, Analysis
- Morocco Polyhydroxybutyrate-co-Hydroxyvalerate Market (2026-2032) | Outlook, Investment Opportunities, Restraints, Strategy, Forecast, Challenges, Drivers, Growth, Companies, segmentation, Trends, Size, Competition, Revenue, Demand, Insights, Share, Analysis, Value, Pricing
- Mexico Polyhydroxybutyrate-co-Hydroxyvalerate Market (2026-2032) | Size, Drivers, Outlook, Share, Strategy, Growth, Pricing, Challenges, Companies, Demand, Value, Investment Opportunities, Restraints, Trends, Forecast, segmentation, Analysis, Insights, Competition, Revenue
- Malaysia Polyhydroxybutyrate-co-Hydroxyvalerate Market (2026-2032) | Share, segmentation, Size, Companies, Analysis, Insights, Forecast, Value, Revenue, Drivers, Restraints, Challenges, Investment Opportunities, Trends, Competition, Strategy, Demand, Growth, Outlook, Pricing
Industry Events and Analyst Meet

HIMTEX 2026

India Refining Summit 2026

India EV Show 2026

EV tech India Expo 2026

Auto Tech Asia 2026
Whitepaper
- Middle East & Africa Commercial Security Market Click here to view more.
- Middle East & Africa Fire Safety Systems & Equipment Market Click here to view more.
- GCC Drone Market Click here to view more.
- Middle East Lighting Fixture Market Click here to view more.
- GCC Physical & Perimeter Security Market Click here to view more.
6WResearch In News
- Doha a strategic location for EV manufacturing hub: IPA Qatar
- Demand for luxury TVs surging in the GCC, says Samsung
- Empowering Growth: The Thriving Journey of Bangladesh’s Cable Industry
- Demand for luxury TVs surging in the GCC, says Samsung
- Video call with a traditional healer? Once unthinkable, it’s now common in South Africa
- Intelligent Buildings To Smooth GCC’s Path To Net Zero