Belgium Road Safety Market (2026-2032) | Analysis, Industry, Growth, Forecast, Outlook, Trends, Share, Companies, Size, Segmentation, Revenue & Value
Market Forecast By Solutions (Red Light, Speed, Bus Lane, Section Enforcement, ALPR/ANPR), By Service (Consulting and Training, System Integration and Deployment, Support and Maintenance) And Competitive Landscape
| Product Code: ETC5683872 | Publication Date: Nov 2023 | Updated Date: Apr 2026 | Product Type: Market Research Report | |
| Publisher: 6Wresearch | Author: Ravi Bhandari | No. of Pages: 60 | No. of Figures: 30 | No. of Tables: 5 |
Belgium Road Safety Market Size (2020-2030)
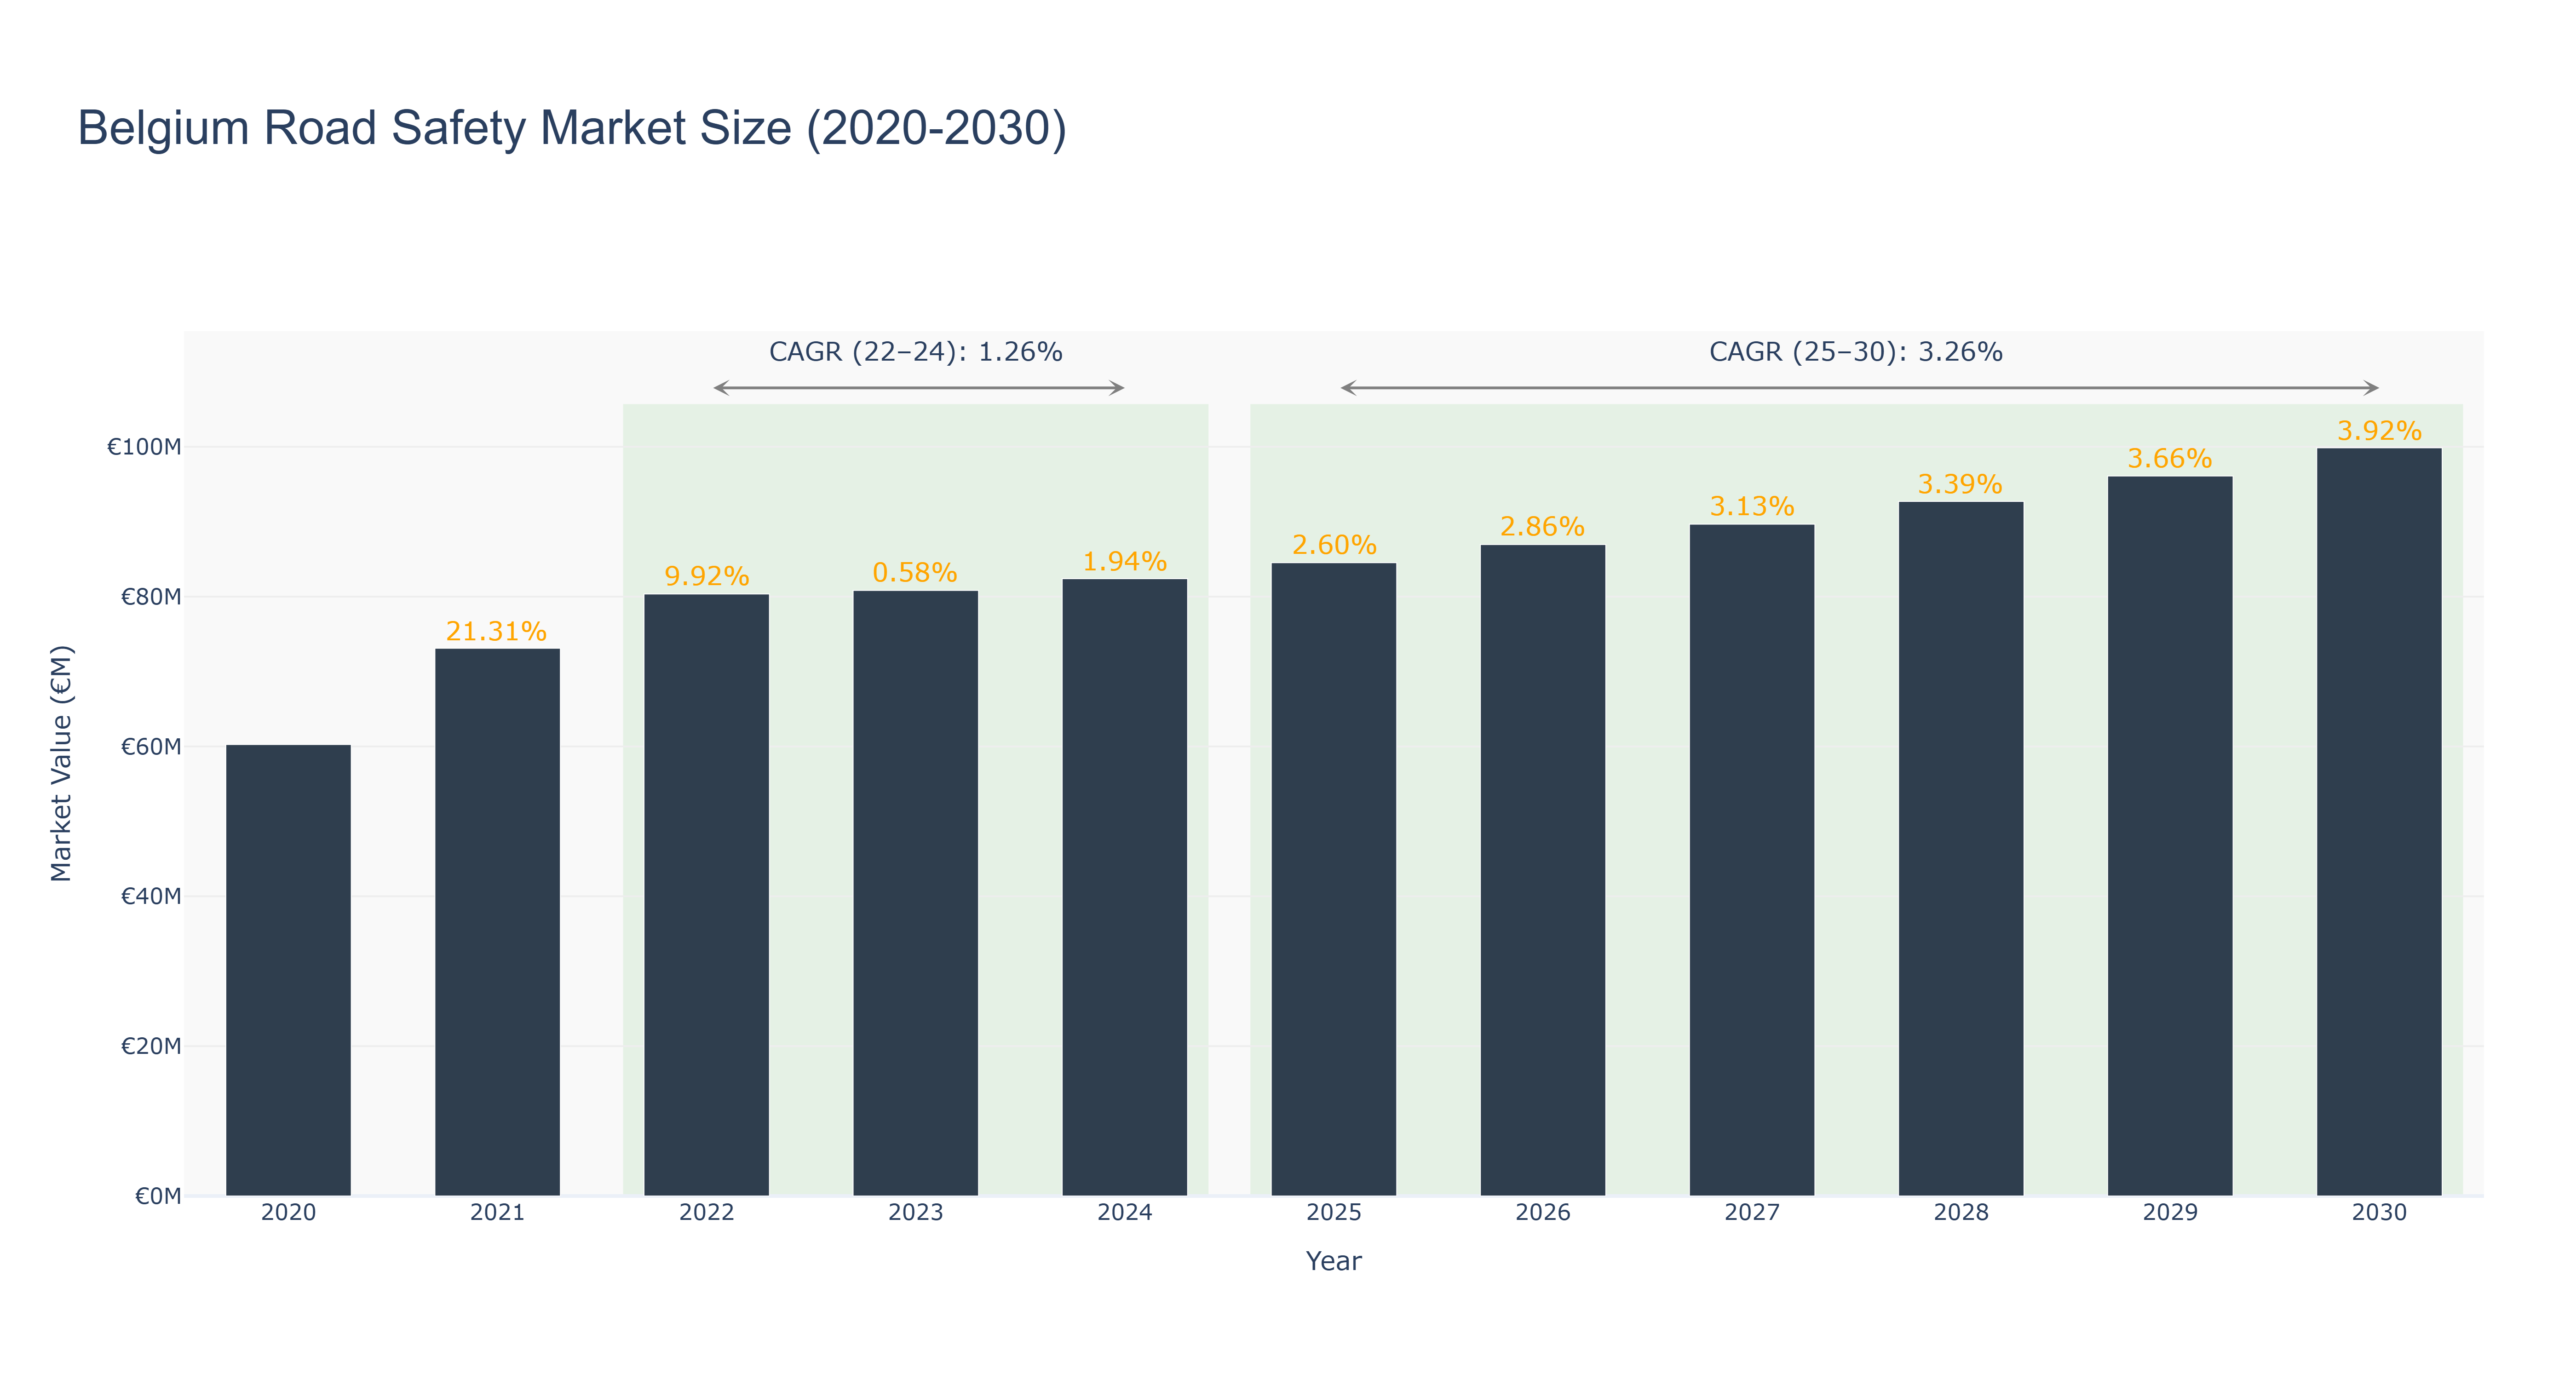
Belgium Road Safety Market has shown a steady growth trajectory over the years. The peak market size of €99.87 million is forecasted for 2030, with a consistent CAGR of 3.92% from 2025 to 2030. The actual market size has increased from €60.26 million in 2020 to €82.39 million in 2024, reflecting a positive trend. The CAGR between 2022-24 was 1.26%, while from 2025-30 it is expected to be 3.26%. This growth can be attributed to increasing government focus on road safety measures, technological advancements in the sector, and rising awareness among the population. Looking ahead, Belgium is set to implement a nationwide smart traffic management system in collaboration with leading tech companies to further enhance road safety measures and reduce accidents. Industry drivers for the Belgium Road Safety Market include stringent regulations, rising demand for intelligent transportation systems, and increasing investments in infrastructure development. These factors are expected to drive market growth in the coming years, making the road safety sector a key focus area for stakeholders and policymakers alike.
Belgium Road Safety Market: Production & Trade Performance (2019-2025)
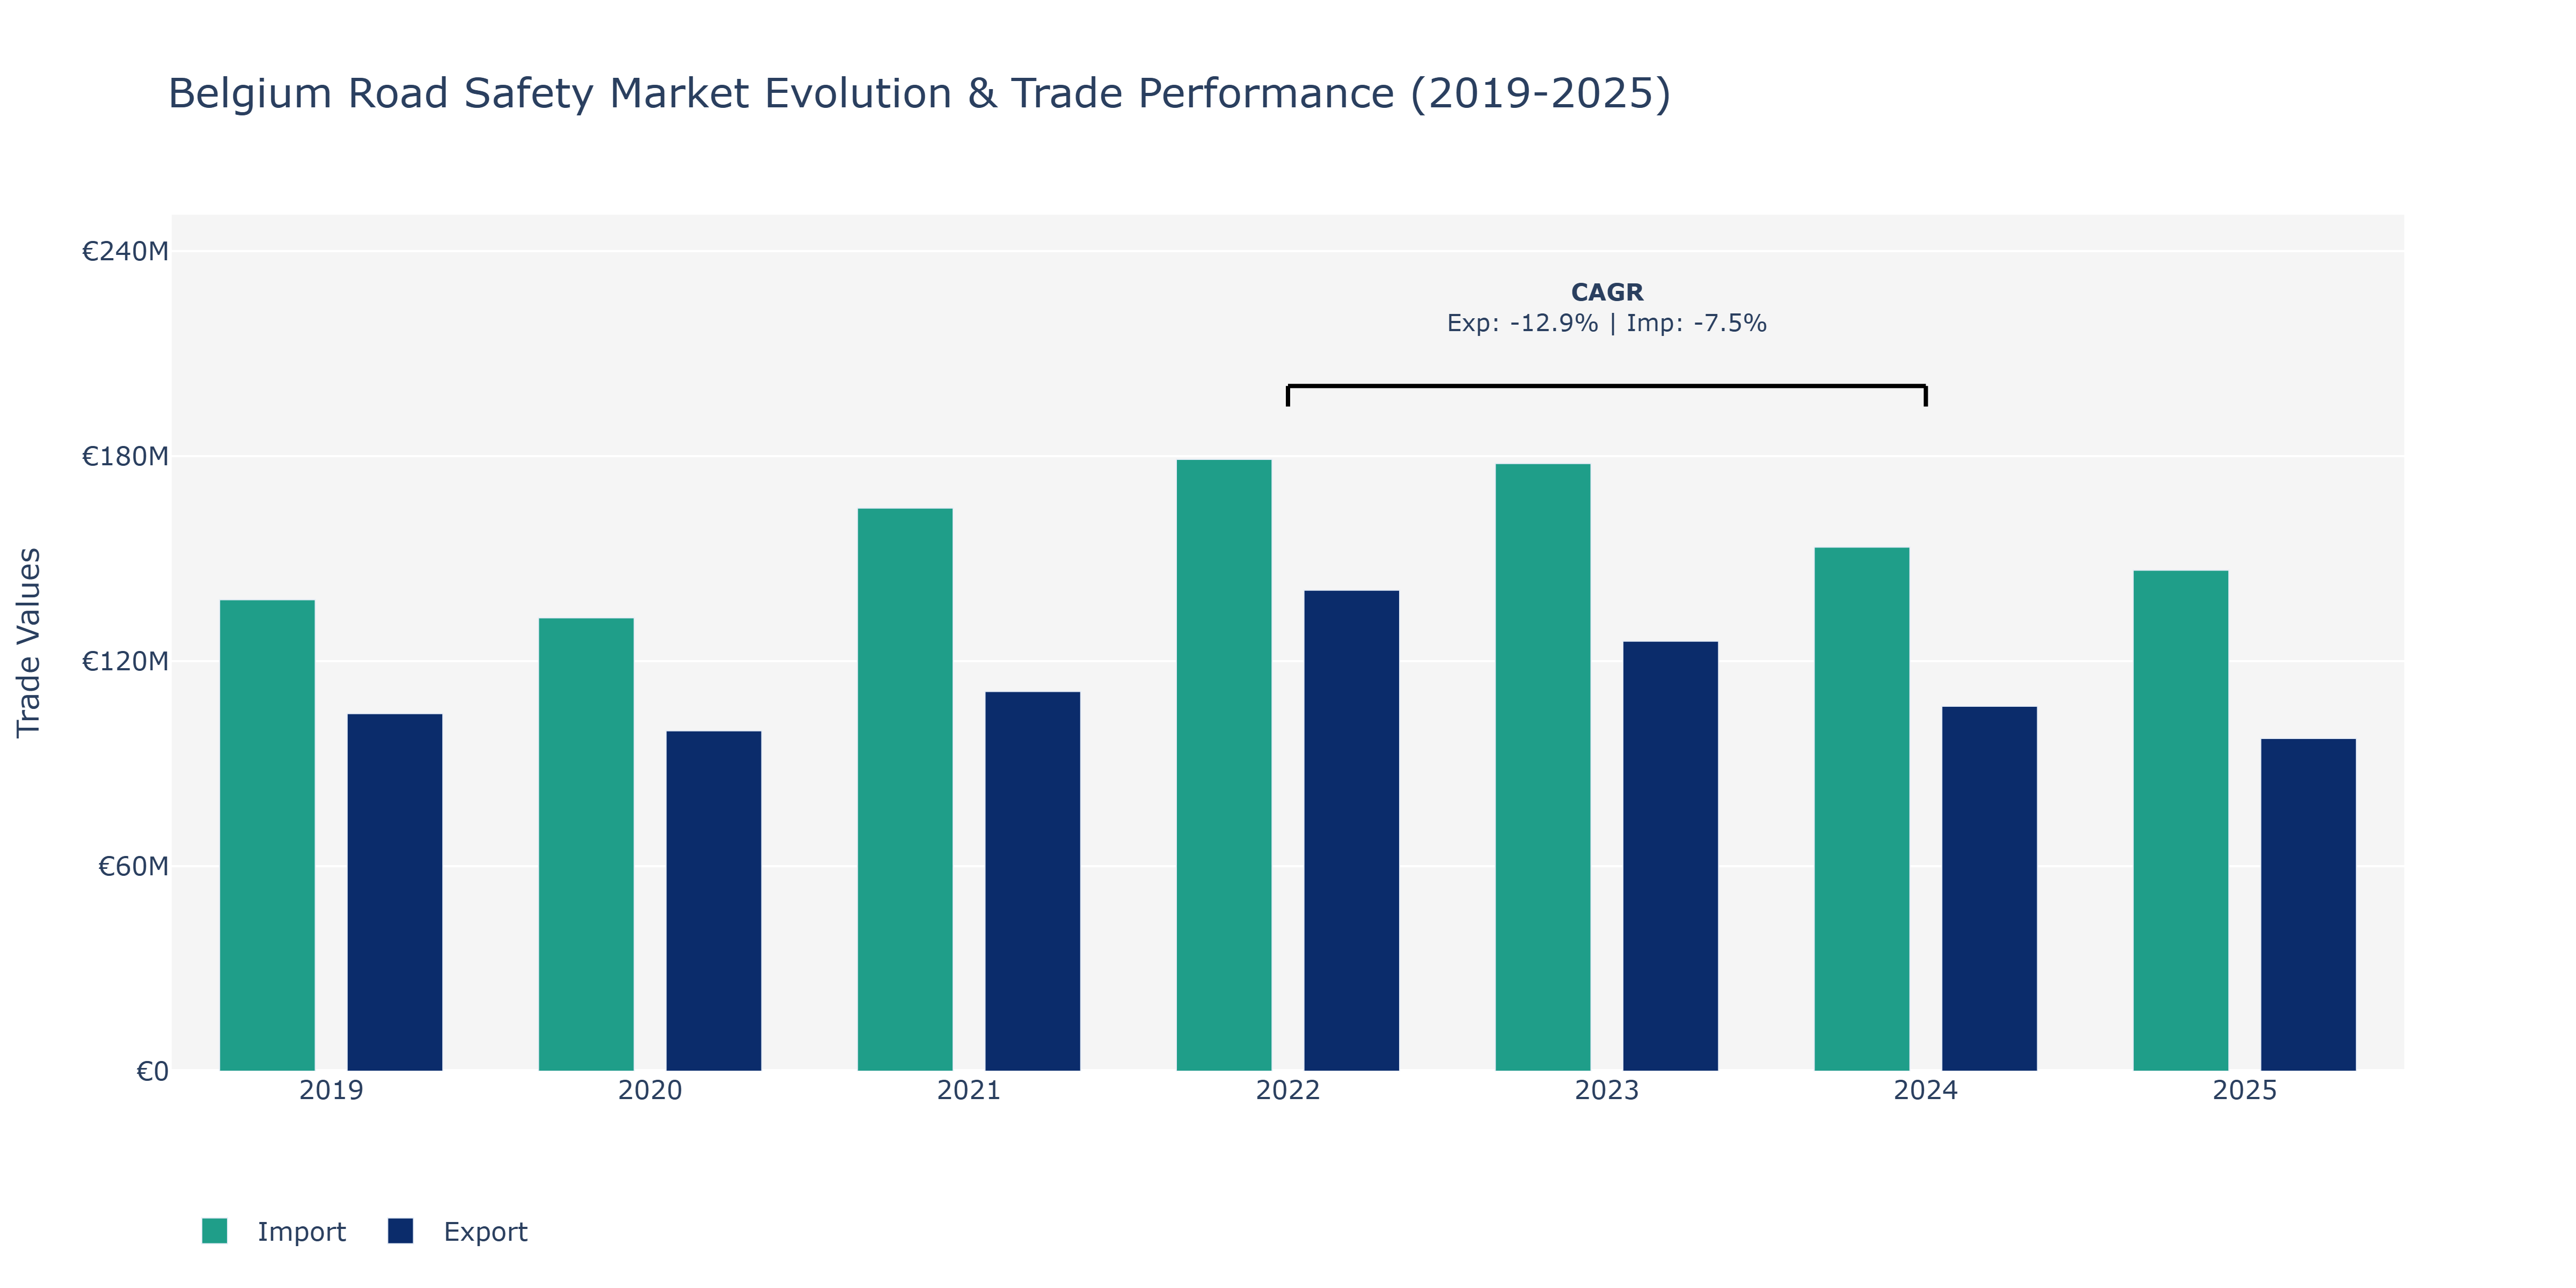
In the Belgium Road Safety Market, exports and imports show fluctuating trends over the years. In 2019, exports were €104.64 million, and imports stood at €137.98 million. By 2020, both exports and imports experienced a decline, reaching €99.62 million and €132.67 million, respectively. The following year, there was a notable increase in both exports, amounting to €111.1 million, and imports, totaling €164.77 million. The peak points were observed in 2022, with exports hitting €140.75 million and imports reaching €179.04 million. However, in 2024, both exports and imports decreased, with values of €106.79 million and €153.35 million, respectively. The declining trend could be attributed to changes in global demand, economic conditions, and regulatory policies impacting trade within the road safety market. As the market evolves with technological advancements and shifts in consumer preferences, stakeholders may need to adapt to these changes to maintain competitiveness.
Key Highlights of the Report:
- Belgium Road Safety Market Outlook
- Market Size of Belgium Road Safety Market, 2025
- Forecast of Belgium Road Safety Market, 2032
- Historical Data and Forecast of Belgium Road Safety Revenues & Volume for the Period 2022 - 2032F
- Belgium Road Safety Market Trend Evolution
- Belgium Road Safety Market Drivers and Challenges
- Belgium Road Safety Price Trends
- Belgium Road Safety Porter`s Five Forces
- Belgium Road Safety Industry Life Cycle
- Historical Data and Forecast of Belgium Road Safety Market Revenues & Volume By Solutions for the Period 2022 - 2032F
- Historical Data and Forecast of Belgium Road Safety Market Revenues & Volume By Red Light for the Period 2022 - 2032F
- Historical Data and Forecast of Belgium Road Safety Market Revenues & Volume By Speed for the Period 2022 - 2032F
- Historical Data and Forecast of Belgium Road Safety Market Revenues & Volume By Bus Lane for the Period 2022 - 2032F
- Historical Data and Forecast of Belgium Road Safety Market Revenues & Volume By Section Enforcement for the Period 2022 - 2032F
- Historical Data and Forecast of Belgium Road Safety Market Revenues & Volume By ALPR/ANPR for the Period 2022 - 2032F
- Historical Data and Forecast of Belgium Road Safety Market Revenues & Volume By Service for the Period 2022 - 2032F
- Historical Data and Forecast of Belgium Road Safety Market Revenues & Volume By Consulting and Training for the Period 2022 - 2032F
- Historical Data and Forecast of Belgium Road Safety Market Revenues & Volume By System Integration and Deployment for the Period 2022 - 2032F
- Historical Data and Forecast of Belgium Road Safety Market Revenues & Volume By Support and Maintenance for the Period 2022 - 2032F
- Belgium Road Safety Import Export Trade Statistics
- Market Opportunity Assessment By Solutions
- Market Opportunity Assessment By Service
- Belgium Road Safety Top Companies Market Share
- Belgium Road Safety Competitive Benchmarking By Technical and Operational Parameters
- Belgium Road Safety Company Profiles
- Belgium Road Safety Key Strategic Recommendations
Frequently Asked Questions About the Market Study (FAQs):
6Wresearch actively monitors the Belgium Road Safety Market and publishes its comprehensive annual report, highlighting emerging trends, growth drivers, revenue analysis, and forecast outlook. Our insights help businesses to make data-backed strategic decisions with ongoing market dynamics. Our analysts track relevent industries related to the Belgium Road Safety Market, allowing our clients with actionable intelligence and reliable forecasts tailored to emerging regional needs.
Yes, we provide customisation as per your requirements. To learn more, feel free to contact us on sales@6wresearch.com
1 Executive Summary |
2 Introduction |
2.1 Key Highlights of the Report |
2.2 Report Description |
2.3 Market Scope & Segmentation |
2.4 Research Methodology |
2.5 Assumptions |
3 Belgium Road Safety Market Overview |
3.1 Belgium Country Macro Economic Indicators |
3.2 Belgium Road Safety Market Revenues & Volume, 2022 & 2032F |
3.3 Belgium Road Safety Market - Industry Life Cycle |
3.4 Belgium Road Safety Market - Porter's Five Forces |
3.5 Belgium Road Safety Market Revenues & Volume Share, By Solutions, 2022 & 2032F |
3.6 Belgium Road Safety Market Revenues & Volume Share, By Service, 2022 & 2032F |
4 Belgium Road Safety Market Dynamics |
4.1 Impact Analysis |
4.2 Market Drivers |
4.2.1 Increasing government initiatives to improve road safety |
4.2.2 Growing awareness among the population about the importance of road safety |
4.2.3 Technological advancements in road safety solutions |
4.3 Market Restraints |
4.3.1 High initial costs associated with implementing advanced road safety measures |
4.3.2 Resistance to change from traditional road safety practices |
4.3.3 Limited funding for road safety projects |
5 Belgium Road Safety Market Trends |
6 Belgium Road Safety Market Segmentations |
6.1 Belgium Road Safety Market, By Solutions |
6.1.1 Overview and Analysis |
6.1.2 Belgium Road Safety Market Revenues & Volume, By Red Light, 2022 - 2032F |
6.1.3 Belgium Road Safety Market Revenues & Volume, By Speed, 2022 - 2032F |
6.1.4 Belgium Road Safety Market Revenues & Volume, By Bus Lane, 2022 - 2032F |
6.1.5 Belgium Road Safety Market Revenues & Volume, By Section Enforcement, 2022 - 2032F |
6.1.6 Belgium Road Safety Market Revenues & Volume, By ALPR/ANPR, 2022 - 2032F |
6.2 Belgium Road Safety Market, By Service |
6.2.1 Overview and Analysis |
6.2.2 Belgium Road Safety Market Revenues & Volume, By Consulting and Training, 2022 - 2032F |
6.2.3 Belgium Road Safety Market Revenues & Volume, By System Integration and Deployment, 2022 - 2032F |
6.2.4 Belgium Road Safety Market Revenues & Volume, By Support and Maintenance, 2022 - 2032F |
7 Belgium Road Safety Market Import-Export Trade Statistics |
7.1 Belgium Road Safety Market Export to Major Countries |
7.2 Belgium Road Safety Market Imports from Major Countries |
8 Belgium Road Safety Market Key Performance Indicators |
8.1 Number of road accidents and fatalities |
8.2 Percentage of road infrastructure equipped with advanced safety features |
8.3 Level of public awareness campaigns conducted by government and organizations |
8.4 Adoption rate of new road safety technologies |
8.5 Compliance rate with road safety regulations and standards |
9 Belgium Road Safety Market - Opportunity Assessment |
9.1 Belgium Road Safety Market Opportunity Assessment, By Solutions, 2022 & 2032F |
9.2 Belgium Road Safety Market Opportunity Assessment, By Service, 2022 & 2032F |
10 Belgium Road Safety Market - Competitive Landscape |
10.1 Belgium Road Safety Market Revenue Share, By Companies, 2025 |
10.2 Belgium Road Safety Market Competitive Benchmarking, By Operating and Technical Parameters |
11 Company Profiles |
12 Recommendations | 13 Disclaimer |
Global Go To Market Strategy - 2030
Export potential enables firms to identify high-growth global markets with greater confidence by combining advanced trade intelligence with a structured quantitative methodology. The framework analyzes emerging demand trends and country-level import patterns while integrating macroeconomic and trade datasets such as GDP and population forecasts, bilateral import–export flows, tariff structures, elasticity differentials between developed and developing economies, geographic distance, and import demand projections. Using weighted trade values from 2020–2024 as the base period to project country-to-country export potential for 2030, these inputs are operationalized through calculated drivers such as gravity model parameters, tariff impact factors, and projected GDP per-capita growth. Through an analysis of hidden potentials, demand hotspots, and market conditions that are most favorable to success, this method enables firms to focus on target countries, maximize returns, and global expansion with data, backed by accuracy.
By factoring in the projected importer demand gap that is currently unmet and could be potential opportunity, it identifies the potential for the Exporter (Country) among 190 countries, against the general trade analysis, which identifies the biggest importer or exporter.
To discover high-growth global markets and optimize your business strategy:
Click Here
Pricing
- Single User License$ 1,995
- Department License$ 2,400
- Site License$ 3,120
- Global License$ 3,795

Leadership Perspectives from Industry Events
Search
Thought Leadership and Analyst Meet


Our Clients
6WResearch In News
- India Export Attractiveness Tracker 2026
- India Air Conditioner Market Set for Strong Rebound in 2026 After Weather-Led Correction and GST-Driven Recovery: 6Wresearch
- ADAS in India: How Automatic Emergency Braking, Blind Spot Detection & Driver Monitoring are Transforming Road Safety
- Doha a strategic location for EV manufacturing hub: IPA Qatar
- Demand for luxury TVs surging in the GCC, says Samsung
- Empowering Growth: The Thriving Journey of Bangladesh’s Cable Industry
Latest Reports
- Nicaragua RPG Gaming Market (2026-2032)
- New Zealand RPG Gaming Market (2026-2032)
- Netherlands RPG Gaming Market (2026-2032)
- Nauru RPG Gaming Market (2026-2032)
- Namibia RPG Gaming Market (2026-2032)
- Mozambique RPG Gaming Market (2026-2032)
- Montenegro RPG Gaming Market (2026-2032)
- Mongolia RPG Gaming Market (2026-2032)
- Monaco RPG Gaming Market (2026-2032)
- Micronesia RPG Gaming Market (2026-2032)
Industry Events and Analyst Meet

EV India Expo 2026

HIMTEX 2026

India Refining Summit 2026

India EV Show 2026

EV tech India Expo 2026
Whitepaper
- Middle East & Africa Commercial Security Market Click here to view more.
- Middle East & Africa Fire Safety Systems & Equipment Market Click here to view more.
- GCC Drone Market Click here to view more.
- Middle East Lighting Fixture Market Click here to view more.
- GCC Physical & Perimeter Security Market Click here to view more.