Belgium Winch Market (2026-2032) | Share, Outlook, Industry, Value, Companies, Size & Revenue, Trends, Growth, Forecast, Segmentation, Competitive Landscape, Analysis
Market Forecast By Type (Manual, Pneumatic, Electric, Hydraulic), By Application (Onshore, Offshore) And Competitive Landscape
| Product Code: ETC6367348 | Publication Date: Sep 2024 | Updated Date: Apr 2026 | Product Type: Market Research Report | |
| Publisher: 6Wresearch | Author: Sumit Sagar | No. of Pages: 75 | No. of Figures: 35 | No. of Tables: 20 |
Belgium Winch Market Size (2020-2030)
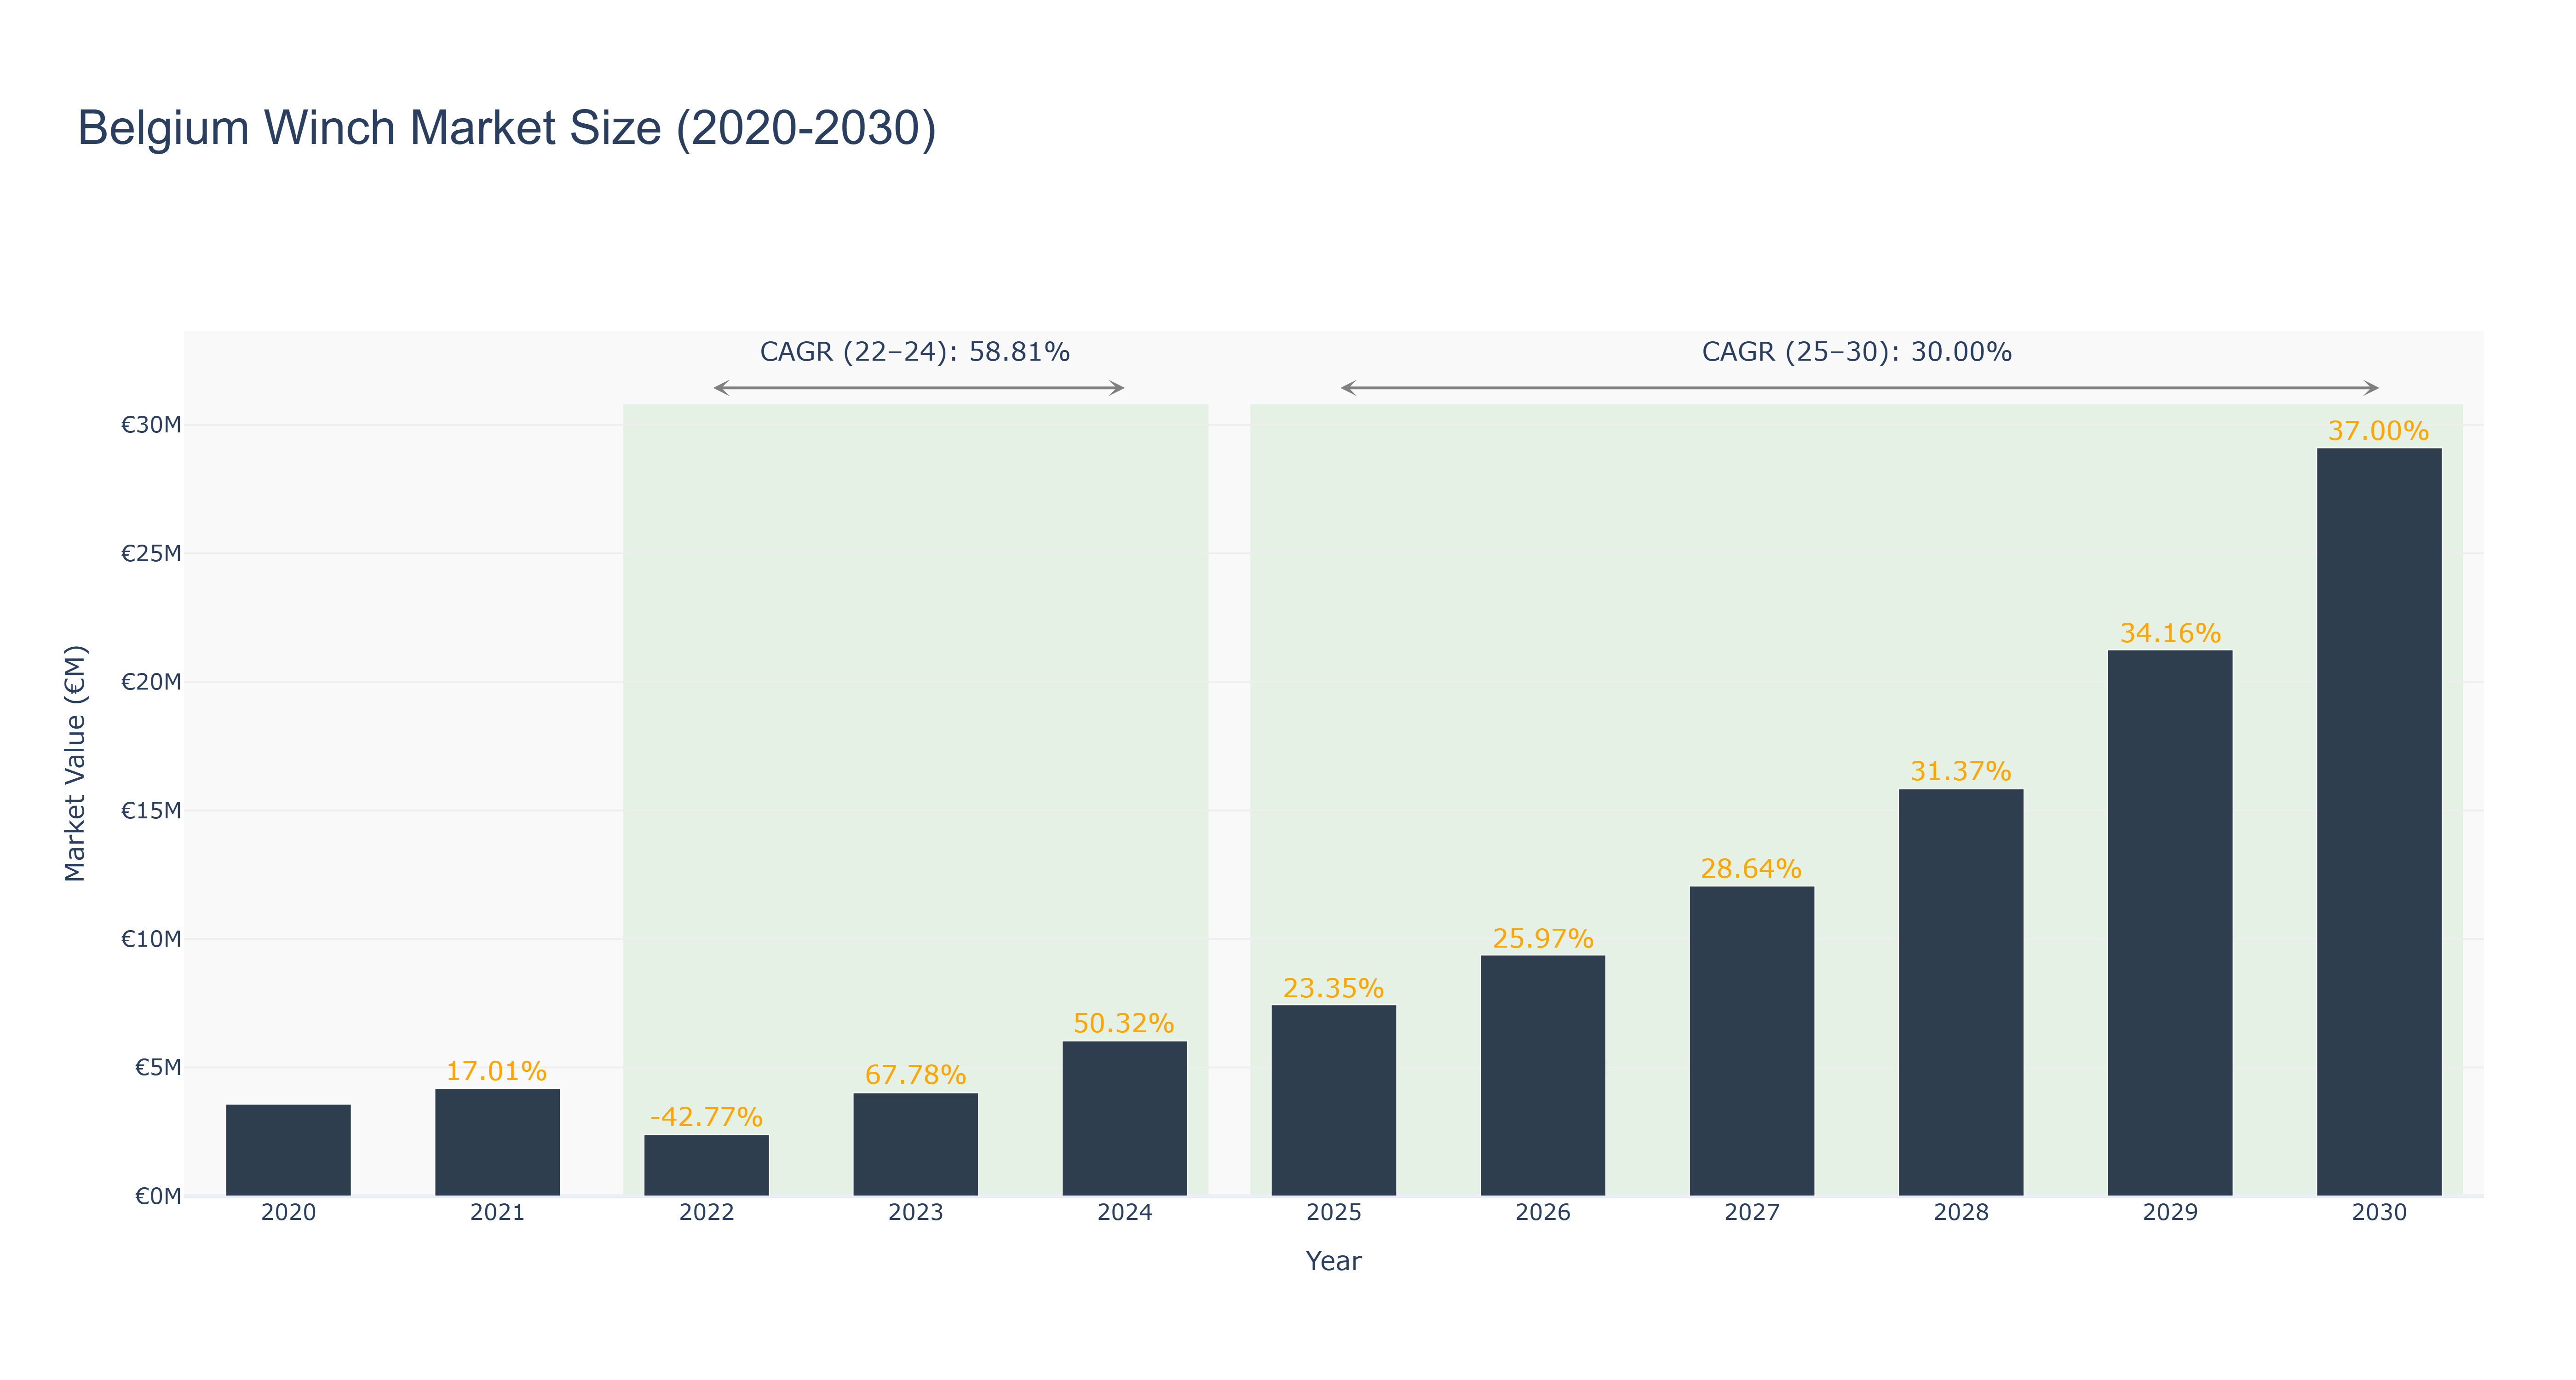
Belgium Winch Market has shown a notable growth trajectory over the years. The market size peaked at €29.11 million in 2030, with a consistent upward trend from 2020 to 2030. Notably, the market experienced a significant decline in 2022 due to a sharp drop in market size to €2.39 million, attributed to external economic factors impacting demand. However, the market rebounded swiftly, driven by increased adoption and technological advancements, resulting in a robust compound annual growth rate (CAGR) of 58.81% from 2022 to 2024. Moving forward, the market is forecasted to maintain a steady growth pace with a CAGR of 30.0% from 2025 to 2030, driven by expanding industrial applications and infrastructure development projects in Belgium. The ongoing investments in renewable energy projects are expected to further boost the demand for winch systems in the country.
Belgium Winch Market: Production & Trade Performance (2019-2025)
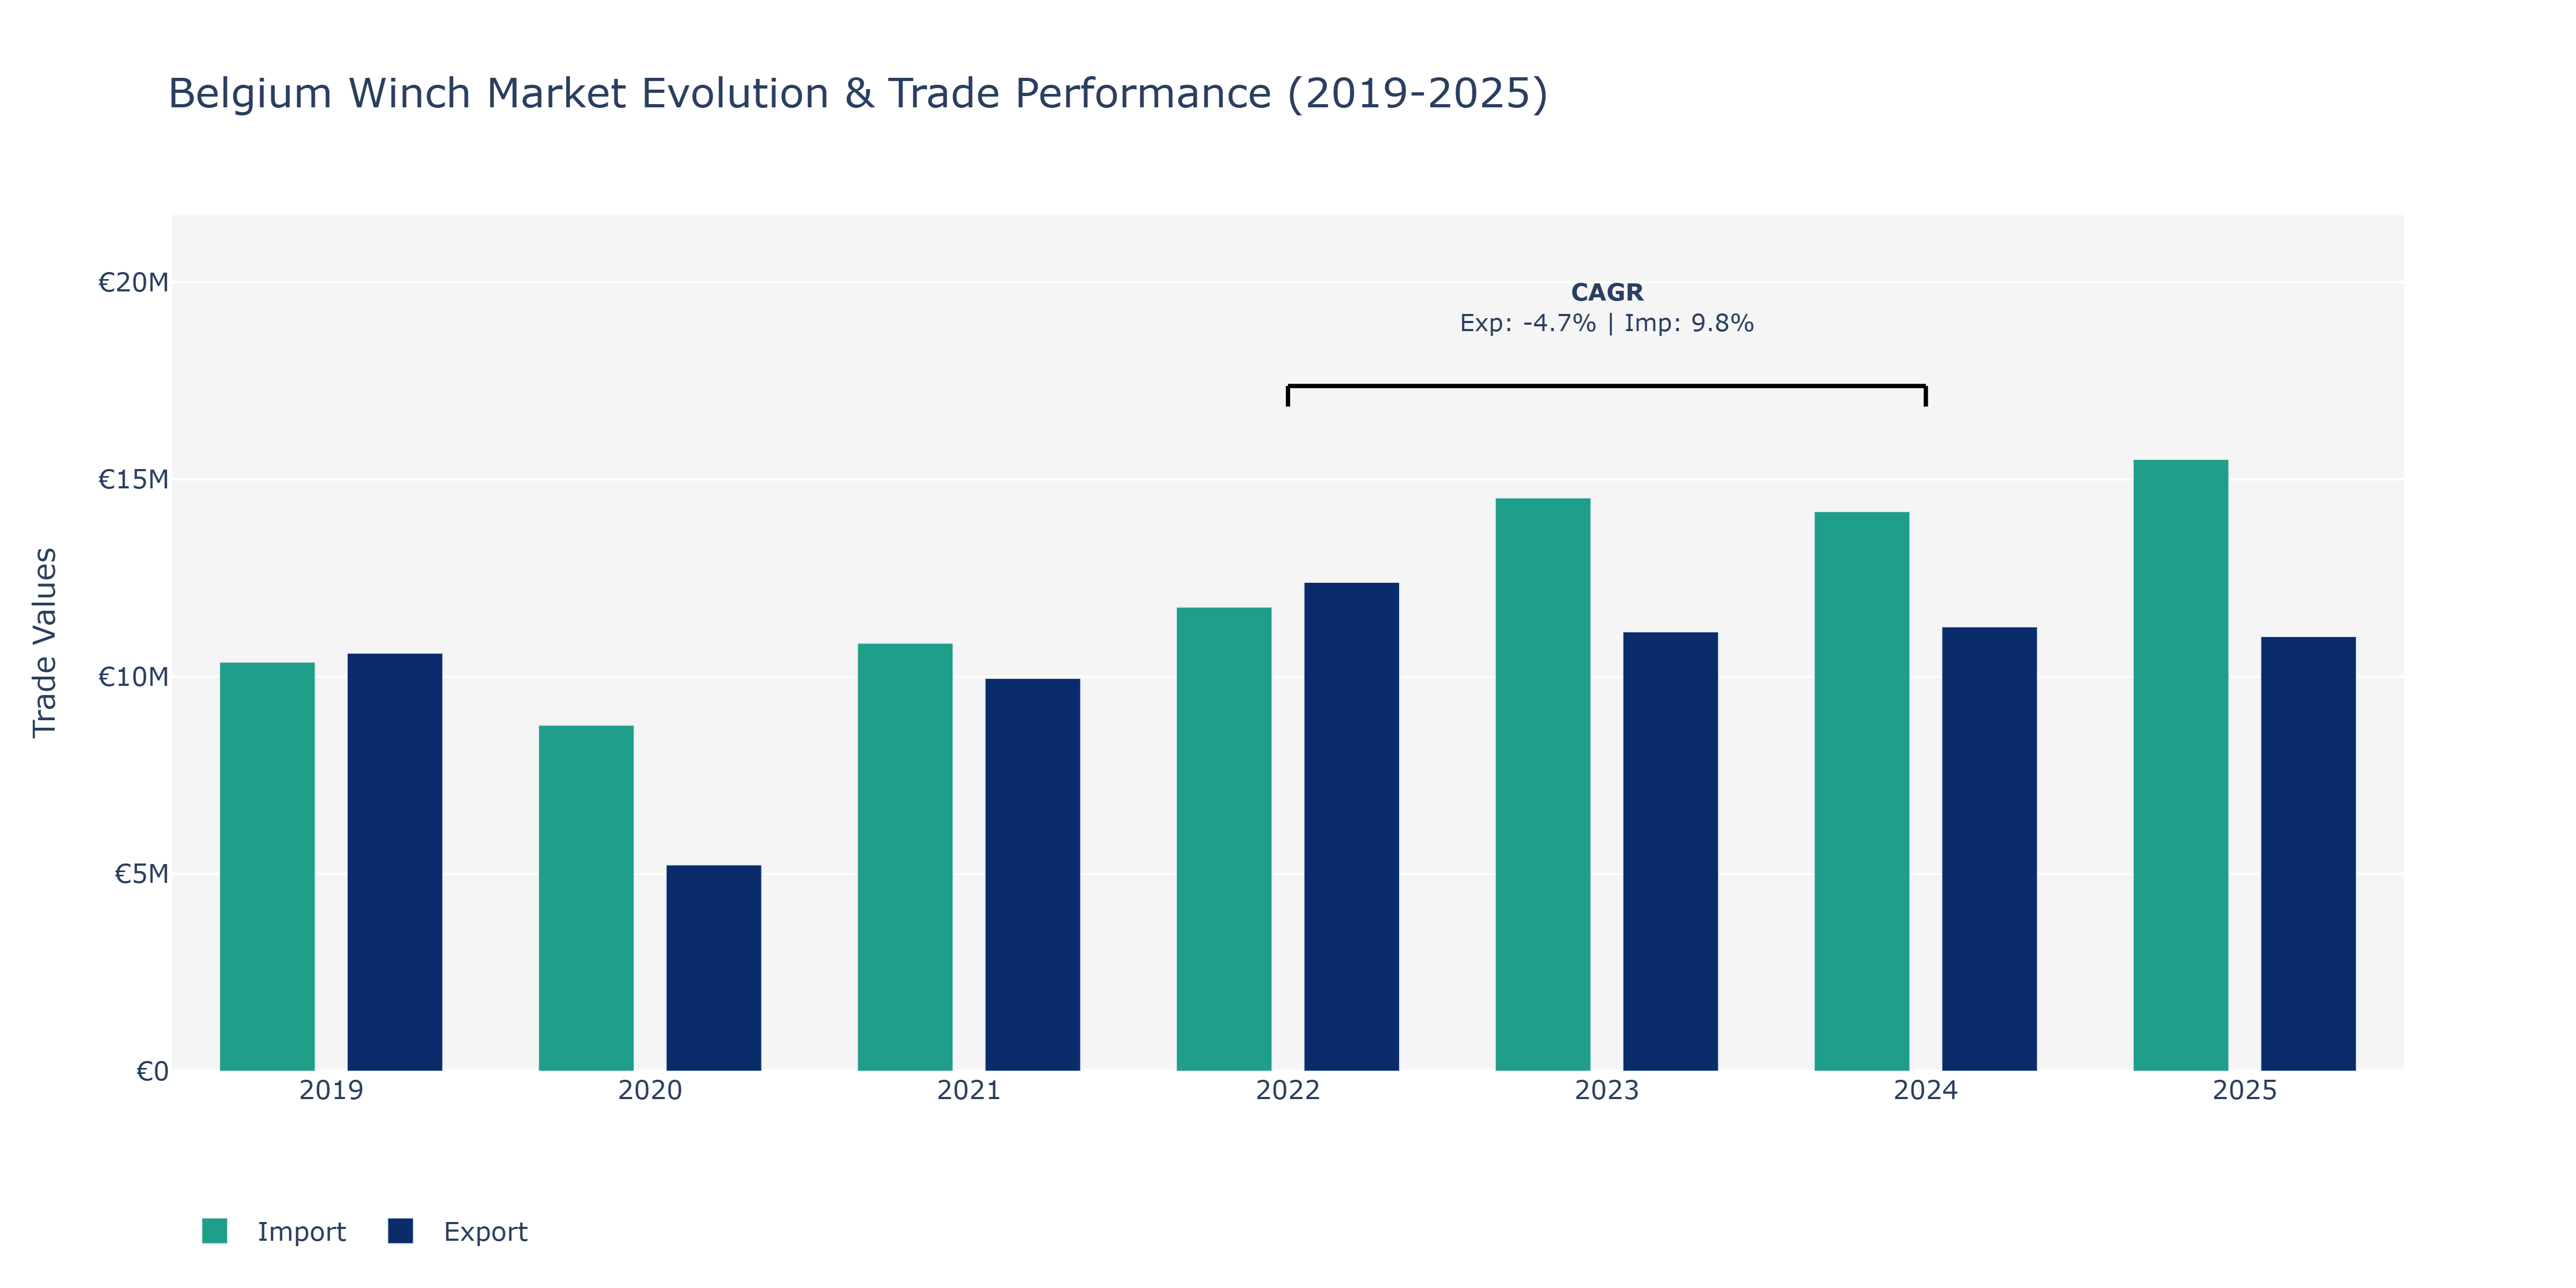
The Belgium Winch Market exhibited fluctuations in both exports and imports over the years provided. In 2019, exports stood at €10.6 million, decreasing substantially in 2020 to €5.23 million before rebounding in 2021 to €9.96 million. The market experienced a peak in 2022 with exports reaching €12.4 million but declined slightly in the following years. On the other hand, imports followed a different trend, increasing steadily from €10.37 million in 2019 to €15.51 million in 2025. The peak point for imports was observed in 2025. These fluctuations in exports and imports can be attributed to various factors such as changes in global demand, economic conditions, and trade policies affecting the machinery industry in Belgium. The increasing imports could signify a growing demand for winch-related products in the country, potentially driven by infrastructure projects or industrial activities. To capitalize on this upward trend in imports, local winch manufacturers may need to focus on enhancing their competitive advantage through technological innovation and cost-effective production methods.
Key Highlights of the Report:
- Belgium Winch Market Outlook
- Market Size of Belgium Winch Market, 2025
- Forecast of Belgium Winch Market, 2032
- Historical Data and Forecast of Belgium Winch Revenues & Volume for the Period 2022 - 2032
- Belgium Winch Market Trend Evolution
- Belgium Winch Market Drivers and Challenges
- Belgium Winch Price Trends
- Belgium Winch Porter's Five Forces
- Belgium Winch Industry Life Cycle
- Historical Data and Forecast of Belgium Winch Market Revenues & Volume By Type for the Period 2022 - 2032
- Historical Data and Forecast of Belgium Winch Market Revenues & Volume By Manual for the Period 2022 - 2032
- Historical Data and Forecast of Belgium Winch Market Revenues & Volume By Pneumatic for the Period 2022 - 2032
- Historical Data and Forecast of Belgium Winch Market Revenues & Volume By Electric for the Period 2022 - 2032
- Historical Data and Forecast of Belgium Winch Market Revenues & Volume By Hydraulic for the Period 2022 - 2032
- Historical Data and Forecast of Belgium Winch Market Revenues & Volume By Application for the Period 2022 - 2032
- Historical Data and Forecast of Belgium Winch Market Revenues & Volume By Onshore for the Period 2022 - 2032
- Historical Data and Forecast of Belgium Winch Market Revenues & Volume By Offshore for the Period 2022 - 2032
- Belgium Winch Import Export Trade Statistics
- Market Opportunity Assessment By Type
- Market Opportunity Assessment By Application
- Belgium Winch Top Companies Market Share
- Belgium Winch Competitive Benchmarking By Technical and Operational Parameters
- Belgium Winch Company Profiles
- Belgium Winch Key Strategic Recommendations
Frequently Asked Questions About the Market Study (FAQs):
6Wresearch actively monitors the Belgium Winch Market and publishes its comprehensive annual report, highlighting emerging trends, growth drivers, revenue analysis, and forecast outlook. Our insights help businesses to make data-backed strategic decisions with ongoing market dynamics. Our analysts track relevent industries related to the Belgium Winch Market, allowing our clients with actionable intelligence and reliable forecasts tailored to emerging regional needs.
Yes, we provide customisation as per your requirements. To learn more, feel free to contact us on sales@6wresearch.com
1 Executive Summary |
2 Introduction |
2.1 Key Highlights of the Report |
2.2 Report Description |
2.3 Market Scope & Segmentation |
2.4 Research Methodology |
2.5 Assumptions |
3 Belgium Winch Market Overview |
3.1 Belgium Country Macro Economic Indicators |
3.2 Belgium Winch Market Revenues & Volume, 2022 & 2032F |
3.3 Belgium Winch Market - Industry Life Cycle |
3.4 Belgium Winch Market - Porter's Five Forces |
3.5 Belgium Winch Market Revenues & Volume Share, By Type, 2022 & 2032F |
3.6 Belgium Winch Market Revenues & Volume Share, By Application, 2022 & 2032F |
4 Belgium Winch Market Dynamics |
4.1 Impact Analysis |
4.2 Market Drivers |
4.2.1 Increasing demand for winches in industries such as construction, mining, and marine sectors. |
4.2.2 Technological advancements leading to the development of more efficient and durable winch products. |
4.2.3 Growing investments in infrastructure projects driving the need for winches in Belgium. |
4.3 Market Restraints |
4.3.1 Fluctuating raw material prices impacting production costs of winches. |
4.3.2 Competitive market landscape leading to pricing pressures for winch manufacturers. |
4.3.3 Regulatory challenges related to environmental and safety standards affecting the manufacturing processes. |
5 Belgium Winch Market Trends |
6 Belgium Winch Market, By Types |
6.1 Belgium Winch Market, By Type |
6.1.1 Overview and Analysis |
6.1.2 Belgium Winch Market Revenues & Volume, By Type, 2022 - 2032F |
6.1.3 Belgium Winch Market Revenues & Volume, By Manual, 2022 - 2032F |
6.1.4 Belgium Winch Market Revenues & Volume, By Pneumatic, 2022 - 2032F |
6.1.5 Belgium Winch Market Revenues & Volume, By Electric, 2022 - 2032F |
6.1.6 Belgium Winch Market Revenues & Volume, By Hydraulic, 2022 - 2032F |
6.2 Belgium Winch Market, By Application |
6.2.1 Overview and Analysis |
6.2.2 Belgium Winch Market Revenues & Volume, By Onshore, 2022 - 2032F |
6.2.3 Belgium Winch Market Revenues & Volume, By Offshore, 2022 - 2032F |
7 Belgium Winch Market Import-Export Trade Statistics |
7.1 Belgium Winch Market Export to Major Countries |
7.2 Belgium Winch Market Imports from Major Countries |
8 Belgium Winch Market Key Performance Indicators |
8.1 Percentage of winch sales attributed to new industries or applications. |
8.2 Rate of adoption of advanced winch technologies in the market. |
8.3 Number of infrastructure projects in Belgium utilizing winch systems for operations. |
9 Belgium Winch Market - Opportunity Assessment |
9.1 Belgium Winch Market Opportunity Assessment, By Type, 2022 & 2032F |
9.2 Belgium Winch Market Opportunity Assessment, By Application, 2022 & 2032F |
10 Belgium Winch Market - Competitive Landscape |
10.1 Belgium Winch Market Revenue Share, By Companies, 2025 |
10.2 Belgium Winch Market Competitive Benchmarking, By Operating and Technical Parameters |
11 Company Profiles |
12 Recommendations |
13 Disclaimer |
Export potential assessment - trade Analytics for 2030
Export potential enables firms to identify high-growth global markets with greater confidence by combining advanced trade intelligence with a structured quantitative methodology. The framework analyzes emerging demand trends and country-level import patterns while integrating macroeconomic and trade datasets such as GDP and population forecasts, bilateral import–export flows, tariff structures, elasticity differentials between developed and developing economies, geographic distance, and import demand projections. Using weighted trade values from 2020–2024 as the base period to project country-to-country export potential for 2030, these inputs are operationalized through calculated drivers such as gravity model parameters, tariff impact factors, and projected GDP per-capita growth. Through an analysis of hidden potentials, demand hotspots, and market conditions that are most favorable to success, this method enables firms to focus on target countries, maximize returns, and global expansion with data, backed by accuracy.
By factoring in the projected importer demand gap that is currently unmet and could be potential opportunity, it identifies the potential for the Exporter (Country) among 190 countries, against the general trade analysis, which identifies the biggest importer or exporter.
To discover high-growth global markets and optimize your business strategy:
Click Here
Pricing
- Single User License$ 1,995
- Department License$ 2,400
- Site License$ 3,120
- Global License$ 3,795

Search
Thought Leadership and Analyst Meet


Our Clients
Latest Reports
- Philippines Polyhydroxybutyrate-co-Hydroxyvalerate Market (2026-2032) | Trends, Insights, Challenges, Restraints, Competition, Size, Value, Forecast, Pricing, Share, Outlook, Revenue, Investment Opportunities, Strategy, Drivers, Demand, Growth, segmentation, Analysis, Companies
- Peru Polyhydroxybutyrate-co-Hydroxyvalerate Market (2026-2032) | Growth, Demand, Challenges, Share, Trends, Analysis, Pricing, Investment Opportunities, Drivers, Value, Forecast, Competition, Size, Companies, Insights, Outlook, Restraints, segmentation, Revenue, Strategy
- Pakistan Polyhydroxybutyrate-co-Hydroxyvalerate Market (2026-2032) | Restraints, segmentation, Pricing, Forecast, Share, Strategy, Competition, Trends, Insights, Drivers, Challenges, Growth, Revenue, Outlook, Value, Investment Opportunities, Companies, Size, Analysis, Demand
- Oman Polyhydroxybutyrate-co-Hydroxyvalerate Market (2026-2032) | Drivers, segmentation, Insights, Competition, Pricing, Outlook, Size, Revenue, Challenges, Forecast, Analysis, Growth, Value, Share, Trends, Investment Opportunities, Strategy, Restraints, Companies, Demand
- Nigeria Polyhydroxybutyrate-co-Hydroxyvalerate Market (2026-2032) | Value, Investment Opportunities, Analysis, Revenue, Restraints, Pricing, Outlook, Competition, Demand, Growth, Forecast, Companies, Trends, Challenges, segmentation, Drivers, Insights, Share, Size, Strategy
- Nepal Polyhydroxybutyrate-co-Hydroxyvalerate Market (2026-2032) | Insights, Analysis, Drivers, Share, Revenue, Demand, segmentation, Investment Opportunities, Competition, Forecast, Growth, Pricing, Companies, Strategy, Trends, Restraints, Challenges, Outlook, Size, Value
- Myanmar Polyhydroxybutyrate-co-Hydroxyvalerate Market (2026-2032) | Outlook, Revenue, Strategy, Restraints, Drivers, segmentation, Share, Forecast, Competition, Insights, Growth, Pricing, Size, Demand, Value, Companies, Trends, Challenges, Investment Opportunities, Analysis
- Morocco Polyhydroxybutyrate-co-Hydroxyvalerate Market (2026-2032) | Outlook, Investment Opportunities, Restraints, Strategy, Forecast, Challenges, Drivers, Growth, Companies, segmentation, Trends, Size, Competition, Revenue, Demand, Insights, Share, Analysis, Value, Pricing
- Mexico Polyhydroxybutyrate-co-Hydroxyvalerate Market (2026-2032) | Size, Drivers, Outlook, Share, Strategy, Growth, Pricing, Challenges, Companies, Demand, Value, Investment Opportunities, Restraints, Trends, Forecast, segmentation, Analysis, Insights, Competition, Revenue
- Malaysia Polyhydroxybutyrate-co-Hydroxyvalerate Market (2026-2032) | Share, segmentation, Size, Companies, Analysis, Insights, Forecast, Value, Revenue, Drivers, Restraints, Challenges, Investment Opportunities, Trends, Competition, Strategy, Demand, Growth, Outlook, Pricing
Industry Events and Analyst Meet

HIMTEX 2026

India Refining Summit 2026

India EV Show 2026

EV tech India Expo 2026

Auto Tech Asia 2026
Whitepaper
- Middle East & Africa Commercial Security Market Click here to view more.
- Middle East & Africa Fire Safety Systems & Equipment Market Click here to view more.
- GCC Drone Market Click here to view more.
- Middle East Lighting Fixture Market Click here to view more.
- GCC Physical & Perimeter Security Market Click here to view more.
6WResearch In News
- Doha a strategic location for EV manufacturing hub: IPA Qatar
- Demand for luxury TVs surging in the GCC, says Samsung
- Empowering Growth: The Thriving Journey of Bangladesh’s Cable Industry
- Demand for luxury TVs surging in the GCC, says Samsung
- Video call with a traditional healer? Once unthinkable, it’s now common in South Africa
- Intelligent Buildings To Smooth GCC’s Path To Net Zero