Benin Smart Cards Market (2026-2032) | Forecast, Outlook, Segments, Segmentation, Opportunities, Trends, Restraints, Strategic Insights, Competitive, Size, Consumer Insights, Pricing Analysis, Value, Investment Trends, Analysis, Share, Supply, Growth, Challenges, Industry, Drivers, Revenue, Demand, Companies, Strategy, Competition
Market Forecast By Card Type (Contactless Smart Cards, Hybrid Smart Cards, Crypto Smart Cards, SIM Smart Cards, Banking Smart Cards), By Security Technology (Biometric Authentication, Two-Factor Authentication, Tokenization, Dynamic Passwords, End-to-End Encryption), By Application (Payment Processing, Identification, Digital Access Control, Telecommunications, Public Transport), By Data Storage (Encrypted Data Chips, NFC & RFID Enabled, Secure Memory Chips, Embedded Microcontrollers, Multi-Layer Security), By Industry Adoption (Banking & Finance, Healthcare & Insurance, Government & Defense, Telecom & IT, Retail & E-Commerce) And Competitive Landscape
| Product Code: ETC10819140 | Publication Date: Apr 2025 | Updated Date: Feb 2026 | Product Type: Market Research Report | |
| Publisher: 6Wresearch | No. of Pages: 65 | No. of Figures: 34 | No. of Tables: 19 | |
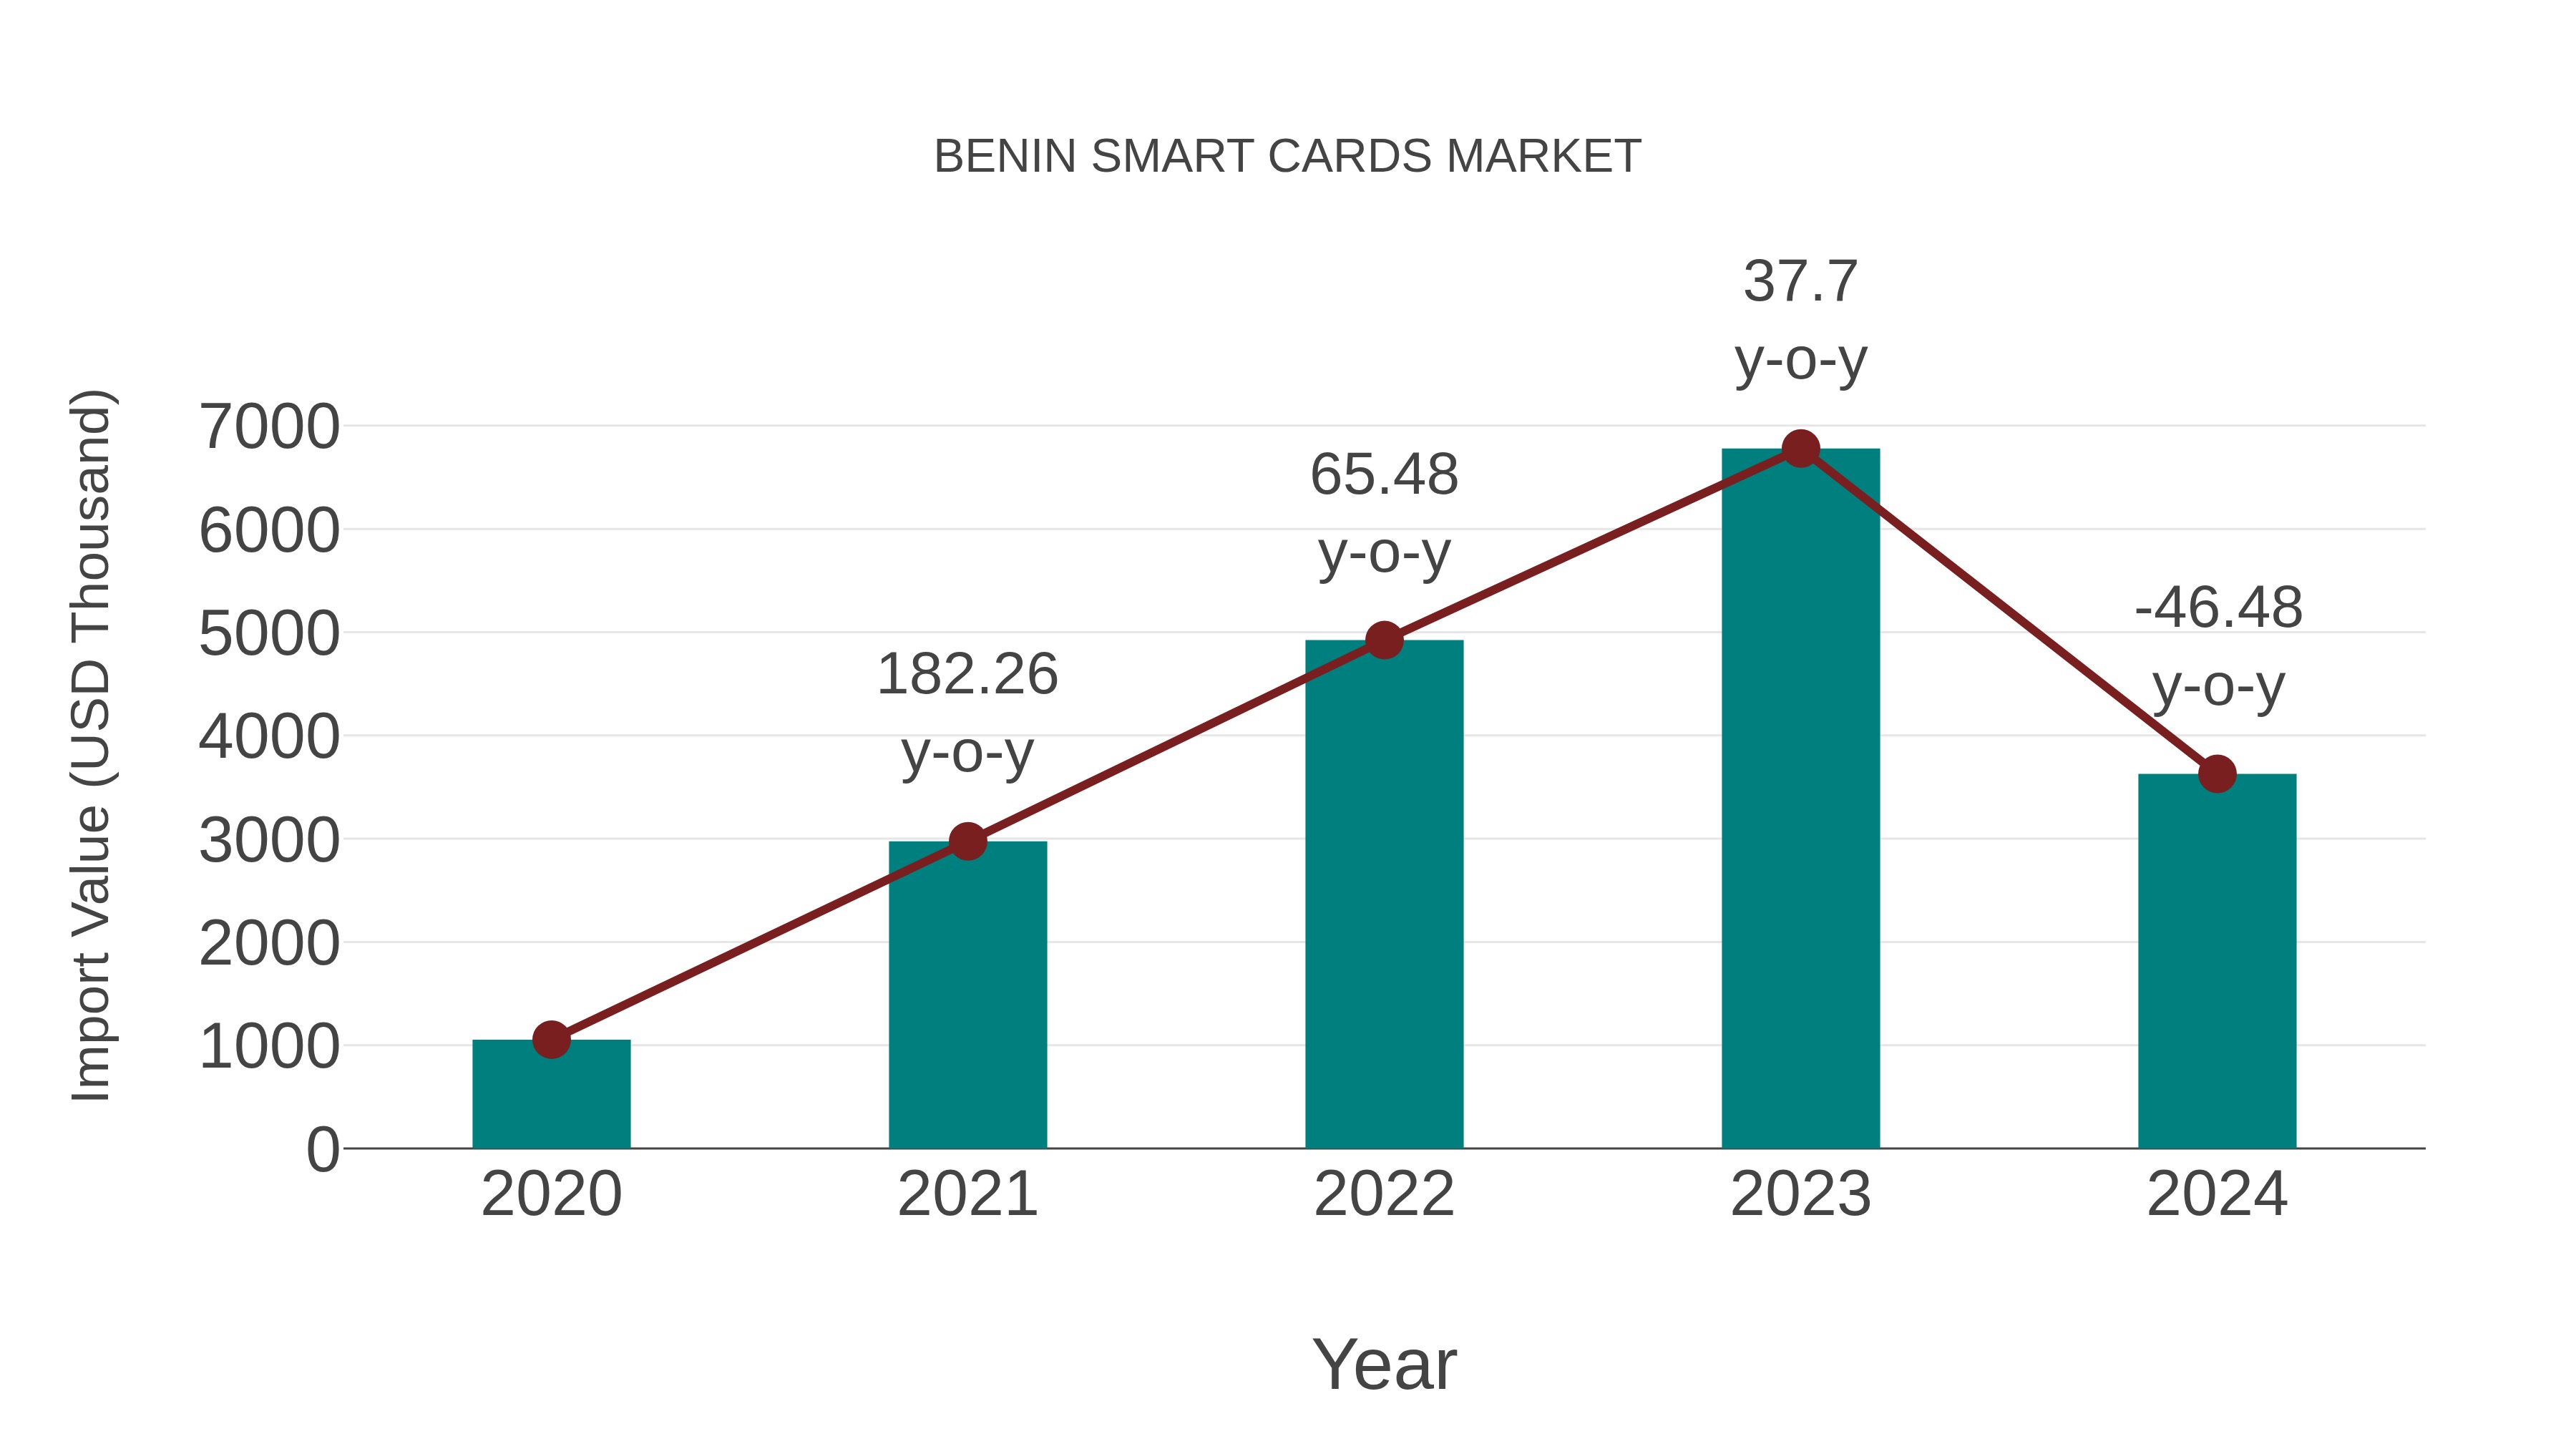
Benin Smart Cards Market: Import Trend Analysis
The Benin smart cards market experienced a significant increase in imports from 2020 to 2024, with a Compound Annual Growth Rate (CAGR) of 36.21%. Despite a year-on-year growth rate of -46.48% in 20232024, the overall trend indicated a notable rise in imports during the specified period.
Key Highlights of the Report:
- Benin Smart Cards Market Outlook
- Market Size of Benin Smart Cards Market, 2025
- Forecast of Benin Smart Cards Market, 2032
- Historical Data and Forecast of Benin Smart Cards Revenues & Volume for the Period 2022-2032F
- Benin Smart Cards Market Trend Evolution
- Benin Smart Cards Market Drivers and Challenges
- Benin Smart Cards Price Trends
- Benin Smart Cards Porter's Five Forces
- Benin Smart Cards Industry Life Cycle
- Historical Data and Forecast of Benin Smart Cards Market Revenues & Volume By Card Type for the Period 2022-2032F
- Historical Data and Forecast of Benin Smart Cards Market Revenues & Volume By Contactless Smart Cards for the Period 2022-2032F
- Historical Data and Forecast of Benin Smart Cards Market Revenues & Volume By Hybrid Smart Cards for the Period 2022-2032F
- Historical Data and Forecast of Benin Smart Cards Market Revenues & Volume By Crypto Smart Cards for the Period 2022-2032F
- Historical Data and Forecast of Benin Smart Cards Market Revenues & Volume By SIM Smart Cards for the Period 2022-2032F
- Historical Data and Forecast of Benin Smart Cards Market Revenues & Volume By Banking Smart Cards for the Period 2022 - 2032F
- Historical Data and Forecast of Benin Smart Cards Market Revenues & Volume By Security Technology for the Period 2022-2032F
- Historical Data and Forecast of Benin Smart Cards Market Revenues & Volume By Biometric Authentication for the Period 2022-2032F
- Historical Data and Forecast of Benin Smart Cards Market Revenues & Volume By Two-Factor Authentication for the Period 2022-2032F
- Historical Data and Forecast of Benin Smart Cards Market Revenues & Volume By Tokenization for the Period 2022-2032F
- Historical Data and Forecast of Benin Smart Cards Market Revenues & Volume By Dynamic Passwords for the Period 2022-2032F
- Historical Data and Forecast of Benin Smart Cards Market Revenues & Volume By End-to-End Encryption for the Period 2022 - 2032F
- Historical Data and Forecast of Benin Smart Cards Market Revenues & Volume By Application for the Period 2022-2032F
- Historical Data and Forecast of Benin Smart Cards Market Revenues & Volume By Payment Processing for the Period 2022-2032F
- Historical Data and Forecast of Benin Smart Cards Market Revenues & Volume By Identification for the Period 2022-2032F
- Historical Data and Forecast of Benin Smart Cards Market Revenues & Volume By Digital Access Control for the Period 2022-2032F
- Historical Data and Forecast of Benin Smart Cards Market Revenues & Volume By Telecommunications for the Period 2022-2032F
- Historical Data and Forecast of Benin Smart Cards Market Revenues & Volume By Public Transport for the Period 2022 - 2032F
- Historical Data and Forecast of Benin Smart Cards Market Revenues & Volume By Data Storage for the Period 2022-2032F
- Historical Data and Forecast of Benin Smart Cards Market Revenues & Volume By Encrypted Data Chips for the Period 2022-2032F
- Historical Data and Forecast of Benin Smart Cards Market Revenues & Volume By NFC & RFID Enabled for the Period 2022-2032F
- Historical Data and Forecast of Benin Smart Cards Market Revenues & Volume By Secure Memory Chips for the Period 2022-2032F
- Historical Data and Forecast of Benin Smart Cards Market Revenues & Volume By Embedded Microcontrollers for the Period 2022-2032F
- Historical Data and Forecast of Benin Smart Cards Market Revenues & Volume By Multi-Layer Security for the Period 2022 - 2032F
- Historical Data and Forecast of Benin Smart Cards Market Revenues & Volume By Industry Adoption for the Period 2022-2032F
- Historical Data and Forecast of Benin Smart Cards Market Revenues & Volume By Banking & Finance for the Period 2022-2032F
- Historical Data and Forecast of Benin Smart Cards Market Revenues & Volume By Healthcare & Insurance for the Period 2022-2032F
- Historical Data and Forecast of Benin Smart Cards Market Revenues & Volume By Government & Defense for the Period 2022-2032F
- Historical Data and Forecast of Benin Smart Cards Market Revenues & Volume By Telecom & IT for the Period 2022 - 2032F
- Historical Data and Forecast of Benin Smart Cards Market Revenues & Volume By Retail & E-Commerce for the Period 2022 - 2032F
- Benin Smart Cards Import Export Trade Statistics
- Market Opportunity Assessment By Card Type
- Market Opportunity Assessment By Security Technology
- Market Opportunity Assessment By Application
- Market Opportunity Assessment By Data Storage
- Market Opportunity Assessment By Industry Adoption
- Benin Smart Cards Top Companies Market Share
- Benin Smart Cards Competitive Benchmarking By Technical and Operational Parameters
- Benin Smart Cards Company Profiles
- Benin Smart Cards Key Strategic Recommendations
Frequently Asked Questions About the Market Study (FAQs):
6Wresearch actively monitors the Benin Smart Cards Market and publishes its comprehensive annual report, highlighting emerging trends, growth drivers, revenue analysis, and forecast outlook. Our insights help businesses to make data-backed strategic decisions with ongoing market dynamics. Our analysts track relevent industries related to the Benin Smart Cards Market, allowing our clients with actionable intelligence and reliable forecasts tailored to emerging regional needs.
Yes, we provide customisation as per your requirements. To learn more, feel free to contact us on sales@6wresearch.com
1 Executive Summary |
2 Introduction |
2.1 Key Highlights of the Report |
2.2 Report Description |
2.3 Market Scope & Segmentation |
2.4 Research Methodology |
2.5 Assumptions |
3 Benin Smart Cards Market Overview |
3.1 Benin Country Macro Economic Indicators |
3.2 Benin Smart Cards Market Revenues & Volume, 2022 & 2032F |
3.3 Benin Smart Cards Market - Industry Life Cycle |
3.4 Benin Smart Cards Market - Porter's Five Forces |
3.5 Benin Smart Cards Market Revenues & Volume Share, By Card Type, 2022 & 2032F |
3.6 Benin Smart Cards Market Revenues & Volume Share, By Security Technology, 2022 & 2032F |
3.7 Benin Smart Cards Market Revenues & Volume Share, By Application, 2022 & 2032F |
3.8 Benin Smart Cards Market Revenues & Volume Share, By Data Storage, 2022 & 2032F |
3.9 Benin Smart Cards Market Revenues & Volume Share, By Industry Adoption, 2022 & 2032F |
4 Benin Smart Cards Market Dynamics |
4.1 Impact Analysis |
4.2 Market Drivers |
4.2.1 Increasing adoption of digital payment solutions in Benin |
4.2.2 Growing demand for secure identification and authentication solutions |
4.2.3 Government initiatives promoting digitization and e-governance |
4.3 Market Restraints |
4.3.1 Lack of awareness and understanding about smart card technology in Benin |
4.3.2 High initial investment costs for implementing smart card solutions |
4.3.3 Security concerns related to data privacy and identity theft |
5 Benin Smart Cards Market Trends |
6 Benin Smart Cards Market, By Types |
6.1 Benin Smart Cards Market, By Card Type |
6.1.1 Overview and Analysis |
6.1.2 Benin Smart Cards Market Revenues & Volume, By Card Type, 2022 - 2032F |
6.1.3 Benin Smart Cards Market Revenues & Volume, By Contactless Smart Cards, 2022 - 2032F |
6.1.4 Benin Smart Cards Market Revenues & Volume, By Hybrid Smart Cards, 2022 - 2032F |
6.1.5 Benin Smart Cards Market Revenues & Volume, By Crypto Smart Cards, 2022 - 2032F |
6.1.6 Benin Smart Cards Market Revenues & Volume, By SIM Smart Cards, 2022 - 2032F |
6.1.7 Benin Smart Cards Market Revenues & Volume, By Banking Smart Cards, 2022 - 2032F |
6.2 Benin Smart Cards Market, By Security Technology |
6.2.1 Overview and Analysis |
6.2.2 Benin Smart Cards Market Revenues & Volume, By Biometric Authentication, 2022 - 2032F |
6.2.3 Benin Smart Cards Market Revenues & Volume, By Two-Factor Authentication, 2022 - 2032F |
6.2.4 Benin Smart Cards Market Revenues & Volume, By Tokenization, 2022 - 2032F |
6.2.5 Benin Smart Cards Market Revenues & Volume, By Dynamic Passwords, 2022 - 2032F |
6.2.6 Benin Smart Cards Market Revenues & Volume, By End-to-End Encryption, 2022 - 2032F |
6.3 Benin Smart Cards Market, By Application |
6.3.1 Overview and Analysis |
6.3.2 Benin Smart Cards Market Revenues & Volume, By Payment Processing, 2022 - 2032F |
6.3.3 Benin Smart Cards Market Revenues & Volume, By Identification, 2022 - 2032F |
6.3.4 Benin Smart Cards Market Revenues & Volume, By Digital Access Control, 2022 - 2032F |
6.3.5 Benin Smart Cards Market Revenues & Volume, By Telecommunications, 2022 - 2032F |
6.3.6 Benin Smart Cards Market Revenues & Volume, By Public Transport, 2022 - 2032F |
6.4 Benin Smart Cards Market, By Data Storage |
6.4.1 Overview and Analysis |
6.4.2 Benin Smart Cards Market Revenues & Volume, By Encrypted Data Chips, 2022 - 2032F |
6.4.3 Benin Smart Cards Market Revenues & Volume, By NFC & RFID Enabled, 2022 - 2032F |
6.4.4 Benin Smart Cards Market Revenues & Volume, By Secure Memory Chips, 2022 - 2032F |
6.4.5 Benin Smart Cards Market Revenues & Volume, By Embedded Microcontrollers, 2022 - 2032F |
6.4.6 Benin Smart Cards Market Revenues & Volume, By Multi-Layer Security, 2022 - 2032F |
6.5 Benin Smart Cards Market, By Industry Adoption |
6.5.1 Overview and Analysis |
6.5.2 Benin Smart Cards Market Revenues & Volume, By Banking & Finance, 2022 - 2032F |
6.5.3 Benin Smart Cards Market Revenues & Volume, By Healthcare & Insurance, 2022 - 2032F |
6.5.4 Benin Smart Cards Market Revenues & Volume, By Government & Defense, 2022 - 2032F |
6.5.5 Benin Smart Cards Market Revenues & Volume, By Telecom & IT, 2022 - 2032F |
6.5.6 Benin Smart Cards Market Revenues & Volume, By Retail & E-Commerce, 2022 - 2032F |
7 Benin Smart Cards Market Import-Export Trade Statistics |
7.1 Benin Smart Cards Market Export to Major Countries |
7.2 Benin Smart Cards Market Imports from Major Countries |
8 Benin Smart Cards Market Key Performance Indicators |
8.1 Number of new partnerships between smart card manufacturers and financial institutions in Benin |
8.2 Percentage increase in the usage of smart cards for various applications such as banking, healthcare, and transportation |
8.3 Level of government investment in infrastructure supporting smart card technology adoption |
9 Benin Smart Cards Market - Opportunity Assessment |
9.1 Benin Smart Cards Market Opportunity Assessment, By Card Type, 2022 & 2032F |
9.2 Benin Smart Cards Market Opportunity Assessment, By Security Technology, 2022 & 2032F |
9.3 Benin Smart Cards Market Opportunity Assessment, By Application, 2022 & 2032F |
9.4 Benin Smart Cards Market Opportunity Assessment, By Data Storage, 2022 & 2032F |
9.5 Benin Smart Cards Market Opportunity Assessment, By Industry Adoption, 2022 & 2032F |
10 Benin Smart Cards Market - Competitive Landscape |
10.1 Benin Smart Cards Market Revenue Share, By Companies, 2025 |
10.2 Benin Smart Cards Market Competitive Benchmarking, By Operating and Technical Parameters |
11 Company Profiles |
12 Recommendations |
13 Disclaimer |
Global Go To Market Strategy - 2030
Export potential enables firms to identify high-growth global markets with greater confidence by combining advanced trade intelligence with a structured quantitative methodology. The framework analyzes emerging demand trends and country-level import patterns while integrating macroeconomic and trade datasets such as GDP and population forecasts, bilateral import–export flows, tariff structures, elasticity differentials between developed and developing economies, geographic distance, and import demand projections. Using weighted trade values from 2020–2024 as the base period to project country-to-country export potential for 2030, these inputs are operationalized through calculated drivers such as gravity model parameters, tariff impact factors, and projected GDP per-capita growth. Through an analysis of hidden potentials, demand hotspots, and market conditions that are most favorable to success, this method enables firms to focus on target countries, maximize returns, and global expansion with data, backed by accuracy.
By factoring in the projected importer demand gap that is currently unmet and could be potential opportunity, it identifies the potential for the Exporter (Country) among 190 countries, against the general trade analysis, which identifies the biggest importer or exporter.
To discover high-growth global markets and optimize your business strategy:
Click Here
Pricing
- Single User License$ 1,995
- Department License$ 2,400
- Site License$ 3,120
- Global License$ 3,795

Leadership Perspectives from Industry Events
Search
Thought Leadership and Analyst Meet


Our Clients
6WResearch In News
- Doha a strategic location for EV manufacturing hub: IPA Qatar
- Demand for luxury TVs surging in the GCC, says Samsung
- Empowering Growth: The Thriving Journey of Bangladesh’s Cable Industry
- Demand for luxury TVs surging in the GCC, says Samsung
- Video call with a traditional healer? Once unthinkable, it’s now common in South Africa
- Intelligent Buildings To Smooth GCC’s Path To Net Zero
Latest Reports
- New Zealand Aseptic Manufacturing Market (2026-2032)
- Netherlands Aseptic Manufacturing Market (2026-2032)
- Nauru Aseptic Manufacturing Market (2026-2032)
- Namibia Aseptic Manufacturing Market (2026-2032)
- Mozambique Aseptic Manufacturing Market (2026-2032)
- Montenegro Aseptic Manufacturing Market (2026-2032)
- Mongolia Aseptic Manufacturing Market (2026-2032)
- Monaco Aseptic Manufacturing Market (2026-2032)
- Micronesia Aseptic Manufacturing Market (2026-2032)
- Mauritius Aseptic Manufacturing Market (2026-2032)
Industry Events and Analyst Meet

HIMTEX 2026

India Refining Summit 2026

India EV Show 2026

EV tech India Expo 2026

Auto Tech Asia 2026
Whitepaper
- Middle East & Africa Commercial Security Market Click here to view more.
- Middle East & Africa Fire Safety Systems & Equipment Market Click here to view more.
- GCC Drone Market Click here to view more.
- Middle East Lighting Fixture Market Click here to view more.
- GCC Physical & Perimeter Security Market Click here to view more.