Bolivia Ink Market (2025-2031) | Forecast, Segmentation, Size, Industry, Analysis, Growth, Value, Trends, Companies, Outlook, Revenue & Share
Market Forecast By Technology (Lithographic , Flexographic , Gravure, Digital, Letterpress, Others), By Ink Type (Oil Based, Solvent Based, Water Based), By Applications (Label And Packaging, Commercial Printing, Publications, Others) And Competitive Landscape
| Product Code: ETC5098961 | Publication Date: Nov 2023 | Updated Date: Sep 2025 | Product Type: Market Research Report | |
| Publisher: 6Wresearch | Author: Sachin Kumar Rai | No. of Pages: 60 | No. of Figures: 30 | No. of Tables: 5 |
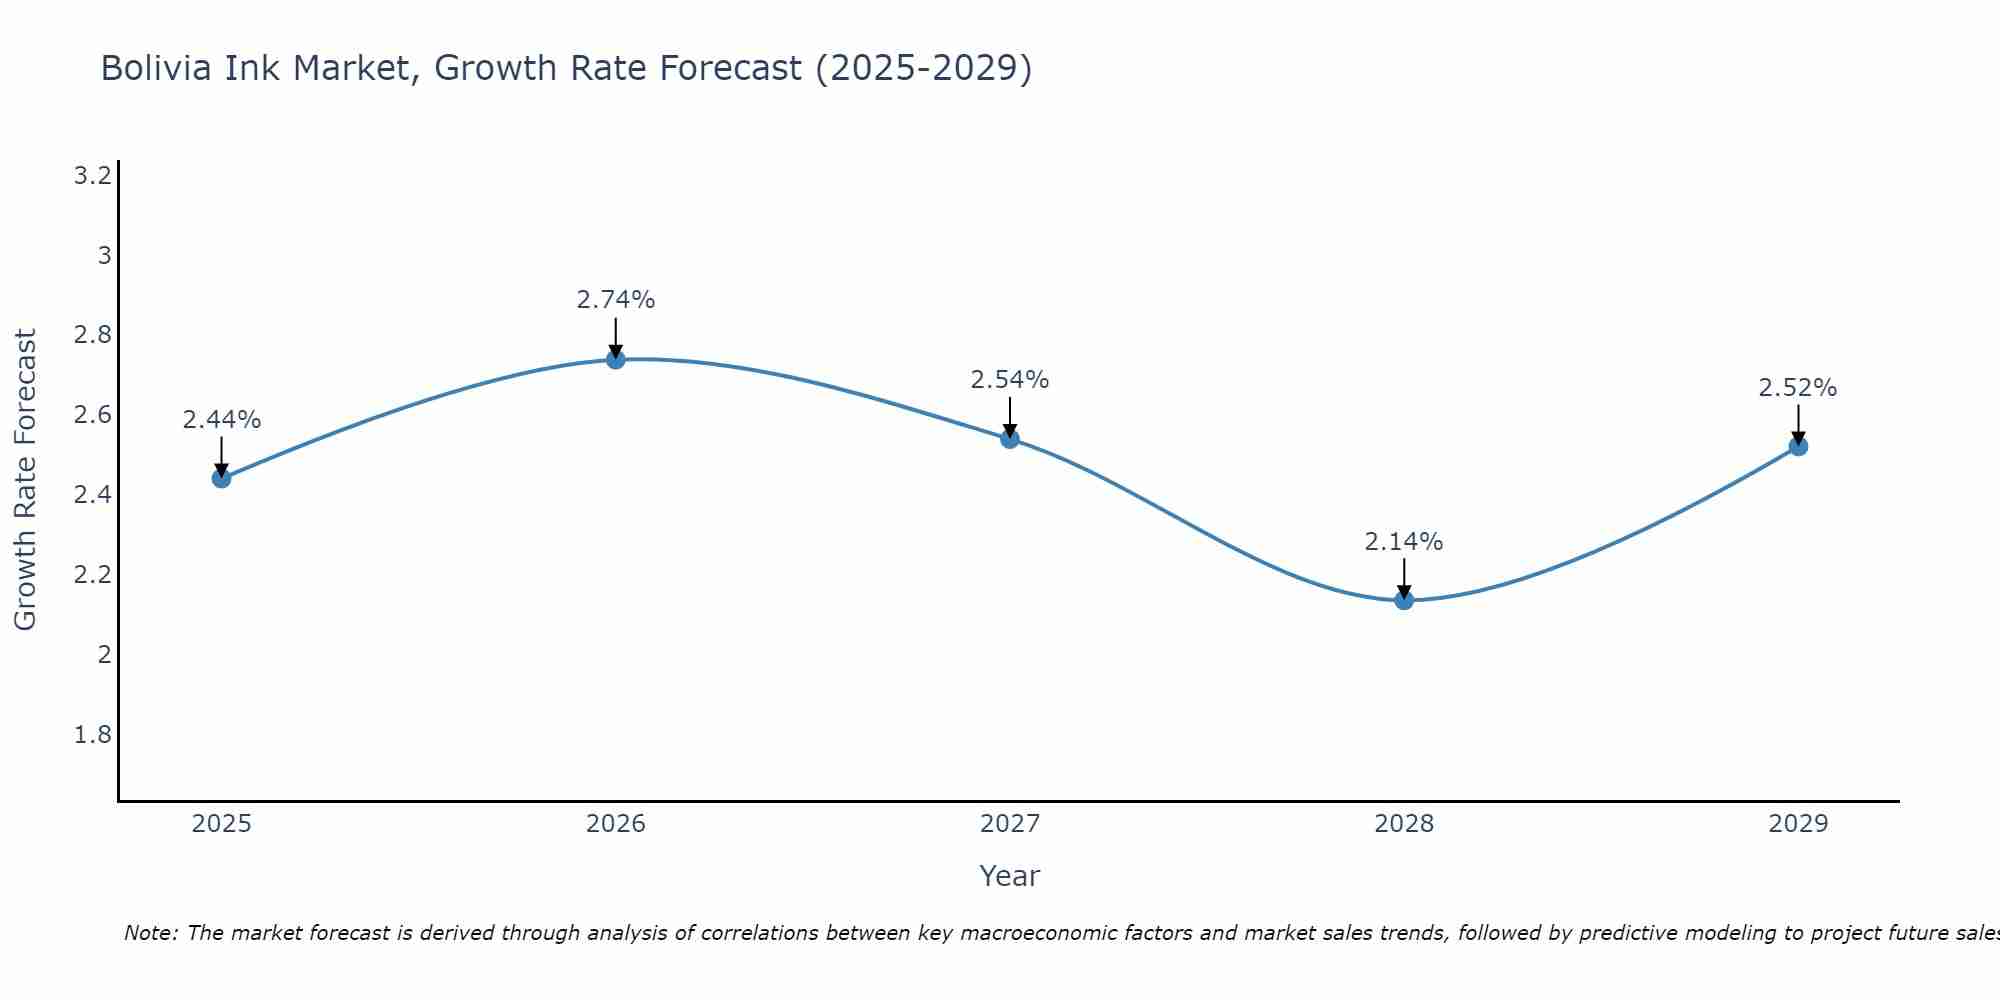
Bolivia Ink Market Size Growth Rate
The Bolivia Ink Market is projected to witness mixed growth rate patterns during 2025 to 2029. Starting at 2.44% in 2025, the market peaks at 2.74% in 2026, and settles at 2.52% by 2029.
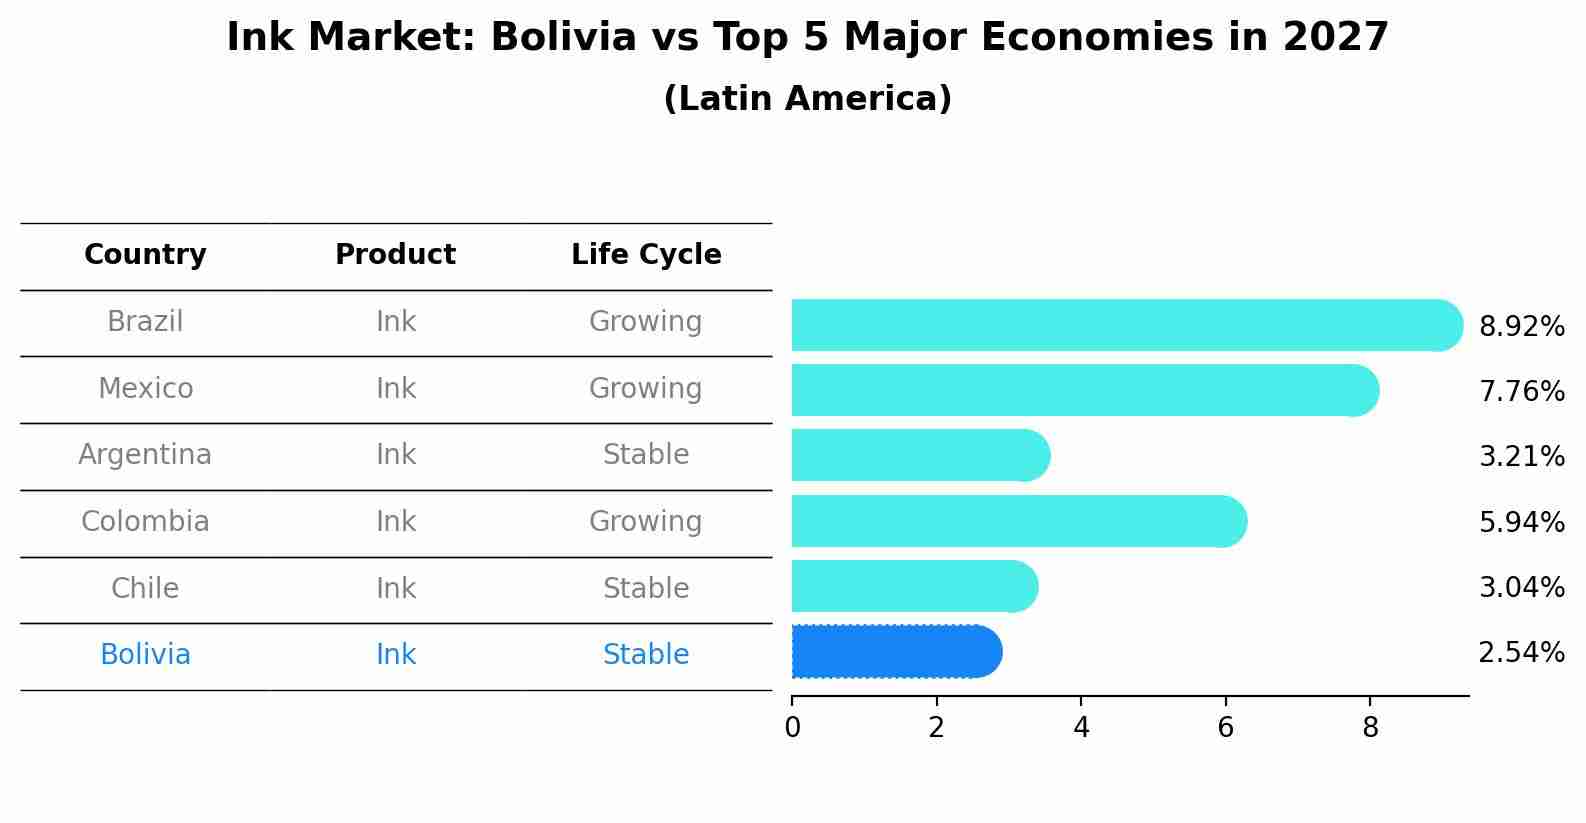
Ink Market: Bolivia vs Top 5 Major Economies in 2027 (Latin America)
The Ink market in Bolivia is projected to grow at a stable growth rate of 2.54% by 2027, within the Latin America region led by Brazil, along with other countries like Mexico, Argentina, Colombia and Chile, collectively shaping a dynamic and evolving market environment driven by innovation and increasing adoption of emerging technologies.
Bolivia Ink Market Overview
The ink market in Bolivia includes products for printing, packaging, and labeling. The market is growing as the demand for high-quality and environmentally friendly inks rises in various industries.
Drivers of the market
The ink market in Bolivia is driven by the growing demand for printing and packaging solutions in various industries, including publishing, packaging, and textiles. Inks are essential for applying text and graphics to various substrates, including paper, plastic, and fabric. As Bolivia`s printing and packaging industries expand and consumer preferences shift towards high-quality printed materials, the demand for inks increases. Additionally, advancements in ink formulations and a focus on improving print quality and environmental sustainability drive market growth.
Challenges of the market
The ink market in Bolivia is constrained by high costs of importing inks and a lack of local manufacturing capabilities. Investment in technology and infrastructure is necessary to support the production and application of various ink types. Additionally, market growth is impacted by limited technical expertise and awareness of the benefits and applications of different inks.
Government Policy of the market
Government policies in the ink market emphasize quality, safety, and environmental impact. Regulations may set standards for ink composition, safety, and environmental compliance. The government may support initiatives aimed at reducing the environmental impact of ink production and usage, and offer incentives for companies developing eco-friendly and non-toxic ink formulations.
Key Highlights of the Report:
- Bolivia Ink Market Outlook
- Market Size of Bolivia Ink Market, 2024
- Forecast of Bolivia Ink Market, 2031
- Historical Data and Forecast of Bolivia Ink Revenues & Volume for the Period 2021-2031
- Bolivia Ink Market Trend Evolution
- Bolivia Ink Market Drivers and Challenges
- Bolivia Ink Price Trends
- Bolivia Ink Porter`s Five Forces
- Bolivia Ink Industry Life Cycle
- Historical Data and Forecast of Bolivia Ink Market Revenues & Volume By Technology for the Period 2021-2031
- Historical Data and Forecast of Bolivia Ink Market Revenues & Volume By Lithographic for the Period 2021-2031
- Historical Data and Forecast of Bolivia Ink Market Revenues & Volume By Flexographic for the Period 2021-2031
- Historical Data and Forecast of Bolivia Ink Market Revenues & Volume By Gravure for the Period 2021-2031
- Historical Data and Forecast of Bolivia Ink Market Revenues & Volume By Digital for the Period 2021-2031
- Historical Data and Forecast of Bolivia Ink Market Revenues & Volume By Letterpress for the Period 2021-2031
- Historical Data and Forecast of Bolivia Ink Market Revenues & Volume By Others for the Period 2021-2031
- Historical Data and Forecast of Bolivia Ink Market Revenues & Volume By Ink Type for the Period 2021-2031
- Historical Data and Forecast of Bolivia Ink Market Revenues & Volume By Oil Based for the Period 2021-2031
- Historical Data and Forecast of Bolivia Ink Market Revenues & Volume By Solvent Based for the Period 2021-2031
- Historical Data and Forecast of Bolivia Ink Market Revenues & Volume By Water Based for the Period 2021-2031
- Historical Data and Forecast of Bolivia Ink Market Revenues & Volume By Applications for the Period 2021-2031
- Historical Data and Forecast of Bolivia Ink Market Revenues & Volume By Label And Packaging for the Period 2021-2031
- Historical Data and Forecast of Bolivia Ink Market Revenues & Volume By Commercial Printing for the Period 2021-2031
- Historical Data and Forecast of Bolivia Ink Market Revenues & Volume By Publications for the Period 2021-2031
- Historical Data and Forecast of Bolivia Ink Market Revenues & Volume By Others for the Period 2021-2031
- Bolivia Ink Import Export Trade Statistics
- Market Opportunity Assessment By Technology
- Market Opportunity Assessment By Ink Type
- Market Opportunity Assessment By Applications
- Bolivia Ink Top Companies Market Share
- Bolivia Ink Competitive Benchmarking By Technical and Operational Parameters
- Bolivia Ink Company Profiles
- Bolivia Ink Key Strategic Recommendations
Frequently Asked Questions About the Market Study (FAQs):
6Wresearch actively monitors the Bolivia Ink Market and publishes its comprehensive annual report, highlighting emerging trends, growth drivers, revenue analysis, and forecast outlook. Our insights help businesses to make data-backed strategic decisions with ongoing market dynamics. Our analysts track relevent industries related to the Bolivia Ink Market, allowing our clients with actionable intelligence and reliable forecasts tailored to emerging regional needs.
Yes, we provide customisation as per your requirements. To learn more, feel free to contact us on sales@6wresearch.com
1 Executive Summary |
2 Introduction |
2.1 Key Highlights of the Report |
2.2 Report Description |
2.3 Market Scope & Segmentation |
2.4 Research Methodology |
2.5 Assumptions |
3 Bolivia Ink Market Overview |
3.1 Bolivia Country Macro Economic Indicators |
3.2 Bolivia Ink Market Revenues & Volume, 2021 & 2031F |
3.3 Bolivia Ink Market - Industry Life Cycle |
3.4 Bolivia Ink Market - Porter's Five Forces |
3.5 Bolivia Ink Market Revenues & Volume Share, By Technology, 2021 & 2031F |
3.6 Bolivia Ink Market Revenues & Volume Share, By Ink Type, 2021 & 2031F |
3.7 Bolivia Ink Market Revenues & Volume Share, By Applications, 2021 & 2031F |
4 Bolivia Ink Market Dynamics |
4.1 Impact Analysis |
4.2 Market Drivers |
4.2.1 Increasing demand for printed packaging materials |
4.2.2 Growth in the e-commerce sector leading to higher demand for packaging and labeling materials |
4.2.3 Rise in the use of inks in the textile industry for printing on fabrics |
4.3 Market Restraints |
4.3.1 Fluctuating raw material prices impacting production costs |
4.3.2 Environmental regulations leading to the need for eco-friendly ink solutions |
4.3.3 Competition from digital alternatives like electronic displays impacting traditional printing |
5 Bolivia Ink Market Trends |
6 Bolivia Ink Market Segmentations |
6.1 Bolivia Ink Market, By Technology |
6.1.1 Overview and Analysis |
6.1.2 Bolivia Ink Market Revenues & Volume, By Lithographic , 2021-2031F |
6.1.3 Bolivia Ink Market Revenues & Volume, By Flexographic , 2021-2031F |
6.1.4 Bolivia Ink Market Revenues & Volume, By Gravure, 2021-2031F |
6.1.5 Bolivia Ink Market Revenues & Volume, By Digital, 2021-2031F |
6.1.6 Bolivia Ink Market Revenues & Volume, By Letterpress, 2021-2031F |
6.1.7 Bolivia Ink Market Revenues & Volume, By Others, 2021-2031F |
6.2 Bolivia Ink Market, By Ink Type |
6.2.1 Overview and Analysis |
6.2.2 Bolivia Ink Market Revenues & Volume, By Oil Based, 2021-2031F |
6.2.3 Bolivia Ink Market Revenues & Volume, By Solvent Based, 2021-2031F |
6.2.4 Bolivia Ink Market Revenues & Volume, By Water Based, 2021-2031F |
6.3 Bolivia Ink Market, By Applications |
6.3.1 Overview and Analysis |
6.3.2 Bolivia Ink Market Revenues & Volume, By Label And Packaging, 2021-2031F |
6.3.3 Bolivia Ink Market Revenues & Volume, By Commercial Printing, 2021-2031F |
6.3.4 Bolivia Ink Market Revenues & Volume, By Publications, 2021-2031F |
6.3.5 Bolivia Ink Market Revenues & Volume, By Others, 2021-2031F |
7 Bolivia Ink Market Import-Export Trade Statistics |
7.1 Bolivia Ink Market Export to Major Countries |
7.2 Bolivia Ink Market Imports from Major Countries |
8 Bolivia Ink Market Key Performance Indicators |
8.1 RD investment in developing sustainable ink solutions |
8.2 Adoption rate of digital printing technologies in the market |
8.3 Percentage of revenue from new product innovations in the ink market |
9 Bolivia Ink Market - Opportunity Assessment |
9.1 Bolivia Ink Market Opportunity Assessment, By Technology, 2021 & 2031F |
9.2 Bolivia Ink Market Opportunity Assessment, By Ink Type, 2021 & 2031F |
9.3 Bolivia Ink Market Opportunity Assessment, By Applications, 2021 & 2031F |
10 Bolivia Ink Market - Competitive Landscape |
10.1 Bolivia Ink Market Revenue Share, By Companies, 2024 |
10.2 Bolivia Ink Market Competitive Benchmarking, By Operating and Technical Parameters |
11 Company Profiles |
12 Recommendations | 13 Disclaimer |
Global Go To Market Strategy - 2030
Export potential enables firms to identify high-growth global markets with greater confidence by combining advanced trade intelligence with a structured quantitative methodology. The framework analyzes emerging demand trends and country-level import patterns while integrating macroeconomic and trade datasets such as GDP and population forecasts, bilateral import–export flows, tariff structures, elasticity differentials between developed and developing economies, geographic distance, and import demand projections. Using weighted trade values from 2020–2024 as the base period to project country-to-country export potential for 2030, these inputs are operationalized through calculated drivers such as gravity model parameters, tariff impact factors, and projected GDP per-capita growth. Through an analysis of hidden potentials, demand hotspots, and market conditions that are most favorable to success, this method enables firms to focus on target countries, maximize returns, and global expansion with data, backed by accuracy.
By factoring in the projected importer demand gap that is currently unmet and could be potential opportunity, it identifies the potential for the Exporter (Country) among 190 countries, against the general trade analysis, which identifies the biggest importer or exporter.
To discover high-growth global markets and optimize your business strategy:
Click Here
Pricing
- Single User License$ 1,995
- Department License$ 2,400
- Site License$ 3,120
- Global License$ 3,795

Leadership Perspectives from Industry Events
Search
Thought Leadership and Analyst Meet


Our Clients
6WResearch In News
- Doha a strategic location for EV manufacturing hub: IPA Qatar
- Demand for luxury TVs surging in the GCC, says Samsung
- Empowering Growth: The Thriving Journey of Bangladesh’s Cable Industry
- Demand for luxury TVs surging in the GCC, says Samsung
- Video call with a traditional healer? Once unthinkable, it’s now common in South Africa
- Intelligent Buildings To Smooth GCC’s Path To Net Zero
Latest Reports
- New Zealand Aseptic Manufacturing Market (2026-2032)
- Netherlands Aseptic Manufacturing Market (2026-2032)
- Nauru Aseptic Manufacturing Market (2026-2032)
- Namibia Aseptic Manufacturing Market (2026-2032)
- Mozambique Aseptic Manufacturing Market (2026-2032)
- Montenegro Aseptic Manufacturing Market (2026-2032)
- Mongolia Aseptic Manufacturing Market (2026-2032)
- Monaco Aseptic Manufacturing Market (2026-2032)
- Micronesia Aseptic Manufacturing Market (2026-2032)
- Mauritius Aseptic Manufacturing Market (2026-2032)
Industry Events and Analyst Meet

HIMTEX 2026

India Refining Summit 2026

India EV Show 2026

EV tech India Expo 2026

Auto Tech Asia 2026
Whitepaper
- Middle East & Africa Commercial Security Market Click here to view more.
- Middle East & Africa Fire Safety Systems & Equipment Market Click here to view more.
- GCC Drone Market Click here to view more.
- Middle East Lighting Fixture Market Click here to view more.
- GCC Physical & Perimeter Security Market Click here to view more.