Brazil Processed Snacks Market (2025-2031) | Size, Companies, Segmentation, Challenges, Pricing Analysis, Value, Opportunities, Strategy, Segments, Supply, Competitive, Forecast, Restraints, Outlook, Industry, Trends, Consumer Insights, Analysis, Competition, Share, Investment Trends, Drivers, Revenue, Demand, Strategic Insights, Growth
Market Forecast By Type (Chips, Popcorn, Crackers), By Form (Nuts, Pretzels, Biscuits), By Packaging (Bags, Cans, Boxes), By End Use (Ready-to-Eat, On-the-Go, Snacks), By Distribution Channels (Retail, Online, Wholesale) And Competitive Landscape
| Product Code: ETC10205058 | Publication Date: Apr 2025 | Updated Date: Oct 2025 | Product Type: Market Research Report | |
| Publisher: 6Wresearch | No. of Pages: 65 | No. of Figures: 34 | No. of Tables: 19 | |
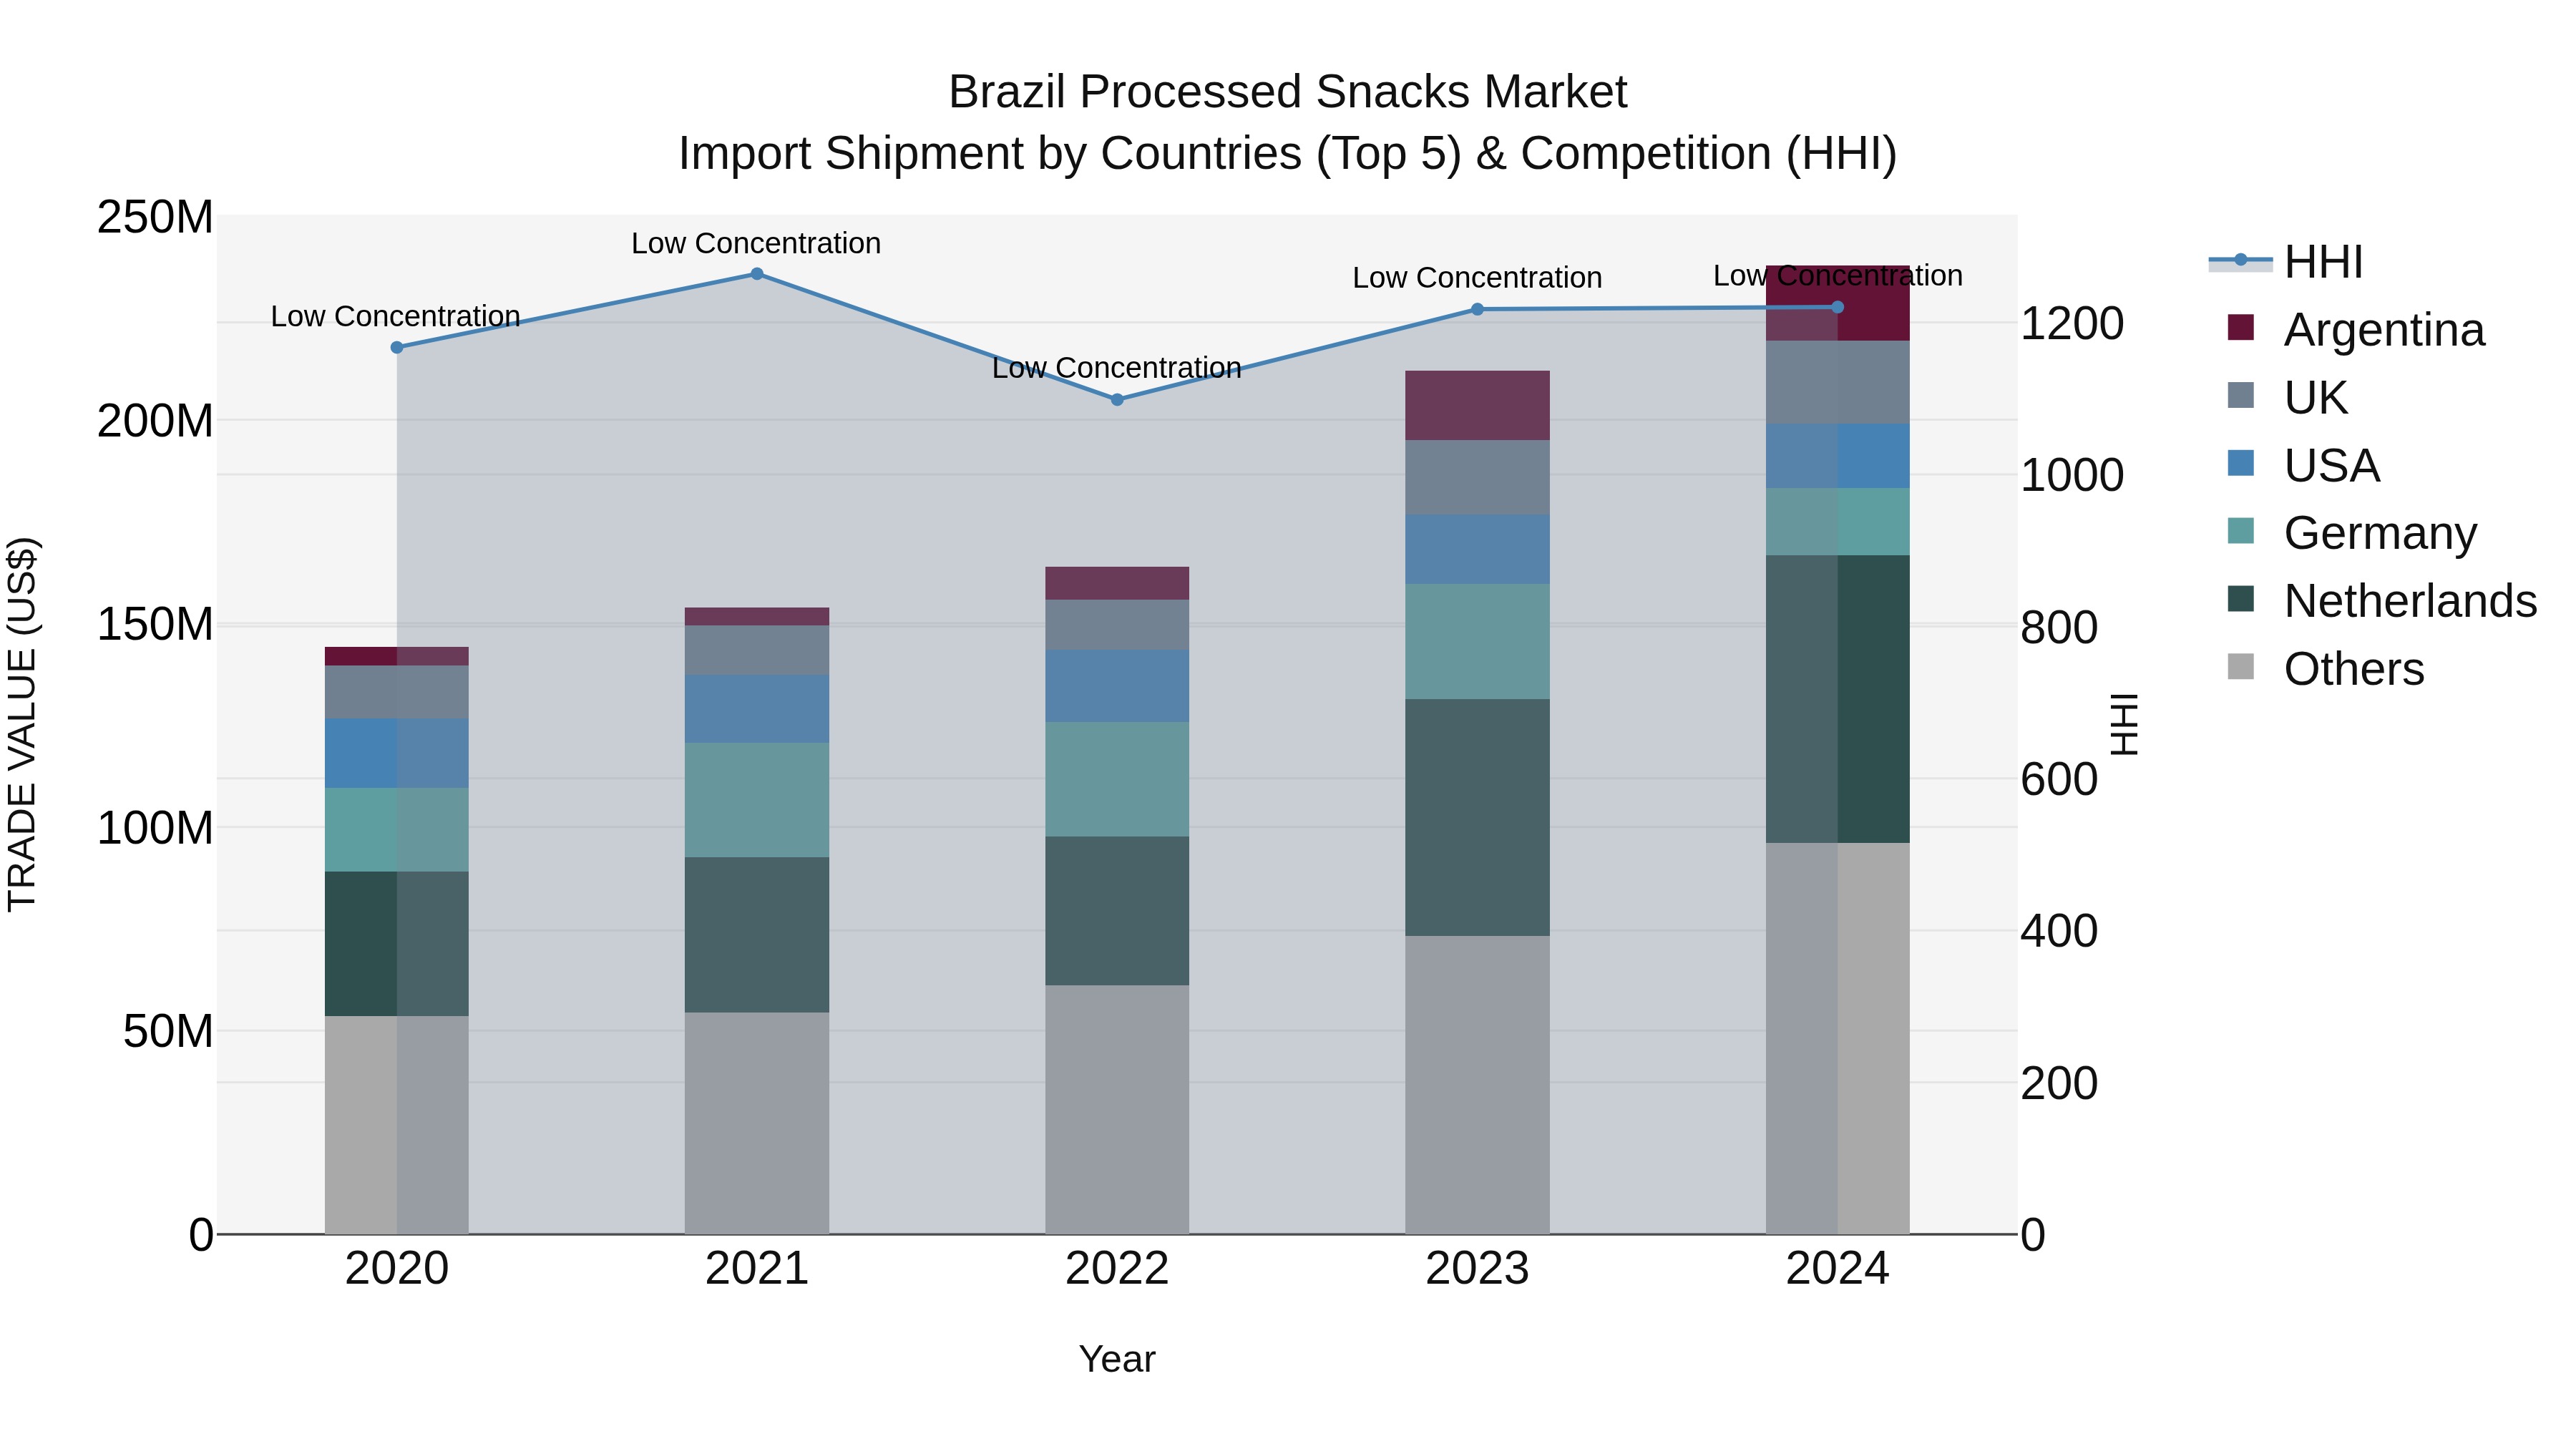
Brazil Processed Snacks Market Top 5 Importing Countries and Market Competition (HHI) Analysis
The processed snacks import market in Brazil saw significant growth in 2024, with Netherlands, UK, Argentina, Germany, and USA emerging as the top exporting countries. Despite the high CAGR of 13.31% from 2020 to 2024, the market maintained low concentration levels based on the HHI. The impressive growth rate of 12.16% in 2024 indicates a buoyant market with strong demand for imported processed snacks in Brazil. This trend suggests opportunities for both domestic and international snack manufacturers to capitalize on the market`s expansion.
Key Highlights of the Report:
- Brazil Processed Snacks Market Outlook
- Market Size of Brazil Processed Snacks Market,2024
- Forecast of Brazil Processed Snacks Market, 2031
- Historical Data and Forecast of Brazil Processed Snacks Revenues & Volume for the Period 2021-2031
- Brazil Processed Snacks Market Trend Evolution
- Brazil Processed Snacks Market Drivers and Challenges
- Brazil Processed Snacks Price Trends
- Brazil Processed Snacks Porter's Five Forces
- Brazil Processed Snacks Industry Life Cycle
- Historical Data and Forecast of Brazil Processed Snacks Market Revenues & Volume By Type for the Period 2021-2031
- Historical Data and Forecast of Brazil Processed Snacks Market Revenues & Volume By Chips for the Period 2021-2031
- Historical Data and Forecast of Brazil Processed Snacks Market Revenues & Volume By Popcorn for the Period 2021-2031
- Historical Data and Forecast of Brazil Processed Snacks Market Revenues & Volume By Crackers for the Period 2021-2031
- Historical Data and Forecast of Brazil Processed Snacks Market Revenues & Volume By Form for the Period 2021-2031
- Historical Data and Forecast of Brazil Processed Snacks Market Revenues & Volume By Nuts for the Period 2021-2031
- Historical Data and Forecast of Brazil Processed Snacks Market Revenues & Volume By Pretzels for the Period 2021-2031
- Historical Data and Forecast of Brazil Processed Snacks Market Revenues & Volume By Biscuits for the Period 2021-2031
- Historical Data and Forecast of Brazil Processed Snacks Market Revenues & Volume By Packaging for the Period 2021-2031
- Historical Data and Forecast of Brazil Processed Snacks Market Revenues & Volume By Bags for the Period 2021-2031
- Historical Data and Forecast of Brazil Processed Snacks Market Revenues & Volume By Cans for the Period 2021-2031
- Historical Data and Forecast of Brazil Processed Snacks Market Revenues & Volume By Boxes for the Period 2021-2031
- Historical Data and Forecast of Brazil Processed Snacks Market Revenues & Volume By End Use for the Period 2021-2031
- Historical Data and Forecast of Brazil Processed Snacks Market Revenues & Volume By Ready-to-Eat for the Period 2021-2031
- Historical Data and Forecast of Brazil Processed Snacks Market Revenues & Volume By On-the-Go for the Period 2021-2031
- Historical Data and Forecast of Brazil Processed Snacks Market Revenues & Volume By Snacks for the Period 2021-2031
- Historical Data and Forecast of Brazil Processed Snacks Market Revenues & Volume By Distribution Channels for the Period 2021-2031
- Historical Data and Forecast of Brazil Processed Snacks Market Revenues & Volume By Retail for the Period 2021-2031
- Historical Data and Forecast of Brazil Processed Snacks Market Revenues & Volume By Online for the Period 2021-2031
- Historical Data and Forecast of Brazil Processed Snacks Market Revenues & Volume By Wholesale for the Period 2021-2031
- Brazil Processed Snacks Import Export Trade Statistics
- Market Opportunity Assessment By Type
- Market Opportunity Assessment By Form
- Market Opportunity Assessment By Packaging
- Market Opportunity Assessment By End Use
- Market Opportunity Assessment By Distribution Channels
- Brazil Processed Snacks Top Companies Market Share
- Brazil Processed Snacks Competitive Benchmarking By Technical and Operational Parameters
- Brazil Processed Snacks Company Profiles
- Brazil Processed Snacks Key Strategic Recommendations
Frequently Asked Questions About the Market Study (FAQs):
6Wresearch actively monitors the Brazil Processed Snacks Market and publishes its comprehensive annual report, highlighting emerging trends, growth drivers, revenue analysis, and forecast outlook. Our insights help businesses to make data-backed strategic decisions with ongoing market dynamics. Our analysts track relevent industries related to the Brazil Processed Snacks Market, allowing our clients with actionable intelligence and reliable forecasts tailored to emerging regional needs.
Yes, we provide customisation as per your requirements. To learn more, feel free to contact us on sales@6wresearch.com
1 Executive Summary |
2 Introduction |
2.1 Key Highlights of the Report |
2.2 Report Description |
2.3 Market Scope & Segmentation |
2.4 Research Methodology |
2.5 Assumptions |
3 Brazil Processed Snacks Market Overview |
3.1 Brazil Country Macro Economic Indicators |
3.2 Brazil Processed Snacks Market Revenues & Volume, 2021 & 2031F |
3.3 Brazil Processed Snacks Market - Industry Life Cycle |
3.4 Brazil Processed Snacks Market - Porter's Five Forces |
3.5 Brazil Processed Snacks Market Revenues & Volume Share, By Type, 2021 & 2031F |
3.6 Brazil Processed Snacks Market Revenues & Volume Share, By Form, 2021 & 2031F |
3.7 Brazil Processed Snacks Market Revenues & Volume Share, By Packaging, 2021 & 2031F |
3.8 Brazil Processed Snacks Market Revenues & Volume Share, By End Use, 2021 & 2031F |
3.9 Brazil Processed Snacks Market Revenues & Volume Share, By Distribution Channels, 2021 & 2031F |
4 Brazil Processed Snacks Market Dynamics |
4.1 Impact Analysis |
4.2 Market Drivers |
4.2.1 Increasing urbanization leading to changing lifestyles and preferences towards convenient snack options. |
4.2.2 Rising disposable incomes and expanding middle-class population driving higher spending on processed snacks. |
4.2.3 Growing demand for healthier snack options such as organic, gluten-free, and low-sugar snacks. |
4.3 Market Restraints |
4.3.1 Health concerns related to high levels of sugar, salt, and artificial ingredients in processed snacks impacting consumer choices. |
4.3.2 Competition from alternative snack options such as fresh fruits, nuts, and homemade snacks. |
4.3.3 Fluctuating raw material prices affecting production costs and pricing strategies of processed snack manufacturers. |
5 Brazil Processed Snacks Market Trends |
6 Brazil Processed Snacks Market, By Types |
6.1 Brazil Processed Snacks Market, By Type |
6.1.1 Overview and Analysis |
6.1.2 Brazil Processed Snacks Market Revenues & Volume, By Type, 2021 - 2031F |
6.1.3 Brazil Processed Snacks Market Revenues & Volume, By Chips, 2021 - 2031F |
6.1.4 Brazil Processed Snacks Market Revenues & Volume, By Popcorn, 2021 - 2031F |
6.1.5 Brazil Processed Snacks Market Revenues & Volume, By Crackers, 2021 - 2031F |
6.1.6 Brazil Processed Snacks Market Revenues & Volume, By Other Snacks, 2021 - 2031F |
6.2 Brazil Processed Snacks Market, By Form |
6.2.1 Overview and Analysis |
6.2.2 Brazil Processed Snacks Market Revenues & Volume, By Nuts, 2021 - 2031F |
6.2.3 Brazil Processed Snacks Market Revenues & Volume, By Pretzels, 2021 - 2031F |
6.2.4 Brazil Processed Snacks Market Revenues & Volume, By Biscuits, 2021 - 2031F |
6.3 Brazil Processed Snacks Market, By Packaging |
6.3.1 Overview and Analysis |
6.3.2 Brazil Processed Snacks Market Revenues & Volume, By Bags, 2021 - 2031F |
6.3.3 Brazil Processed Snacks Market Revenues & Volume, By Cans, 2021 - 2031F |
6.3.4 Brazil Processed Snacks Market Revenues & Volume, By Boxes, 2021 - 2031F |
6.4 Brazil Processed Snacks Market, By End Use |
6.4.1 Overview and Analysis |
6.4.2 Brazil Processed Snacks Market Revenues & Volume, By Ready-to-Eat, 2021 - 2031F |
6.4.3 Brazil Processed Snacks Market Revenues & Volume, By On-the-Go, 2021 - 2031F |
6.4.4 Brazil Processed Snacks Market Revenues & Volume, By Snacks, 2021 - 2031F |
6.4.5 Brazil Processed Snacks Market Revenues & Volume, By Foodservice, 2021 - 2031F |
6.5 Brazil Processed Snacks Market, By Distribution Channels |
6.5.1 Overview and Analysis |
6.5.2 Brazil Processed Snacks Market Revenues & Volume, By Retail, 2021 - 2031F |
6.5.3 Brazil Processed Snacks Market Revenues & Volume, By Online, 2021 - 2031F |
6.5.4 Brazil Processed Snacks Market Revenues & Volume, By Wholesale, 2021 - 2031F |
7 Brazil Processed Snacks Market Import-Export Trade Statistics |
7.1 Brazil Processed Snacks Market Export to Major Countries |
7.2 Brazil Processed Snacks Market Imports from Major Countries |
8 Brazil Processed Snacks Market Key Performance Indicators |
8.1 Consumer engagement metrics such as social media interactions, website visits, and online reviews to gauge brand perception and customer loyalty. |
8.2 New product development rate to assess the ability of companies to innovate and meet changing consumer preferences. |
8.3 Market penetration rate in different regions or demographic segments to track the expansion of processed snacks' market reach. |
8.4 Sustainability initiatives like reduction of packaging waste, carbon footprint, and water usage to measure the industry's commitment to environmental responsibility. |
9 Brazil Processed Snacks Market - Opportunity Assessment |
9.1 Brazil Processed Snacks Market Opportunity Assessment, By Type, 2021 & 2031F |
9.2 Brazil Processed Snacks Market Opportunity Assessment, By Form, 2021 & 2031F |
9.3 Brazil Processed Snacks Market Opportunity Assessment, By Packaging, 2021 & 2031F |
9.4 Brazil Processed Snacks Market Opportunity Assessment, By End Use, 2021 & 2031F |
9.5 Brazil Processed Snacks Market Opportunity Assessment, By Distribution Channels, 2021 & 2031F |
10 Brazil Processed Snacks Market - Competitive Landscape |
10.1 Brazil Processed Snacks Market Revenue Share, By Companies, 2024 |
10.2 Brazil Processed Snacks Market Competitive Benchmarking, By Operating and Technical Parameters |
11 Company Profiles |
12 Recommendations |
13 Disclaimer |
Export potential assessment - trade Analytics for 2030
Export potential enables firms to identify high-growth global markets with greater confidence by combining advanced trade intelligence with a structured quantitative methodology. The framework analyzes emerging demand trends and country-level import patterns while integrating macroeconomic and trade datasets such as GDP and population forecasts, bilateral import–export flows, tariff structures, elasticity differentials between developed and developing economies, geographic distance, and import demand projections. Using weighted trade values from 2020–2024 as the base period to project country-to-country export potential for 2030, these inputs are operationalized through calculated drivers such as gravity model parameters, tariff impact factors, and projected GDP per-capita growth. Through an analysis of hidden potentials, demand hotspots, and market conditions that are most favorable to success, this method enables firms to focus on target countries, maximize returns, and global expansion with data, backed by accuracy.
By factoring in the projected importer demand gap that is currently unmet and could be potential opportunity, it identifies the potential for the Exporter (Country) among 190 countries, against the general trade analysis, which identifies the biggest importer or exporter.
To discover high-growth global markets and optimize your business strategy:
Click Here
Pricing
- Single User License$ 1,995
- Department License$ 2,400
- Site License$ 3,120
- Global License$ 3,795

Search
Thought Leadership and Analyst Meet


Our Clients
Latest Reports
- Taiwan Food Delivery Platform Market (2026-2032) | Companies, Outlook, Analysis, Trends, Value, Revenue, Segmentation, Share, Forecast, Competitive Landscape, Growth, Size & Forecast
- United Kingdom (UK) Long-term Care Insurance Market (2026-2032) | Growth, Share, Consumer Insights, Drivers, Opportunities, Competition, Pricing Analysis, Segments, Restraints, Companies, Competitive, Value, Outlook, Size, Demand, Analysis, Challenges, Strategic Insights, Investment Trends, Revenue, Trends, Supply, Forecast
- United Kingdom (UK) Long Term Care Market (2026-2032) | Companies, Outlook, Analysis, Trends, Value, Revenue, Segmentation, Share, Forecast, Competitive Landscape, Growth, Size & Forecast
- Iraq Insulation and Waterproofing Market (2026-2032) | Outlook, Drivers, Growth, Size, Share, Industry, Revenue, Trends, Demand, Competitive, Strategic Insights, Opportunities, Segments, Companies, Challenges, Strategy, Consumer Insights, Analysis, Investment Trends, Value, Segmentation, Forecast, Restraints
- India Switchgear Market Outlook (2026-2032) | Size, Share, Trends, Growth, Revenue, Forecast, Analysis, Value, Outlook
- Pakistan Contraceptive Implants Market (2025-2031) | Demand, Growth, Size, Share, Industry, Pricing Analysis, Competitive, Strategic Insights, Strategy, Consumer Insights, Analysis, Investment Trends, Opportunities, Revenue, Segments, Value, Segmentation, Supply, Forecast, Restraints, Outlook, Competition, Drivers, Trends, Companies, Challenges
- Sri Lanka Packaging Market (2026-2032) | Outlook, Competition, Drivers, Trends, Demand, Pricing Analysis, Competitive, Strategic Insights, Companies, Challenges, Strategy, Consumer Insights, Analysis, Investment Trends, Opportunities, Growth, Size, Share, Industry, Revenue, Segments, Value, Segmentation, Supply, Forecast, Restraints
- India Kids Watches Market (2026-2032) | Strategy, Consumer Insights, Analysis, Investment Trends, Opportunities, Growth, Size, Share, Industry, Revenue, Segments, Value, Segmentation, Supply, Forecast, Restraints, Outlook, Competition, Drivers, Trends, Demand, Pricing Analysis, Competitive, Strategic Insights, Companies, Challenges
- Saudi Arabia Core Assurance Service Market (2025-2031) | Strategy, Consumer Insights, Analysis, Investment Trends, Opportunities, Growth, Size, Share, Industry, Revenue, Segments, Value, Segmentation, Supply, Forecast, Restraints, Outlook, Competition, Drivers, Trends, Demand, Pricing Analysis, Competitive, Strategic Insights, Companies, Challenges
- Romania Uninterruptible Power Supply (UPS) Market (2026-2032) | Industry, Analysis, Revenue, Size, Forecast, Outlook, Value, Trends, Share, Growth & Companies
Industry Events and Analyst Meet

India EV Show 2026

EV tech India Expo 2026

Auto Tech Asia 2026

Battery Tech India 2026

Smart Production Solutions Guangzhou 2026
Whitepaper
- Middle East & Africa Commercial Security Market Click here to view more.
- Middle East & Africa Fire Safety Systems & Equipment Market Click here to view more.
- GCC Drone Market Click here to view more.
- Middle East Lighting Fixture Market Click here to view more.
- GCC Physical & Perimeter Security Market Click here to view more.
6WResearch In News
- Doha a strategic location for EV manufacturing hub: IPA Qatar
- Demand for luxury TVs surging in the GCC, says Samsung
- Empowering Growth: The Thriving Journey of Bangladesh’s Cable Industry
- Demand for luxury TVs surging in the GCC, says Samsung
- Video call with a traditional healer? Once unthinkable, it’s now common in South Africa
- Intelligent Buildings To Smooth GCC’s Path To Net Zero