Brazil Soft Drinks Packaging Market (2026-2032) Outlook | Share, Revenue, Trends, Analysis, Forecast, Size, Growth, Industry, Companies & Value
Market Forecast By Material (Paper, Plastic, Metal, Glass), By Product Type (Cans, Boxes, Bottles, Cartons), By Capacity (Up to 100 ml, 100 to 250 ml, 250 to 500 ml, 500 to 1000 ml, 1000 to 2000 ml, Above 2000 ml), By Application (Carbonated soft drinks, Functional Drinks, Sport Drinks, Energy Drinks, Others, Juices) And Competitive Landscape
| Product Code: ETC189854 | Publication Date: May 2022 | Updated Date: Jun 2026 | Product Type: Market Research Report | |
| Publisher: 6Wresearch | Author: Ravi Bhandari | No. of Pages: 60 | No. of Figures: 40 | No. of Tables: 7 |
Brazil Soft Drinks Packaging Market Size, Share & Growth Rate
The Brazil Soft Drinks Packaging Market was estimated at USD 323 Million in 2025 and is projected to reach USD 386 Million by 2032, growing at a CAGR of 2.6% from 2026 to 2032. This trajectory is being driven by a notable shift in consumer preferences towards healthier beverages, alongside a rising demand for sustainable and innovative packaging solutions. Furthermore, advancements in packaging technologies and increasing regulatory support for recycling initiatives are catalyzing growth in this dynamic sector.
Brazil Soft Drinks Packaging Market Year-wise Growth Rate and Key Drivers
This graph highlights how the Brazil Soft Drinks Packaging Market has steadily grown over the years, supported by major growth factors.
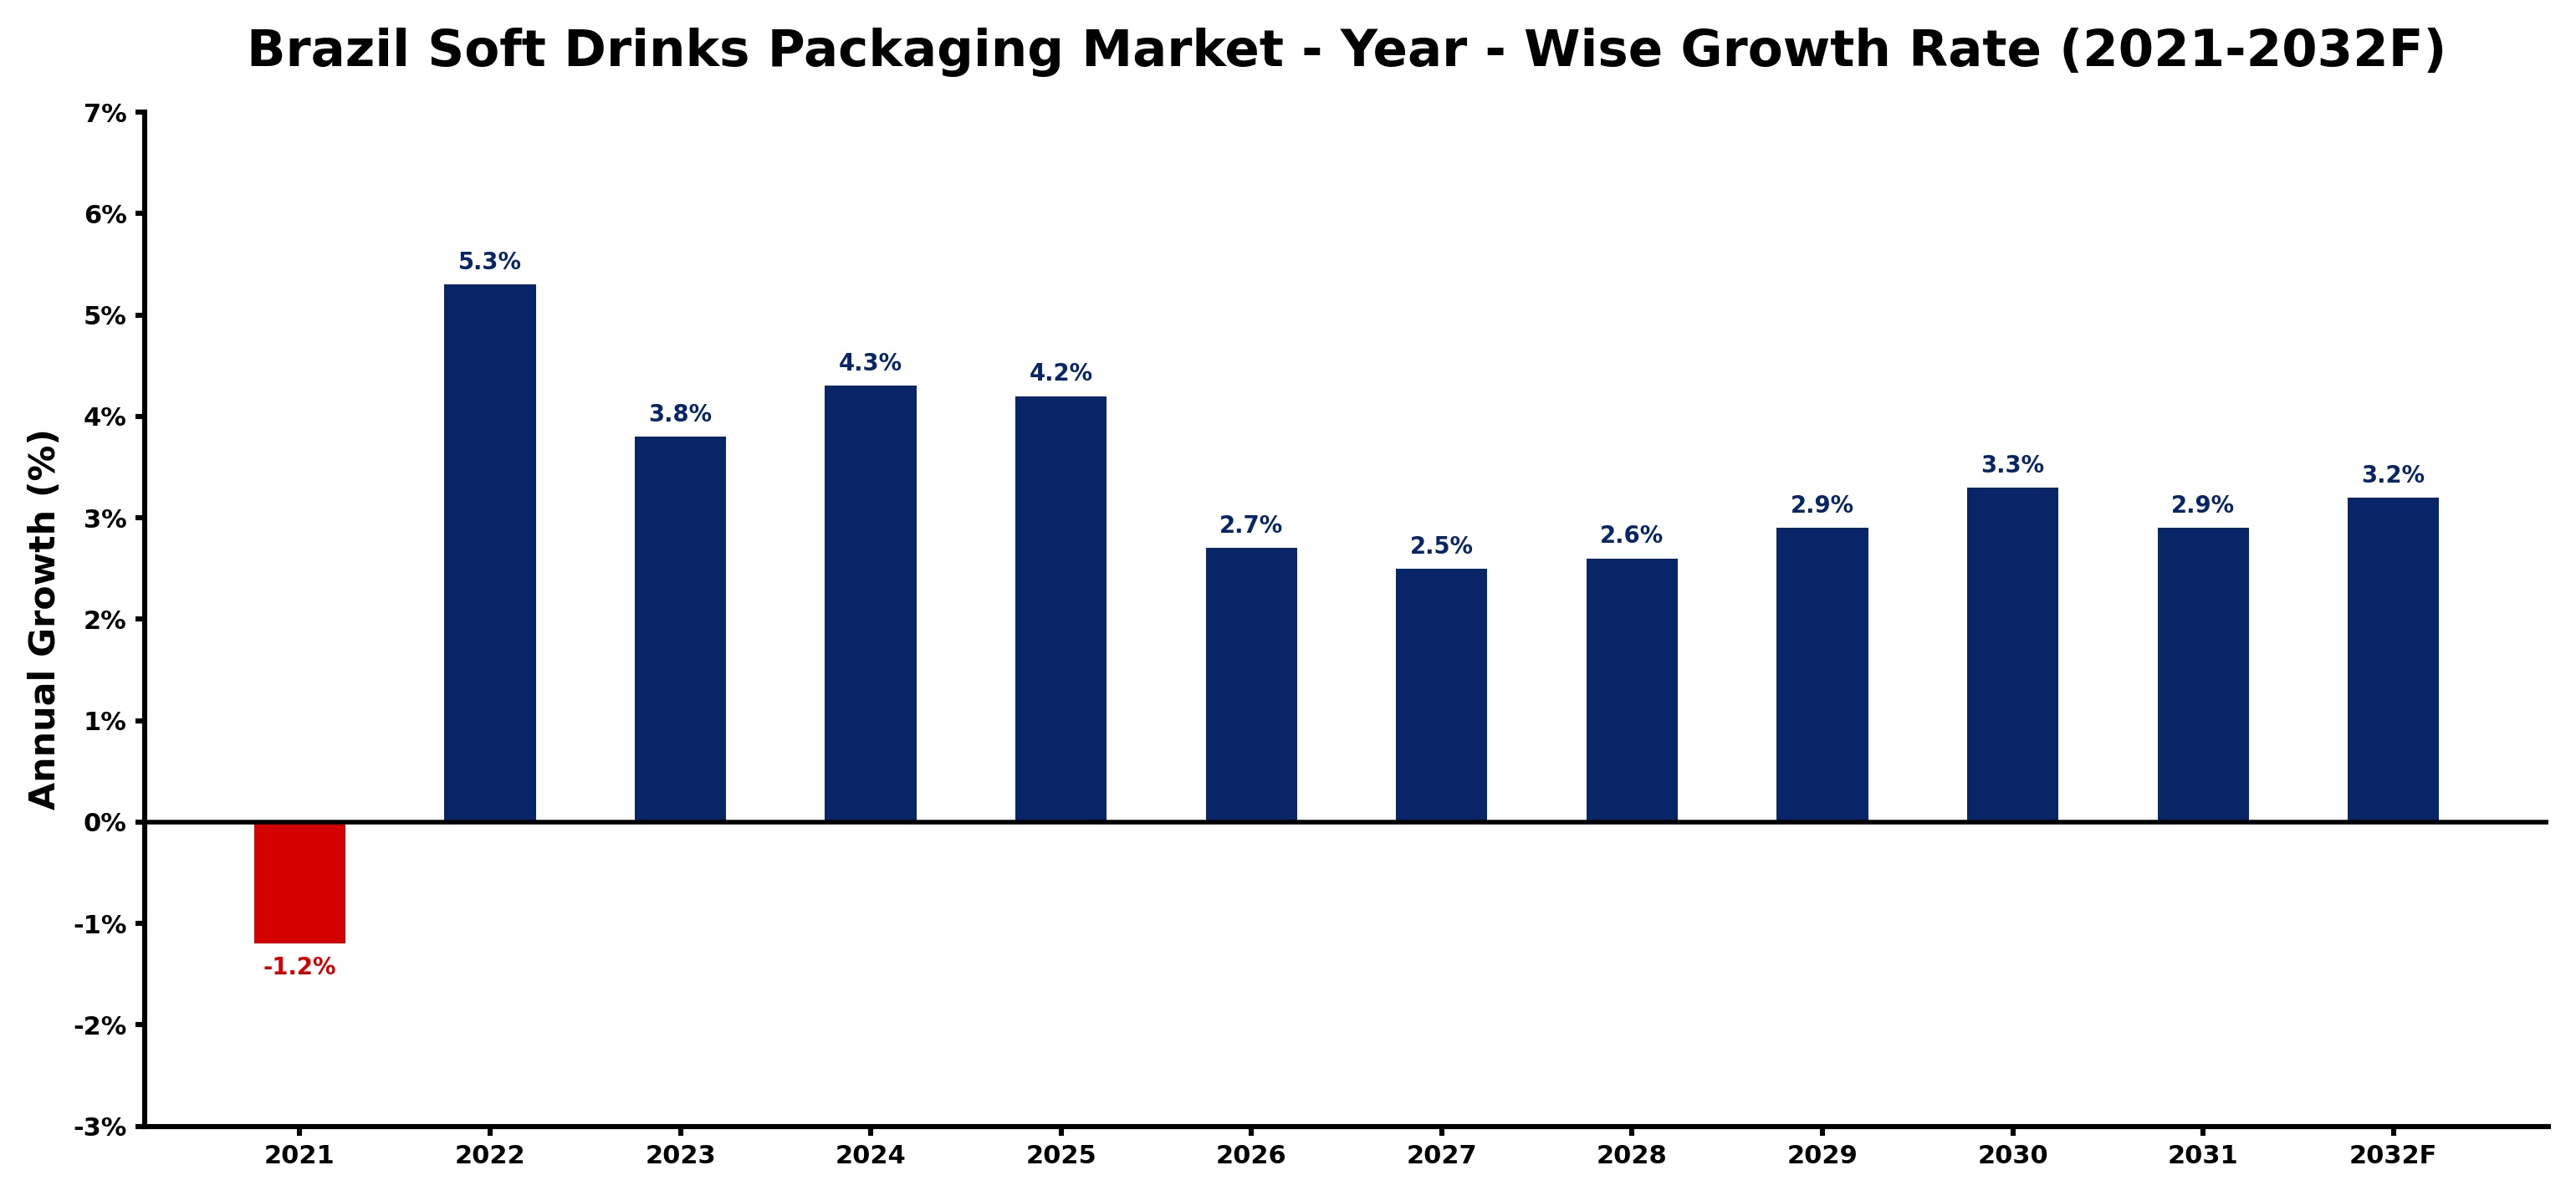
The table below presents the year‑wise growth rates along with the key drivers influencing the market
| Year | Growth Rate | Major Drivers |
| 2021 | -1.2% | Consumer spending decreased significantly |
| 2022 | 5.3% | Health-conscious trends drove demand |
| 2023 | 3.8% | Sustainability initiatives enhanced packaging |
| 2024 | 4.3% | E-commerce growth expanded reach |
| 2025 | 4.2% | Innovative packaging designs attracted buyers |
| 2026 | 2.7% | Local sourcing gained popularity rapidly |
| 2027 | 2.5% | Flavored beverages increased market interest |
| 2028 | 2.6% | Convenience packaging improved usability |
| 2029 | 2.9% | Brand collaborations enhanced visibility |
| 2030 | 3.3% | Functional beverages captured consumer attention |
| 2031 | 2.9% | Seasonal promotions drove sales growth |
| 2032 | 3.2% | Recyclable materials gained consumer preference |
Note - Market size estimations and growth projections presented in this report are based on 6Wresearch’s advanced forecasting approach, validated with industry datasets as of June 2026.
Brazil Soft Drinks Packaging Market Synopsis
In Brazil, the soft drinks packaging market is heavily influenced by consumer demand for convenience and portability, evident in the growing popularity of lightweight PET bottles. As these bottles dominate the market, manufacturers are prioritizing not only functionality but also eco-friendliness, aiming to develop recyclable solutions that resonate with environmentally conscious consumers.
Additionally, interactive and uniquely designed packaging is emerging as a key differentiation strategy among brands seeking to capture market share. With heightened competition, companies are increasingly investing in marketing campaigns that highlight their sustainable practices and innovative packaging designs, effectively engaging consumers and enhancing brand loyalty.
Brazil Soft Drinks Packaging Market Key Takeaways
- Dominance of lightweight PET bottles, driving convenience and recyclability in packaging.
- Growing emphasis on eco-friendly materials in response to consumer sustainability concerns.
- Innovative packaging designs crucial for brand differentiation amid intense competition.
- Advancements in technology fostering enhanced consumer engagement through interactive solutions.
- Government initiatives aimed at promoting recycling and sustainable packaging materials impacting market dynamics.
Evaluation of Restraints in Brazil Soft Drinks Packaging Market
Despite the promising growth outlook, the Brazil Soft Drinks Packaging Market faces certain restraints that may hinder progress. A significant challenge is the pressing need for sustainability, as increasing consumer awareness about packaging waste intensifies scrutiny on manufacturers. Companies must navigate the complexities of developing eco-friendly solutions while maintaining affordability and convenience. Additionally, differentiating brands in a crowded marketplace requires substantial investment in innovative designs and effective marketing strategies, which can pose a barrier for smaller entities.
Brazil Soft Drinks Packaging Market Trends
The soft drinks packaging landscape in Brazil is currently shaped by several emerging trends. A notable trend is the shift towards biodegradable and compostable packaging options, reflecting heightened environmental consciousness among consumers. Moreover, there’s a growing interest in smart packaging technologies that enhance consumer interaction, providing features like QR codes for product information and promotions. These trends are driving manufacturers to rethink traditional packaging approaches, aligning them with modern consumer values and expectations.
Brazil Soft Drinks Packaging Market Opportunities
The potential for growth within the Brazil Soft Drinks Packaging Market is substantial, particularly for brands that can successfully integrate sustainability into their packaging strategies. Opportunities abound in the development of innovative materials that prioritize both functionality and environmental impact. Additionally, as the demand for health-conscious beverages increases, packaging that communicates product benefits effectively can create significant market advantages. The emphasis on convenience is also opening avenues for portable packaging solutions tailored to on-the-go consumers.
Government Initiatives in the Brazil Soft Drinks Packaging Market
Government policies in Brazil are increasingly focused on reducing the environmental footprint of packaging within the soft drinks sector. Initiatives promoting recycling and the use of eco-friendly materials are being encouraged through regulations that require clear labeling for recycling practices. Furthermore, public spending is directed towards infrastructure that supports recycling initiatives, fostering an environment conducive to sustainable packaging solutions. These governmental efforts play a pivotal role in shaping the future of the soft drinks packaging market.
Future Insights of the Brazil Soft Drinks Packaging Market
Looking ahead to the period between 2026 and 2032, the Brazil Soft Drinks Packaging Market is expected to evolve significantly. Innovations in sustainable packaging will likely be at the forefront, as brands seek to address consumer demands for environmentally responsible solutions. The integration of technology into packaging will also continue to gain momentum, enhancing consumer engagement and providing manufacturers with valuable insights into consumer behavior. Overall, the market is poised for steady growth, driven by a confluence of sustainability, convenience, and technological advancements.
Brazil Soft Drinks Packaging Market Latest Developments (May 2025 - June 2026)
Recent developments in the Brazil Soft Drinks Packaging Market indicate a strong focus on sustainable packaging solutions. Many manufacturers are exploring innovative materials and designs to meet the growing consumer demand for eco-friendly products. Additionally, there has been a surge in collaborative efforts between brands and recycling organizations to improve packaging waste management. This period is witnessing a noticeable shift towards interactive packaging, further enhancing consumer engagement with products.
Brazil Soft Drinks Packaging Market - Key Attractiveness of the Report
- 10 Years of Market Numbers
- Historical Data Starting from 2022 to 2025
- Base Year: 2025
- Forecast Data until 2032
- Key Performance Indicators Impacting the Market
- Major Upcoming Developments and Projects
Key Highlights of the Report:
- Brazil Soft Drinks Packaging Market Outlook
- Market Size of Brazil Soft Drinks Packaging Market, 2025
- Forecast of Brazil Soft Drinks Packaging Market, 2032
- Historical Data and Forecast of Brazil Soft Drinks Packaging Revenues & Volume for the Period 2022-2032F
- Brazil Soft Drinks Packaging Market Trend Evolution
- Brazil Soft Drinks Packaging Market Drivers and Challenges
- Brazil Soft Drinks Packaging Price Trends
- Brazil Soft Drinks Packaging Porter's Five Forces
- Brazil Soft Drinks Packaging Industry Life Cycle
- Historical Data and Forecast of Brazil Soft Drinks Packaging Market Revenues & Volume By Material for the Period 2022-2032F
- Historical Data and Forecast of Brazil Soft Drinks Packaging Market Revenues & Volume By Paper for the Period 2022-2032F
- Historical Data and Forecast of Brazil Soft Drinks Packaging Market Revenues & Volume By Plastic for the Period 2022-2032F
- Historical Data and Forecast of Brazil Soft Drinks Packaging Market Revenues & Volume By Metal for the Period 2022-2032F
- Historical Data and Forecast of Brazil Soft Drinks Packaging Market Revenues & Volume By Glass for the Period 2022-2032F
- Historical Data and Forecast of Brazil Soft Drinks Packaging Market Revenues & Volume By for the Period 2022-2032F
- Historical Data and Forecast of Brazil Soft Drinks Packaging Market Revenues & Volume By for the Period 2022-2032F
- Historical Data and Forecast of Brazil Soft Drinks Packaging Market Revenues & Volume By Product Type for the Period 2022-2032F
- Historical Data and Forecast of Brazil Soft Drinks Packaging Market Revenues & Volume By Cans for the Period 2022-2032F
- Historical Data and Forecast of Brazil Soft Drinks Packaging Market Revenues & Volume By Boxes for the Period 2022-2032F
- Historical Data and Forecast of Brazil Soft Drinks Packaging Market Revenues & Volume By Bottles for the Period 2022-2032F
- Historical Data and Forecast of Brazil Soft Drinks Packaging Market Revenues & Volume By Cartons for the Period 2022-2032F
- Historical Data and Forecast of Brazil Soft Drinks Packaging Market Revenues & Volume By for the Period 2022-2032F
- Historical Data and Forecast of Brazil Soft Drinks Packaging Market Revenues & Volume By for the Period 2022-2032F
- Historical Data and Forecast of Brazil Soft Drinks Packaging Market Revenues & Volume By Capacity for the Period 2022-2032F
- Historical Data and Forecast of Brazil Soft Drinks Packaging Market Revenues & Volume By Up to 100 ml for the Period 2022-2032F
- Historical Data and Forecast of Brazil Soft Drinks Packaging Market Revenues & Volume By 100 to 250 ml for the Period 2022-2032F
- Historical Data and Forecast of Brazil Soft Drinks Packaging Market Revenues & Volume By 250 to 500 ml for the Period 2022-2032F
- Historical Data and Forecast of Brazil Soft Drinks Packaging Market Revenues & Volume By 500 to 1000 ml for the Period 2022-2032F
- Historical Data and Forecast of Brazil Soft Drinks Packaging Market Revenues & Volume By 1000 to 2000 ml for the Period 2022-2032F
- Historical Data and Forecast of Brazil Soft Drinks Packaging Market Revenues & Volume By Above 2000 ml for the Period 2022-2032F
- Historical Data and Forecast of Brazil Soft Drinks Packaging Market Revenues & Volume By Application for the Period 2022-2032F
- Historical Data and Forecast of Brazil Soft Drinks Packaging Market Revenues & Volume By Carbonated soft drinks for the Period 2022-2032F
- Historical Data and Forecast of Brazil Soft Drinks Packaging Market Revenues & Volume By Functional Drinks for the Period 2022-2032F
- Historical Data and Forecast of Brazil Soft Drinks Packaging Market Revenues & Volume By Sport Drinks for the Period 2022-2032F
- Historical Data and Forecast of Brazil Soft Drinks Packaging Market Revenues & Volume By Energy Drinks for the Period 2022-2032F
- Historical Data and Forecast of Brazil Soft Drinks Packaging Market Revenues & Volume By Others for the Period 2022-2032F
- Historical Data and Forecast of Brazil Soft Drinks Packaging Market Revenues & Volume By Juices for the Period 2022-2032F
- Brazil Soft Drinks Packaging Import Export Trade Statistics
- Market Opportunity Assessment By Material
- Market Opportunity Assessment By Product Type
- Market Opportunity Assessment By Capacity
- Market Opportunity Assessment By Application
- Brazil Soft Drinks Packaging Top Companies Market Share
- Brazil Soft Drinks Packaging Competitive Benchmarking By Technical and Operational Parameters
- Brazil Soft Drinks Packaging Company Profiles
- Brazil Soft Drinks Packaging Key Strategic Recommendations
Brazil Soft Drinks Packaging Market - Frequently Asked Questions
The market is witnessing a notable shift towards sustainability, convenience, and health-oriented products, influencing packaging designs and materials.
The market was estimated at USD 323 Million in 2025 and is projected to reach USD 386 Million by 2032, growing at a CAGR of 2.6% from 2026 to 2032.
There’s an increasing trend towards biodegradable and compostable materials, as well as smart packaging technologies that enhance consumer interaction.
Government initiatives are promoting recycling, eco-friendly materials, and clear labeling practices, which are shaping market dynamics and encouraging sustainable practices.
Brands must navigate sustainability concerns and fierce competition, necessitating innovative designs and effective marketing strategies to stand out in a crowded marketplace.
6Wresearch actively monitors the Brazil Soft Drinks Packaging Market and publishes its comprehensive annual report, highlighting emerging trends, growth drivers, revenue analysis, and forecast outlook. Our insights help businesses to make data-backed strategic decisions with ongoing market dynamics. Our analysts track relevent industries related to the Brazil Soft Drinks Packaging Market, allowing our clients with actionable intelligence and reliable forecasts tailored to emerging regional needs.
Yes, we provide customisation as per your requirements. To learn more, feel free to contact us on sales@6wresearch.com
1 Executive Summary |
2 Introduction |
2.1 Key Highlights of the Report |
2.2 Report Description |
2.3 Market Scope & Segmentation |
2.4 Research Methodology |
2.5 Assumptions |
3 Brazil Soft Drinks Packaging Market Overview |
3.1 Brazil Country Macro Economic Indicators |
3.2 Brazil Soft Drinks Packaging Market Revenues & Volume, 2022 & 2032F |
3.3 Brazil Soft Drinks Packaging Market - Industry Life Cycle |
3.4 Brazil Soft Drinks Packaging Market - Porter's Five Forces |
3.5 Brazil Soft Drinks Packaging Market Revenues & Volume Share, By Material, 2022 & 2032F |
3.6 Brazil Soft Drinks Packaging Market Revenues & Volume Share, By Product Type, 2022 & 2032F |
3.7 Brazil Soft Drinks Packaging Market Revenues & Volume Share, By Capacity, 2022 & 2032F |
3.8 Brazil Soft Drinks Packaging Market Revenues & Volume Share, By Application, 2022 & 2032F |
4 Brazil Soft Drinks Packaging Market Dynamics |
4.1 Impact Analysis |
4.2 Market Drivers |
4.2.1 Increasing demand for convenience and on-the-go consumption |
4.2.2 Growing health consciousness among consumers leading to a shift towards healthier beverage options |
4.2.3 Innovation in packaging materials and designs to enhance product appeal |
4.3 Market Restraints |
4.3.1 Regulatory restrictions on the use of certain packaging materials |
4.3.2 Fluctuating raw material prices impacting production costs |
4.3.3 Environmental concerns leading to a push for sustainable packaging solutions |
5 Brazil Soft Drinks Packaging Market Trends |
6 Brazil Soft Drinks Packaging Market, By Types |
6.1 Brazil Soft Drinks Packaging Market, By Material |
6.1.1 Overview and Analysis |
6.1.2 Brazil Soft Drinks Packaging Market Revenues & Volume, By Material, 2022-2032F |
6.1.3 Brazil Soft Drinks Packaging Market Revenues & Volume, By Paper, 2022-2032F |
6.1.4 Brazil Soft Drinks Packaging Market Revenues & Volume, By Plastic, 2022-2032F |
6.1.5 Brazil Soft Drinks Packaging Market Revenues & Volume, By Metal, 2022-2032F |
6.1.6 Brazil Soft Drinks Packaging Market Revenues & Volume, By Glass, 2022-2032F |
6.1.7 Brazil Soft Drinks Packaging Market Revenues & Volume, By , 2022-2032F |
6.1.8 Brazil Soft Drinks Packaging Market Revenues & Volume, By , 2022-2032F |
6.2 Brazil Soft Drinks Packaging Market, By Product Type |
6.2.1 Overview and Analysis |
6.2.2 Brazil Soft Drinks Packaging Market Revenues & Volume, By Cans, 2022-2032F |
6.2.3 Brazil Soft Drinks Packaging Market Revenues & Volume, By Boxes, 2022-2032F |
6.2.4 Brazil Soft Drinks Packaging Market Revenues & Volume, By Bottles, 2022-2032F |
6.2.5 Brazil Soft Drinks Packaging Market Revenues & Volume, By Cartons, 2022-2032F |
6.2.6 Brazil Soft Drinks Packaging Market Revenues & Volume, By , 2022-2032F |
6.2.7 Brazil Soft Drinks Packaging Market Revenues & Volume, By , 2022-2032F |
6.3 Brazil Soft Drinks Packaging Market, By Capacity |
6.3.1 Overview and Analysis |
6.3.2 Brazil Soft Drinks Packaging Market Revenues & Volume, By Up to 100 ml, 2022-2032F |
6.3.3 Brazil Soft Drinks Packaging Market Revenues & Volume, By 100 to 250 ml, 2022-2032F |
6.3.4 Brazil Soft Drinks Packaging Market Revenues & Volume, By 250 to 500 ml, 2022-2032F |
6.3.5 Brazil Soft Drinks Packaging Market Revenues & Volume, By 500 to 1000 ml, 2022-2032F |
6.3.6 Brazil Soft Drinks Packaging Market Revenues & Volume, By 1000 to 2000 ml, 2022-2032F |
6.3.7 Brazil Soft Drinks Packaging Market Revenues & Volume, By Above 2000 ml, 2022-2032F |
6.4 Brazil Soft Drinks Packaging Market, By Application |
6.4.1 Overview and Analysis |
6.4.2 Brazil Soft Drinks Packaging Market Revenues & Volume, By Carbonated soft drinks, 2022-2032F |
6.4.3 Brazil Soft Drinks Packaging Market Revenues & Volume, By Functional Drinks, 2022-2032F |
6.4.4 Brazil Soft Drinks Packaging Market Revenues & Volume, By Sport Drinks, 2022-2032F |
6.4.5 Brazil Soft Drinks Packaging Market Revenues & Volume, By Energy Drinks, 2022-2032F |
6.4.6 Brazil Soft Drinks Packaging Market Revenues & Volume, By Others, 2022-2032F |
6.4.7 Brazil Soft Drinks Packaging Market Revenues & Volume, By Juices, 2022-2032F |
7 Brazil Soft Drinks Packaging Market Import-Export Trade Statistics |
7.1 Brazil Soft Drinks Packaging Market Export to Major Countries |
7.2 Brazil Soft Drinks Packaging Market Imports from Major Countries |
8 Brazil Soft Drinks Packaging Market Key Performance Indicators |
8.1 Percentage of packaging materials sourced from sustainable or recyclable sources |
8.2 Adoption rate of innovative packaging designs in the soft drinks market |
8.3 Efficiency of packaging processes in terms of minimizing waste and reducing environmental impact |
9 Brazil Soft Drinks Packaging Market - Opportunity Assessment |
9.1 Brazil Soft Drinks Packaging Market Opportunity Assessment, By Material, 2022 & 2032F |
9.2 Brazil Soft Drinks Packaging Market Opportunity Assessment, By Product Type, 2022 & 2032F |
9.3 Brazil Soft Drinks Packaging Market Opportunity Assessment, By Capacity, 2022 & 2032F |
9.4 Brazil Soft Drinks Packaging Market Opportunity Assessment, By Application, 2022 & 2032F |
10 Brazil Soft Drinks Packaging Market - Competitive Landscape |
10.1 Brazil Soft Drinks Packaging Market Revenue Share, By Companies, 2025 |
10.2 Brazil Soft Drinks Packaging Market Competitive Benchmarking, By Operating and Technical Parameters |
11 Company Profiles |
12 Recommendations |
13 Disclaimer |
Global Go To Market Strategy - 2030
Export potential enables firms to identify high-growth global markets with greater confidence by combining advanced trade intelligence with a structured quantitative methodology. The framework analyzes emerging demand trends and country-level import patterns while integrating macroeconomic and trade datasets such as GDP and population forecasts, bilateral import–export flows, tariff structures, elasticity differentials between developed and developing economies, geographic distance, and import demand projections. Using weighted trade values from 2020–2024 as the base period to project country-to-country export potential for 2030, these inputs are operationalized through calculated drivers such as gravity model parameters, tariff impact factors, and projected GDP per-capita growth. Through an analysis of hidden potentials, demand hotspots, and market conditions that are most favorable to success, this method enables firms to focus on target countries, maximize returns, and global expansion with data, backed by accuracy.
By factoring in the projected importer demand gap that is currently unmet and could be potential opportunity, it identifies the potential for the Exporter (Country) among 190 countries, against the general trade analysis, which identifies the biggest importer or exporter.
To discover high-growth global markets and optimize your business strategy:
Click Here
Pricing
- Single User License$ 1,995
- Department License$ 2,400
- Site License$ 3,120
- Global License$ 3,795

Leadership Perspectives from Industry Events
Search
Thought Leadership and Analyst Meet


Our Clients
6WResearch In News
- India Air Conditioner Market Set for Strong Rebound in 2026 After Weather-Led Correction and GST-Driven Recovery: 6Wresearch
- ADAS in India: How Automatic Emergency Braking, Blind Spot Detection & Driver Monitoring are Transforming Road Safety
- Doha a strategic location for EV manufacturing hub: IPA Qatar
- Demand for luxury TVs surging in the GCC, says Samsung
- Empowering Growth: The Thriving Journey of Bangladesh’s Cable Industry
- Demand for luxury TVs surging in the GCC, says Samsung
Latest Reports
- Nicaragua RPG Gaming Market (2026-2032)
- New Zealand RPG Gaming Market (2026-2032)
- Netherlands RPG Gaming Market (2026-2032)
- Nauru RPG Gaming Market (2026-2032)
- Namibia RPG Gaming Market (2026-2032)
- Mozambique RPG Gaming Market (2026-2032)
- Montenegro RPG Gaming Market (2026-2032)
- Mongolia RPG Gaming Market (2026-2032)
- Monaco RPG Gaming Market (2026-2032)
- Micronesia RPG Gaming Market (2026-2032)
Industry Events and Analyst Meet

EV India Expo 2026

HIMTEX 2026

India Refining Summit 2026

India EV Show 2026

EV tech India Expo 2026
Whitepaper
- Middle East & Africa Commercial Security Market Click here to view more.
- Middle East & Africa Fire Safety Systems & Equipment Market Click here to view more.
- GCC Drone Market Click here to view more.
- Middle East Lighting Fixture Market Click here to view more.
- GCC Physical & Perimeter Security Market Click here to view more.