Bulgaria Agronomic Amino Acids Market (2026-2032) | Outlook, Trends, Forecast, Segmentation, Size & Revenue, Growth, Companies, Industry, Competitive Landscape, Share, Analysis, Value
Market Forecast By Type (Lysine, Thymine, Methionine, Glutamic Acid, Alanine, Leucine, Arginine, Others), By Source (Plant-based, Animal-based, Synthetic, Treatment Method, Foliar, Seed, Soil, Others), By Application (Soil Amendment, Chlorophyll Synthesis, Roots Development, Bud Growth and Leaves Development, Crop Resistance, Ripening, Others) And Competitive Landscape
| Product Code: ETC6541323 | Publication Date: Sep 2024 | Updated Date: Apr 2026 | Product Type: Market Research Report | |
| Publisher: 6Wresearch | Author: Summon Dutta | No. of Pages: 75 | No. of Figures: 35 | No. of Tables: 20 |
Bulgaria Agronomic Amino Acids Market Size (2020-2030)
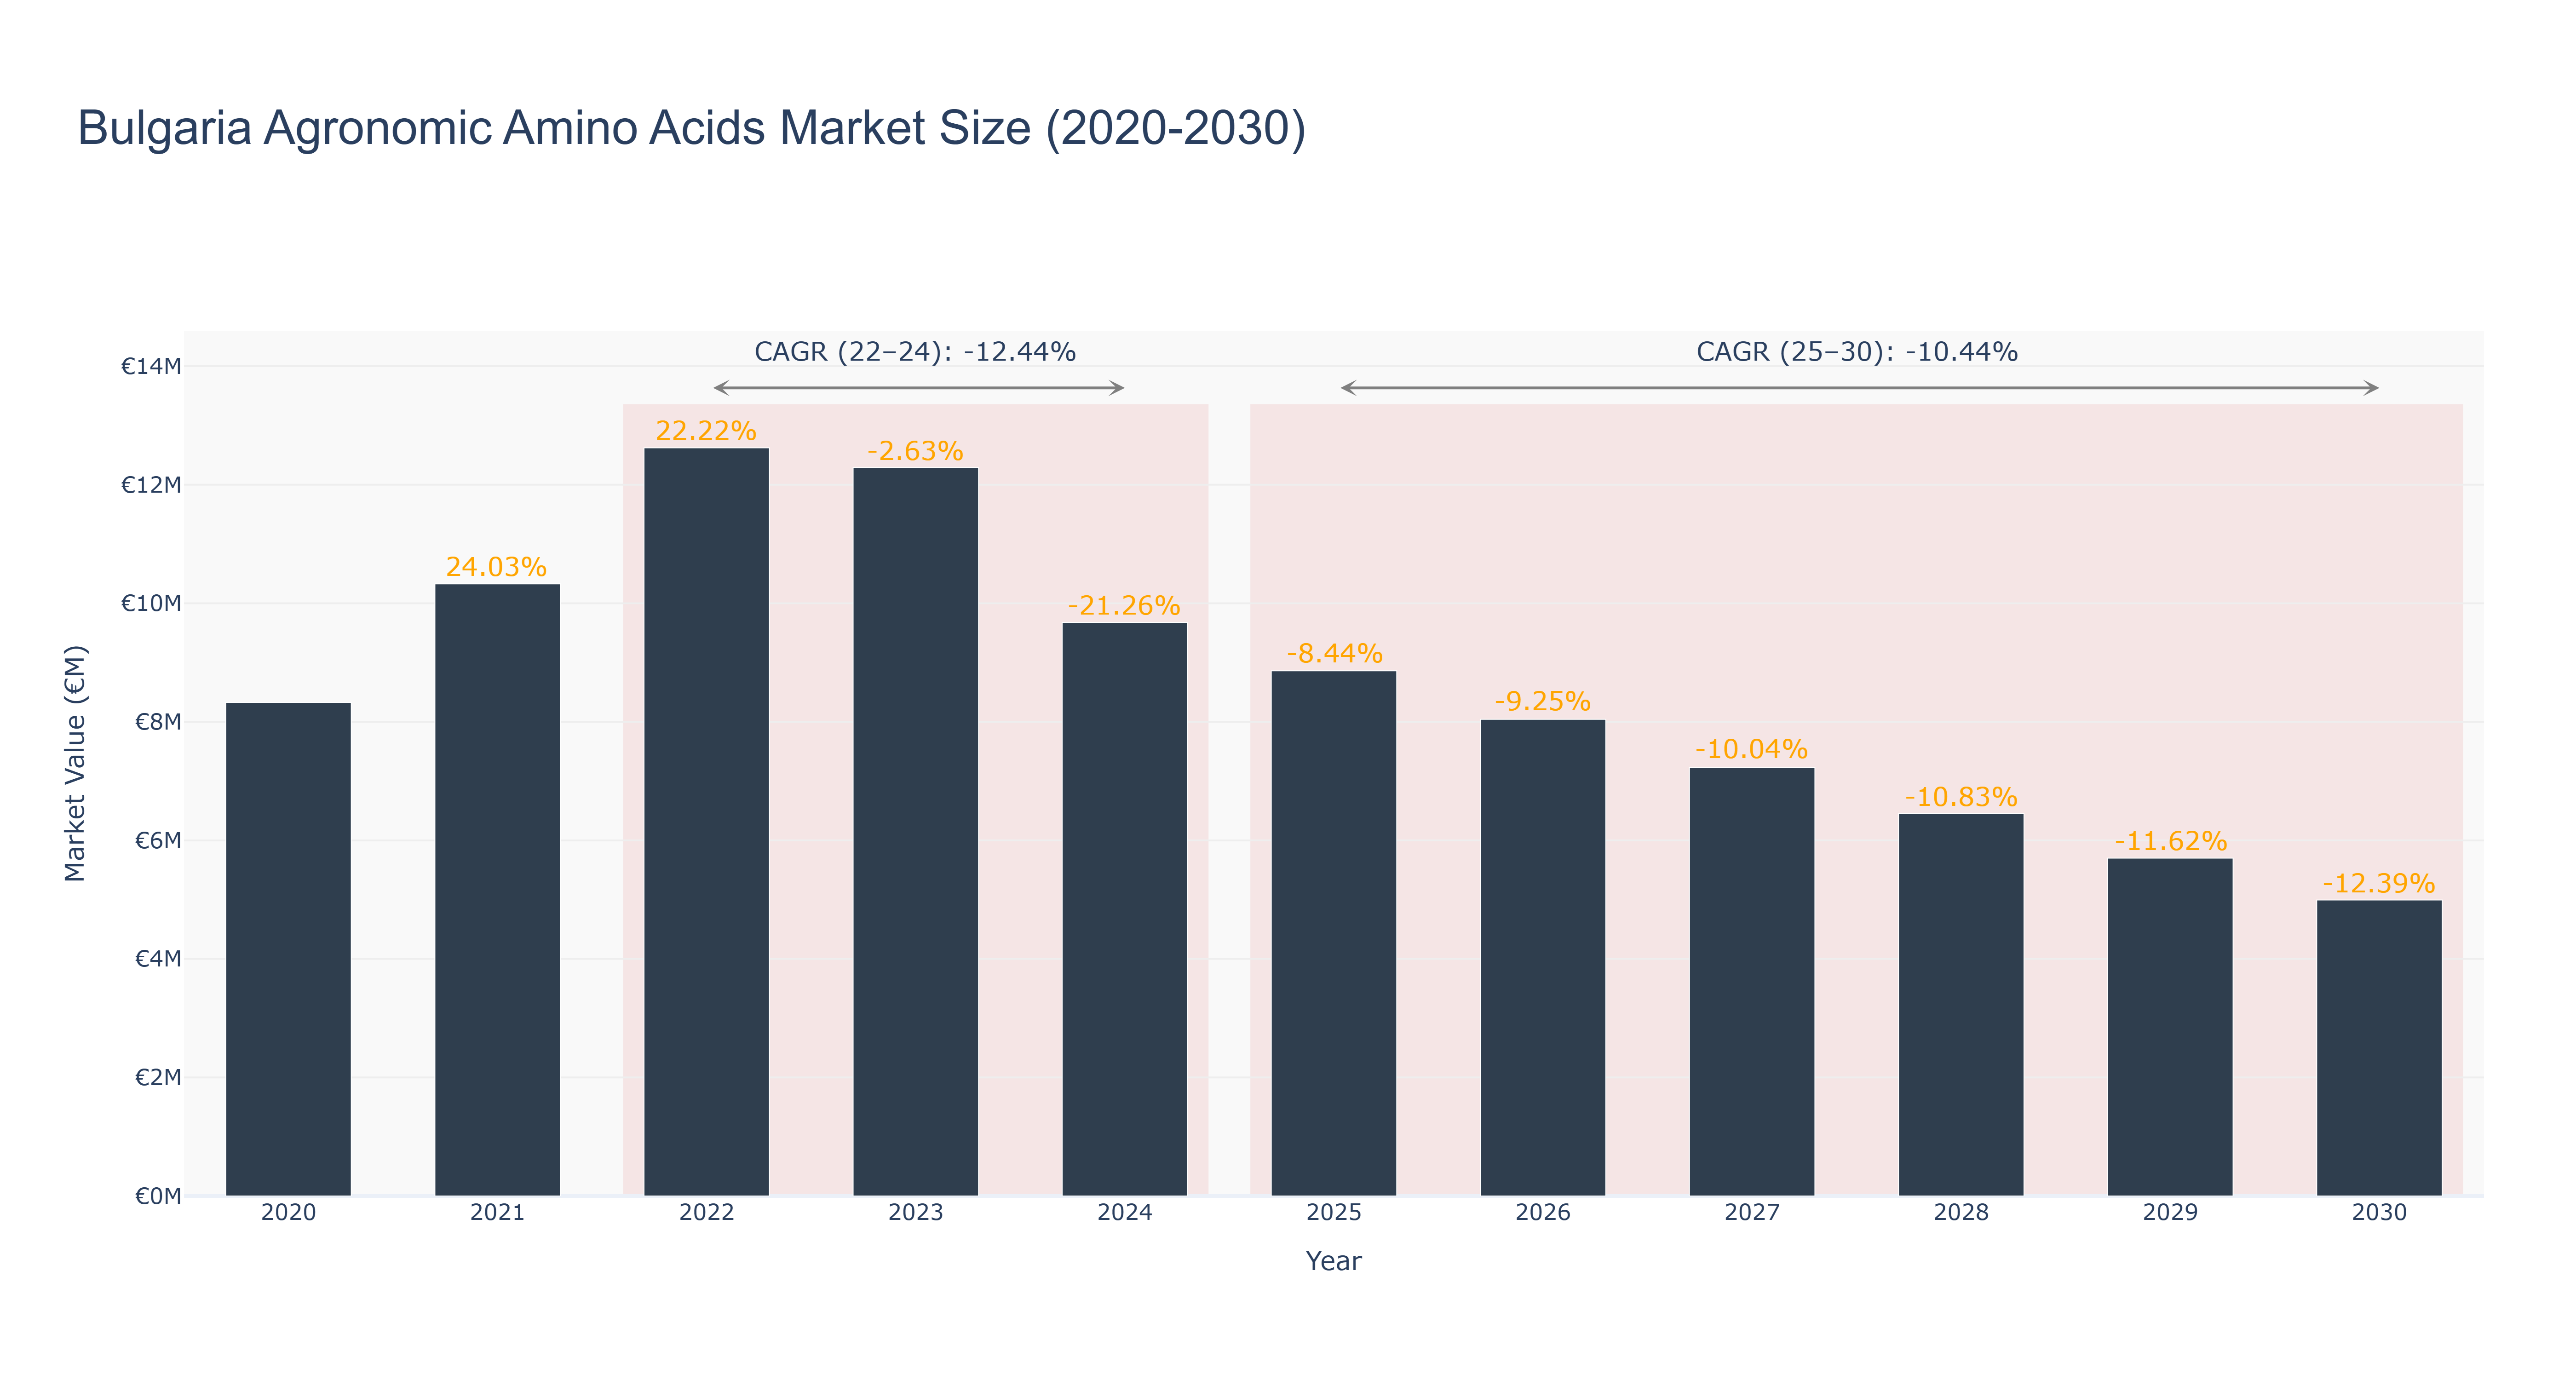
The Bulgaria Agronomic Amino Acids Market experienced a peak market size of €12.62 million in 2022. The market size decreased to €9.68 million in 2024, reflecting a negative growth trend. Forecasted market sizes show a continued decline, with a projected size of €4.99 million in 2030. The CAGR for the period 2022-24 is -12.44%, and for 2025-30 is -10.44%. The downward trend in market size can be attributed to factors such as changing consumer preferences, economic conditions, and technological advancements in alternative products. Looking ahead, upcoming projects in sustainable agriculture practices and government initiatives promoting organic farming are expected to influence the market positively. These developments aim to enhance product quality and market competitiveness in the coming years.
Bulgaria Agronomic Amino Acids Market: Production & Trade Performance (2019-2025)
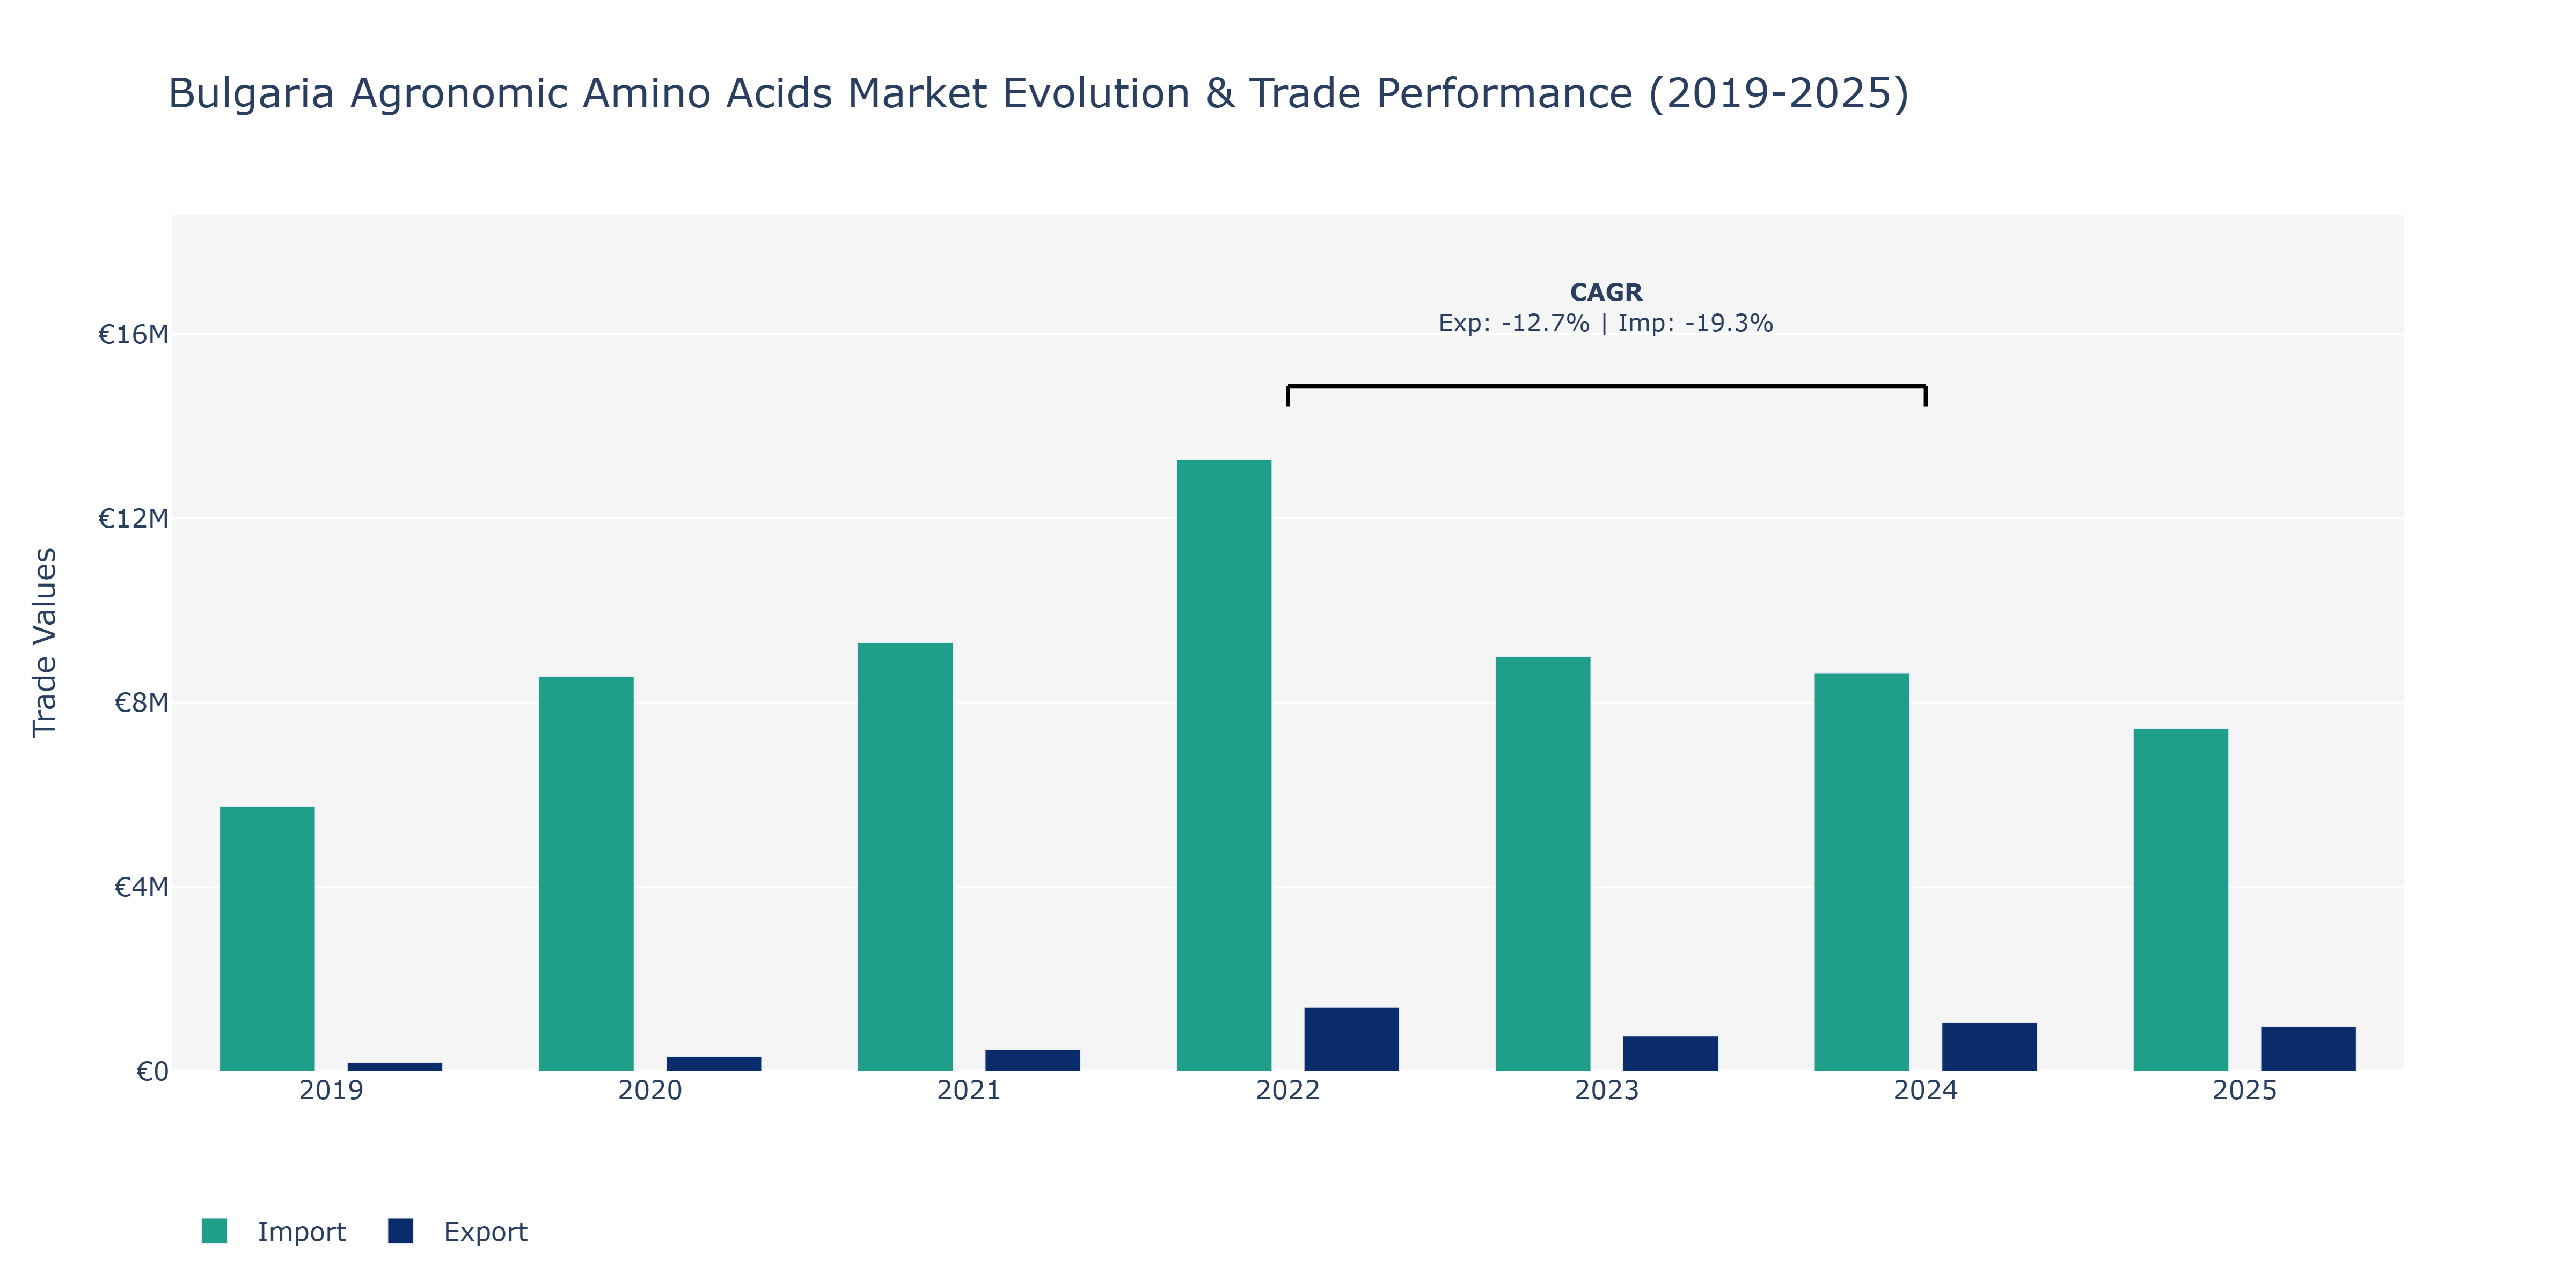
The Bulgaria Agronomic Amino Acids Market saw notable fluctuations in both Exports and Imports from 2019 to 2025. Exports started at €198.58 thousand in 2019, experienced a substantial increase in 2022 to €1.39 million, before declining to €968.27 thousand in 2025. Imports, on the other hand, began at €5.74 million in 2019, peaked at €9.3 million in 2021, and then gradually decreased to €7.43 million in 2025. The peak in exports in 2022 could be attributed to increased demand for Bulgarian agronomic amino acids internationally, potentially driven by advancements in production technologies or favorable trade agreements. The fluctuation in imports may reflect varying domestic consumption patterns, global market conditions, or shifts in suppliers' competitiveness. The market's resilience in the face of declining imports post-peak years suggests evolving domestic production capabilities or strategic sourcing decisions by market players.
Key Highlights of the Report:
- Bulgaria Agronomic Amino Acids Market Outlook
- Market Size of Bulgaria Agronomic Amino Acids Market, 2025
- Forecast of Bulgaria Agronomic Amino Acids Market, 2032
- Historical Data and Forecast of Bulgaria Agronomic Amino Acids Revenues & Volume for the Period 2022 - 2032
- Bulgaria Agronomic Amino Acids Market Trend Evolution
- Bulgaria Agronomic Amino Acids Market Drivers and Challenges
- Bulgaria Agronomic Amino Acids Price Trends
- Bulgaria Agronomic Amino Acids Porter's Five Forces
- Bulgaria Agronomic Amino Acids Industry Life Cycle
- Historical Data and Forecast of Bulgaria Agronomic Amino Acids Market Revenues & Volume By Type for the Period 2022 - 2032
- Historical Data and Forecast of Bulgaria Agronomic Amino Acids Market Revenues & Volume By Lysine for the Period 2022 - 2032
- Historical Data and Forecast of Bulgaria Agronomic Amino Acids Market Revenues & Volume By Thymine for the Period 2022 - 2032
- Historical Data and Forecast of Bulgaria Agronomic Amino Acids Market Revenues & Volume By Methionine for the Period 2022 - 2032
- Historical Data and Forecast of Bulgaria Agronomic Amino Acids Market Revenues & Volume By Glutamic Acid for the Period 2022 - 2032
- Historical Data and Forecast of Bulgaria Agronomic Amino Acids Market Revenues & Volume By Alanine for the Period 2022 - 2032
- Historical Data and Forecast of Bulgaria Agronomic Amino Acids Market Revenues & Volume By Leucine for the Period 2022 - 2032
- Historical Data and Forecast of Bulgaria Agronomic Amino Acids Market Revenues & Volume By Arginine for the Period 2022 - 2032
- Historical Data and Forecast of Bulgaria Lysine Agronomic Amino Acids Market Revenues & Volume By Others for the Period 2022 - 2032
- Historical Data and Forecast of Bulgaria Agronomic Amino Acids Market Revenues & Volume By Source for the Period 2022 - 2032
- Historical Data and Forecast of Bulgaria Agronomic Amino Acids Market Revenues & Volume By Plant-based for the Period 2022 - 2032
- Historical Data and Forecast of Bulgaria Agronomic Amino Acids Market Revenues & Volume By Animal-based for the Period 2022 - 2032
- Historical Data and Forecast of Bulgaria Agronomic Amino Acids Market Revenues & Volume By Synthetic for the Period 2022 - 2032
- Historical Data and Forecast of Bulgaria Agronomic Amino Acids Market Revenues & Volume By Treatment Method for the Period 2022 - 2032
- Historical Data and Forecast of Bulgaria Agronomic Amino Acids Market Revenues & Volume By Foliar for the Period 2022 - 2032
- Historical Data and Forecast of Bulgaria Agronomic Amino Acids Market Revenues & Volume By Seed for the Period 2022 - 2032
- Historical Data and Forecast of Bulgaria Agronomic Amino Acids Market Revenues & Volume By Soil for the Period 2022 - 2032
- Historical Data and Forecast of Bulgaria Agronomic Amino Acids Market Revenues & Volume By Others for the Period 2022 - 2032
- Historical Data and Forecast of Bulgaria Agronomic Amino Acids Market Revenues & Volume By Application for the Period 2022 - 2032
- Historical Data and Forecast of Bulgaria Agronomic Amino Acids Market Revenues & Volume By Soil Amendment for the Period 2022 - 2032
- Historical Data and Forecast of Bulgaria Agronomic Amino Acids Market Revenues & Volume By Chlorophyll Synthesis for the Period 2022 - 2032
- Historical Data and Forecast of Bulgaria Agronomic Amino Acids Market Revenues & Volume By Roots Development for the Period 2022 - 2032
- Historical Data and Forecast of Bulgaria Agronomic Amino Acids Market Revenues & Volume By Bud Growth and Leaves Development for the Period 2022 - 2032
- Historical Data and Forecast of Bulgaria Agronomic Amino Acids Market Revenues & Volume By Crop Resistance for the Period 2022 - 2032
- Historical Data and Forecast of Bulgaria Agronomic Amino Acids Market Revenues & Volume By Ripening for the Period 2022 - 2032
- Historical Data and Forecast of Bulgaria Agronomic Amino Acids Market Revenues & Volume By Others for the Period 2022 - 2032
- Bulgaria Agronomic Amino Acids Import Export Trade Statistics
- Market Opportunity Assessment By Type
- Market Opportunity Assessment By Source
- Market Opportunity Assessment By Application
- Bulgaria Agronomic Amino Acids Top Companies Market Share
- Bulgaria Agronomic Amino Acids Competitive Benchmarking By Technical and Operational Parameters
- Bulgaria Agronomic Amino Acids Company Profiles
- Bulgaria Agronomic Amino Acids Key Strategic Recommendations
Frequently Asked Questions About the Market Study (FAQs):
6Wresearch actively monitors the Bulgaria Agronomic Amino Acids Market and publishes its comprehensive annual report, highlighting emerging trends, growth drivers, revenue analysis, and forecast outlook. Our insights help businesses to make data-backed strategic decisions with ongoing market dynamics. Our analysts track relevent industries related to the Bulgaria Agronomic Amino Acids Market, allowing our clients with actionable intelligence and reliable forecasts tailored to emerging regional needs.
Yes, we provide customisation as per your requirements. To learn more, feel free to contact us on sales@6wresearch.com
1 Executive Summary |
2 Introduction |
2.1 Key Highlights of the Report |
2.2 Report Description |
2.3 Market Scope & Segmentation |
2.4 Research Methodology |
2.5 Assumptions |
3 Bulgaria Agronomic Amino Acids Market Overview |
3.1 Bulgaria Country Macro Economic Indicators |
3.2 Bulgaria Agronomic Amino Acids Market Revenues & Volume, 2022 & 2032F |
3.3 Bulgaria Agronomic Amino Acids Market - Industry Life Cycle |
3.4 Bulgaria Agronomic Amino Acids Market - Porter's Five Forces |
3.5 Bulgaria Agronomic Amino Acids Market Revenues & Volume Share, By Type, 2022 & 2032F |
3.6 Bulgaria Agronomic Amino Acids Market Revenues & Volume Share, By Source, 2022 & 2032F |
3.7 Bulgaria Agronomic Amino Acids Market Revenues & Volume Share, By Application, 2022 & 2032F |
4 Bulgaria Agronomic Amino Acids Market Dynamics |
4.1 Impact Analysis |
4.2 Market Drivers |
4.2.1 Increasing awareness among farmers about the benefits of using agronomic amino acids in Bulgaria |
4.2.2 Growing demand for organic and sustainable farming practices in the country |
4.2.3 Government support and initiatives to promote the use of agronomic amino acids in agriculture |
4.3 Market Restraints |
4.3.1 High cost of agronomic amino acids compared to traditional fertilizers |
4.3.2 Lack of standardized regulations and guidelines for the use of agronomic amino acids in Bulgaria |
4.3.3 Limited availability of high-quality agronomic amino acid products in the market |
5 Bulgaria Agronomic Amino Acids Market Trends |
6 Bulgaria Agronomic Amino Acids Market, By Types |
6.1 Bulgaria Agronomic Amino Acids Market, By Type |
6.1.1 Overview and Analysis |
6.1.2 Bulgaria Agronomic Amino Acids Market Revenues & Volume, By Type, 2022 - 2032F |
6.1.3 Bulgaria Agronomic Amino Acids Market Revenues & Volume, By Lysine, 2022 - 2032F |
6.1.4 Bulgaria Agronomic Amino Acids Market Revenues & Volume, By Thymine, 2022 - 2032F |
6.1.5 Bulgaria Agronomic Amino Acids Market Revenues & Volume, By Methionine, 2022 - 2032F |
6.1.6 Bulgaria Agronomic Amino Acids Market Revenues & Volume, By Glutamic Acid, 2022 - 2032F |
6.1.7 Bulgaria Agronomic Amino Acids Market Revenues & Volume, By Alanine, 2022 - 2032F |
6.1.8 Bulgaria Agronomic Amino Acids Market Revenues & Volume, By Leucine, 2022 - 2032F |
6.1.9 Bulgaria Agronomic Amino Acids Market Revenues & Volume, By Others, 2022 - 2032F |
6.1.10 Bulgaria Agronomic Amino Acids Market Revenues & Volume, By Others, 2022 - 2032F |
6.2 Bulgaria Agronomic Amino Acids Market, By Source |
6.2.1 Overview and Analysis |
6.2.2 Bulgaria Agronomic Amino Acids Market Revenues & Volume, By Plant-based, 2022 - 2032F |
6.2.3 Bulgaria Agronomic Amino Acids Market Revenues & Volume, By Animal-based, 2022 - 2032F |
6.2.4 Bulgaria Agronomic Amino Acids Market Revenues & Volume, By Synthetic, 2022 - 2032F |
6.2.5 Bulgaria Agronomic Amino Acids Market Revenues & Volume, By Treatment Method, 2022 - 2032F |
6.2.6 Bulgaria Agronomic Amino Acids Market Revenues & Volume, By Foliar, 2022 - 2032F |
6.2.7 Bulgaria Agronomic Amino Acids Market Revenues & Volume, By Seed, 2022 - 2032F |
6.2.8 Bulgaria Agronomic Amino Acids Market Revenues & Volume, By Others, 2022 - 2032F |
6.2.9 Bulgaria Agronomic Amino Acids Market Revenues & Volume, By Others, 2022 - 2032F |
6.3 Bulgaria Agronomic Amino Acids Market, By Application |
6.3.1 Overview and Analysis |
6.3.2 Bulgaria Agronomic Amino Acids Market Revenues & Volume, By Soil Amendment, 2022 - 2032F |
6.3.3 Bulgaria Agronomic Amino Acids Market Revenues & Volume, By Chlorophyll Synthesis, 2022 - 2032F |
6.3.4 Bulgaria Agronomic Amino Acids Market Revenues & Volume, By Roots Development, 2022 - 2032F |
6.3.5 Bulgaria Agronomic Amino Acids Market Revenues & Volume, By Bud Growth and Leaves Development, 2022 - 2032F |
6.3.6 Bulgaria Agronomic Amino Acids Market Revenues & Volume, By Crop Resistance, 2022 - 2032F |
6.3.7 Bulgaria Agronomic Amino Acids Market Revenues & Volume, By Ripening, 2022 - 2032F |
7 Bulgaria Agronomic Amino Acids Market Import-Export Trade Statistics |
7.1 Bulgaria Agronomic Amino Acids Market Export to Major Countries |
7.2 Bulgaria Agronomic Amino Acids Market Imports from Major Countries |
8 Bulgaria Agronomic Amino Acids Market Key Performance Indicators |
8.1 Soil health improvement rate after the application of agronomic amino acids |
8.2 Increase in crop yield and quality attributed to the use of agronomic amino acids |
8.3 Number of research studies and trials conducted on the effectiveness of agronomic amino acids in Bulgarian agriculture |
9 Bulgaria Agronomic Amino Acids Market - Opportunity Assessment |
9.1 Bulgaria Agronomic Amino Acids Market Opportunity Assessment, By Type, 2022 & 2032F |
9.2 Bulgaria Agronomic Amino Acids Market Opportunity Assessment, By Source, 2022 & 2032F |
9.3 Bulgaria Agronomic Amino Acids Market Opportunity Assessment, By Application, 2022 & 2032F |
10 Bulgaria Agronomic Amino Acids Market - Competitive Landscape |
10.1 Bulgaria Agronomic Amino Acids Market Revenue Share, By Companies, 2025 |
10.2 Bulgaria Agronomic Amino Acids Market Competitive Benchmarking, By Operating and Technical Parameters |
11 Company Profiles |
12 Recommendations |
13 Disclaimer |
Export potential assessment - trade Analytics for 2030
Export potential enables firms to identify high-growth global markets with greater confidence by combining advanced trade intelligence with a structured quantitative methodology. The framework analyzes emerging demand trends and country-level import patterns while integrating macroeconomic and trade datasets such as GDP and population forecasts, bilateral import–export flows, tariff structures, elasticity differentials between developed and developing economies, geographic distance, and import demand projections. Using weighted trade values from 2020–2024 as the base period to project country-to-country export potential for 2030, these inputs are operationalized through calculated drivers such as gravity model parameters, tariff impact factors, and projected GDP per-capita growth. Through an analysis of hidden potentials, demand hotspots, and market conditions that are most favorable to success, this method enables firms to focus on target countries, maximize returns, and global expansion with data, backed by accuracy.
By factoring in the projected importer demand gap that is currently unmet and could be potential opportunity, it identifies the potential for the Exporter (Country) among 190 countries, against the general trade analysis, which identifies the biggest importer or exporter.
To discover high-growth global markets and optimize your business strategy:
Click Here
Pricing
- Single User License$ 1,995
- Department License$ 2,400
- Site License$ 3,120
- Global License$ 3,795

Search
Thought Leadership and Analyst Meet


Our Clients
Latest Reports
- Philippines Polyhydroxybutyrate-co-Hydroxyvalerate Market (2026-2032) | Trends, Insights, Challenges, Restraints, Competition, Size, Value, Forecast, Pricing, Share, Outlook, Revenue, Investment Opportunities, Strategy, Drivers, Demand, Growth, segmentation, Analysis, Companies
- Peru Polyhydroxybutyrate-co-Hydroxyvalerate Market (2026-2032) | Growth, Demand, Challenges, Share, Trends, Analysis, Pricing, Investment Opportunities, Drivers, Value, Forecast, Competition, Size, Companies, Insights, Outlook, Restraints, segmentation, Revenue, Strategy
- Pakistan Polyhydroxybutyrate-co-Hydroxyvalerate Market (2026-2032) | Restraints, segmentation, Pricing, Forecast, Share, Strategy, Competition, Trends, Insights, Drivers, Challenges, Growth, Revenue, Outlook, Value, Investment Opportunities, Companies, Size, Analysis, Demand
- Oman Polyhydroxybutyrate-co-Hydroxyvalerate Market (2026-2032) | Drivers, segmentation, Insights, Competition, Pricing, Outlook, Size, Revenue, Challenges, Forecast, Analysis, Growth, Value, Share, Trends, Investment Opportunities, Strategy, Restraints, Companies, Demand
- Nigeria Polyhydroxybutyrate-co-Hydroxyvalerate Market (2026-2032) | Value, Investment Opportunities, Analysis, Revenue, Restraints, Pricing, Outlook, Competition, Demand, Growth, Forecast, Companies, Trends, Challenges, segmentation, Drivers, Insights, Share, Size, Strategy
- Nepal Polyhydroxybutyrate-co-Hydroxyvalerate Market (2026-2032) | Insights, Analysis, Drivers, Share, Revenue, Demand, segmentation, Investment Opportunities, Competition, Forecast, Growth, Pricing, Companies, Strategy, Trends, Restraints, Challenges, Outlook, Size, Value
- Myanmar Polyhydroxybutyrate-co-Hydroxyvalerate Market (2026-2032) | Outlook, Revenue, Strategy, Restraints, Drivers, segmentation, Share, Forecast, Competition, Insights, Growth, Pricing, Size, Demand, Value, Companies, Trends, Challenges, Investment Opportunities, Analysis
- Morocco Polyhydroxybutyrate-co-Hydroxyvalerate Market (2026-2032) | Outlook, Investment Opportunities, Restraints, Strategy, Forecast, Challenges, Drivers, Growth, Companies, segmentation, Trends, Size, Competition, Revenue, Demand, Insights, Share, Analysis, Value, Pricing
- Mexico Polyhydroxybutyrate-co-Hydroxyvalerate Market (2026-2032) | Size, Drivers, Outlook, Share, Strategy, Growth, Pricing, Challenges, Companies, Demand, Value, Investment Opportunities, Restraints, Trends, Forecast, segmentation, Analysis, Insights, Competition, Revenue
- Malaysia Polyhydroxybutyrate-co-Hydroxyvalerate Market (2026-2032) | Share, segmentation, Size, Companies, Analysis, Insights, Forecast, Value, Revenue, Drivers, Restraints, Challenges, Investment Opportunities, Trends, Competition, Strategy, Demand, Growth, Outlook, Pricing
Industry Events and Analyst Meet

HIMTEX 2026

India Refining Summit 2026

India EV Show 2026

EV tech India Expo 2026

Auto Tech Asia 2026
Whitepaper
- Middle East & Africa Commercial Security Market Click here to view more.
- Middle East & Africa Fire Safety Systems & Equipment Market Click here to view more.
- GCC Drone Market Click here to view more.
- Middle East Lighting Fixture Market Click here to view more.
- GCC Physical & Perimeter Security Market Click here to view more.
6WResearch In News
- Doha a strategic location for EV manufacturing hub: IPA Qatar
- Demand for luxury TVs surging in the GCC, says Samsung
- Empowering Growth: The Thriving Journey of Bangladesh’s Cable Industry
- Demand for luxury TVs surging in the GCC, says Samsung
- Video call with a traditional healer? Once unthinkable, it’s now common in South Africa
- Intelligent Buildings To Smooth GCC’s Path To Net Zero