Bulgaria Aniline Market (2026-2032) | Outlook, Analysis, Companies, Industry, Trends, Segmentation, Value, Share, Forecast, Growth, Size & Revenue
Market Forecast By Product Type (Synthetic Aniline, Bio-Based Aniline), By Application (Methylene Diphenyl Diisocyanate (MDI), Others), By Industry Vertical (Building & Construction, Rubber, Consumer Goods, Automotive, Packaging, Agriculture, Others) And Competitive Landscape
| Product Code: ETC4708477 | Publication Date: Nov 2023 | Updated Date: Apr 2026 | Product Type: Market Research Report | |
| Publisher: 6Wresearch | Author: Shubham Padhi | No. of Pages: 60 | No. of Figures: 30 | No. of Tables: 5 |
Bulgaria Aniline Market Size (2020-2030)
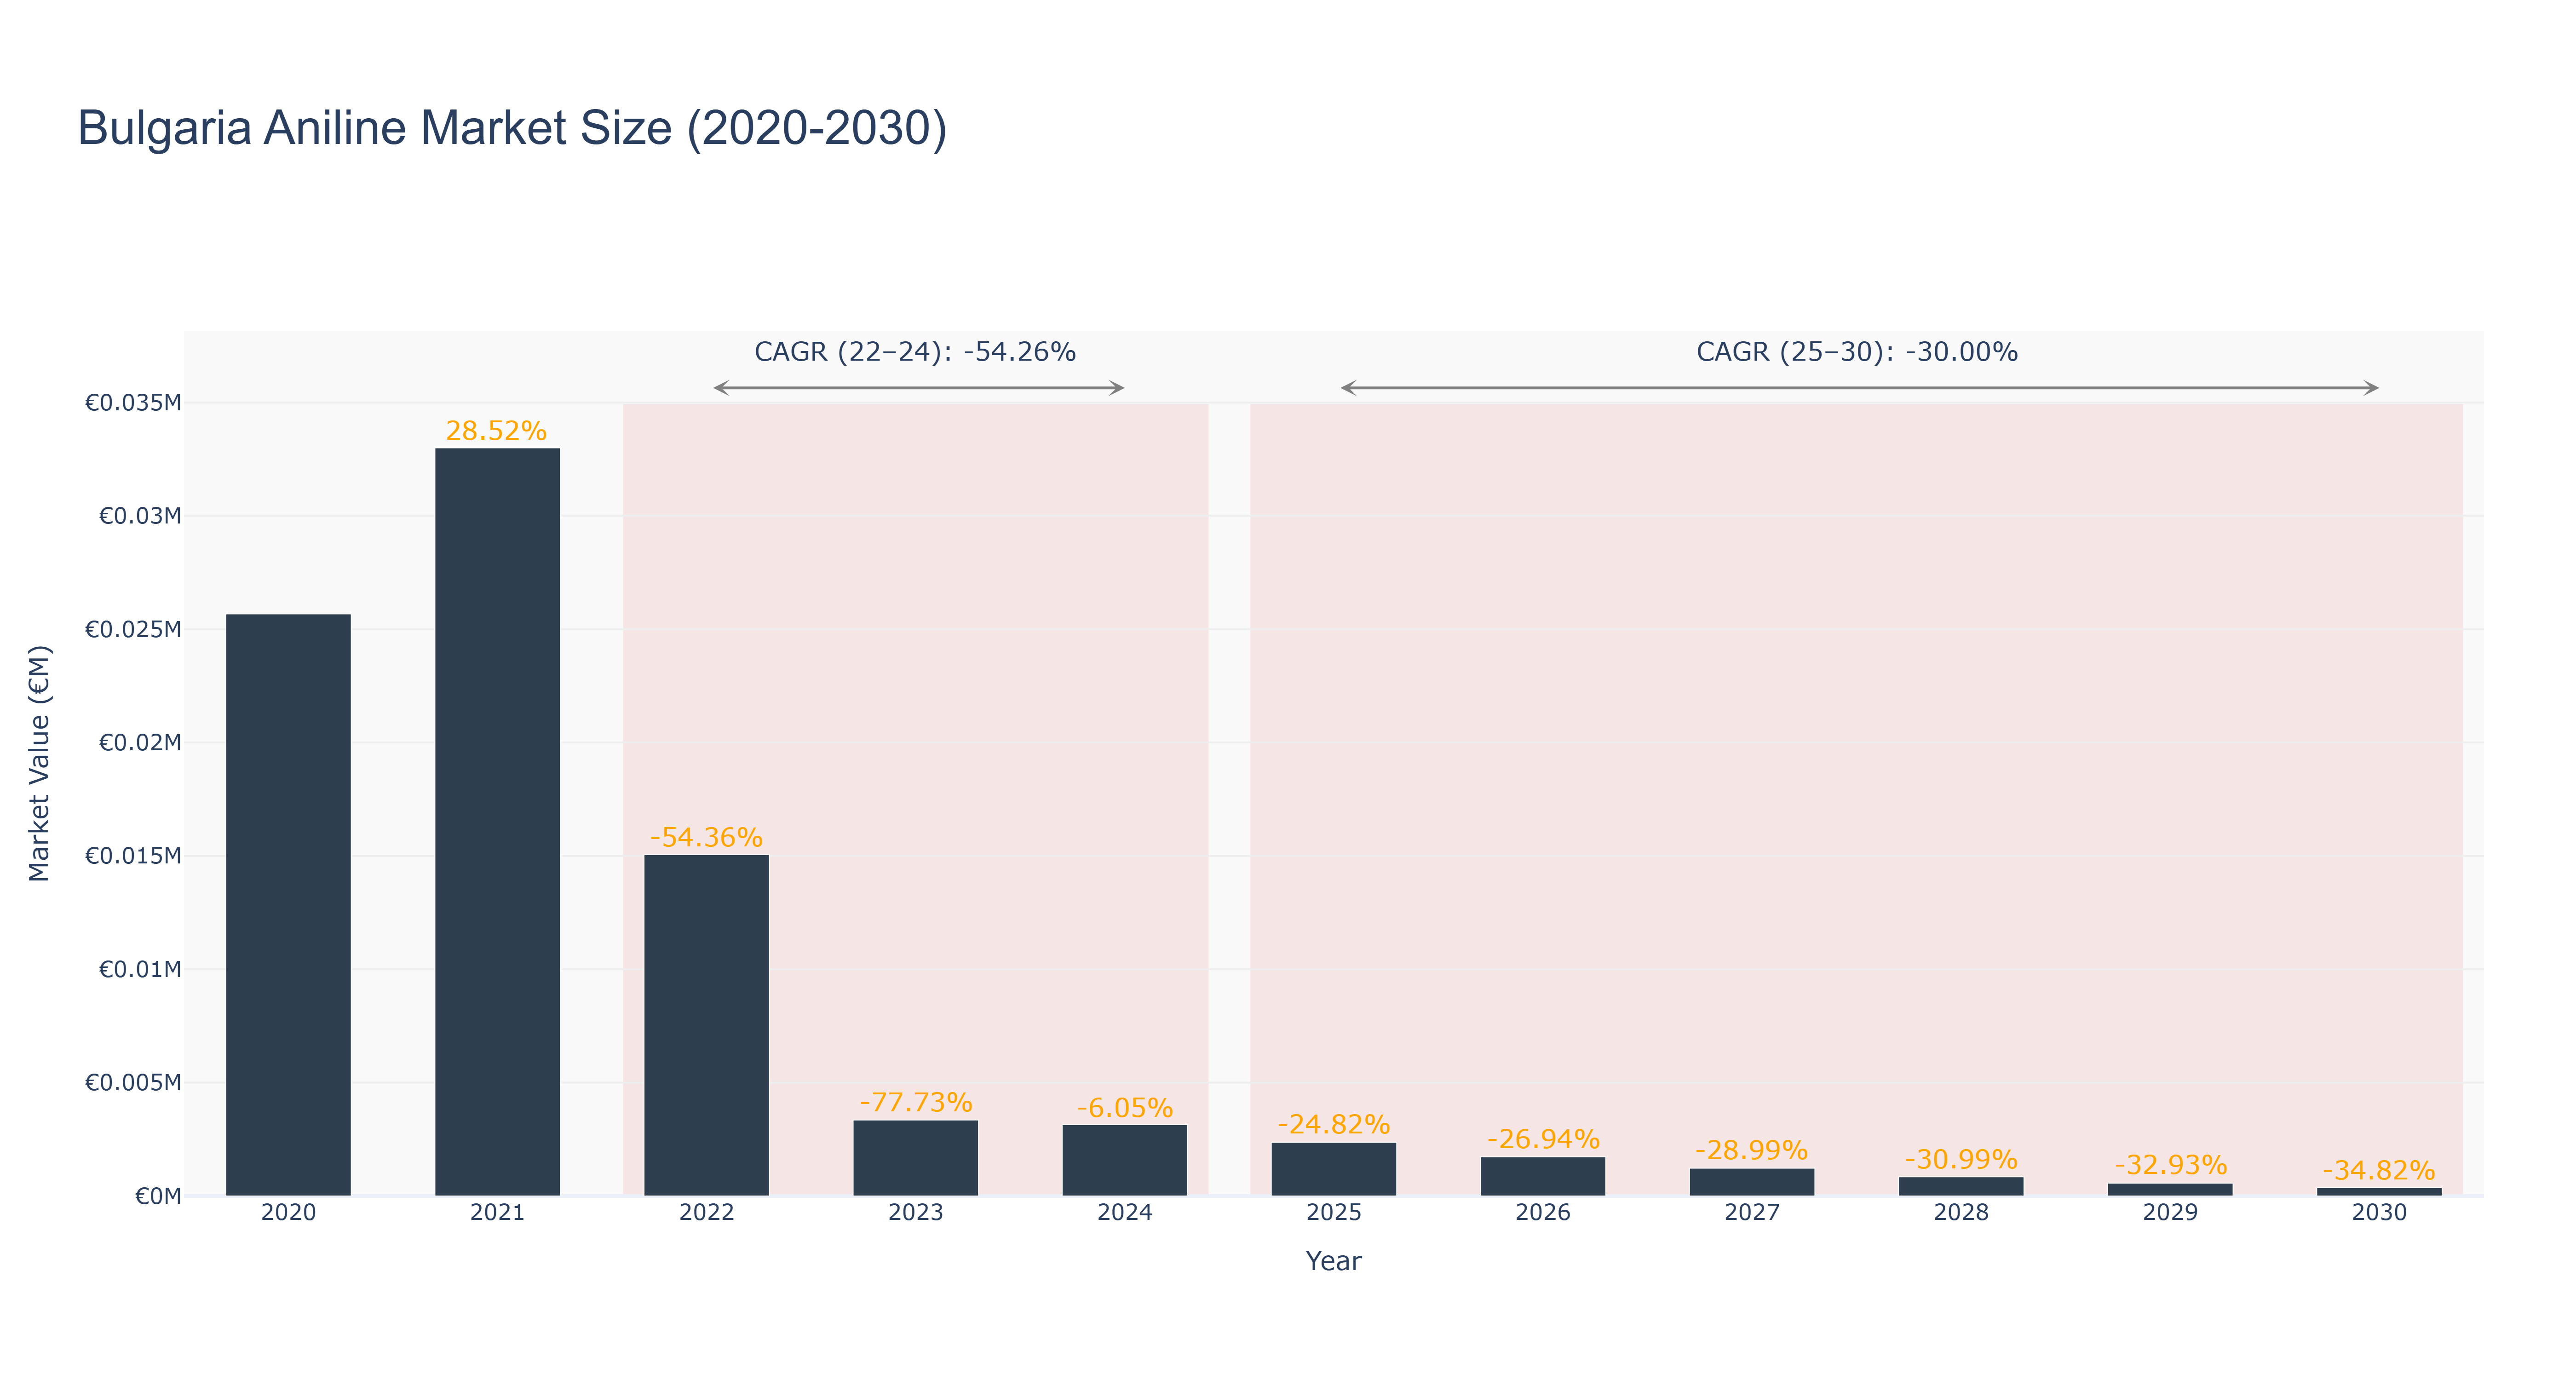
The Bulgaria Aniline Market has experienced a significant decline in recent years, showcasing a troubling trajectory following a peak market size of €33.00 thousand in 2021. The actual market size plummeted to €15.06 thousand in 2022 and further deteriorated to €3.35 thousand by 2023, reflecting a staggering CAGR of -54.26% from 2022 to 2024. The forecasted period from 2025 to 2030 anticipates continued contraction, with projected market sizes decreasing from €2.37 thousand in 2025 to €370.66 thousand by 2030, corresponding to a CAGR of -30.00%. This decline can be attributed to reduced demand in key sectors, regulatory challenges, and increased competition from alternative materials. While there are no significant upcoming projects identified that could reverse this trend, macroeconomic factors such as shifts in global chemical markets and sustainability initiatives may influence future dynamics in the aniline sector.
Bulgaria Aniline Market: Production & Trade Performance (2019-2025)
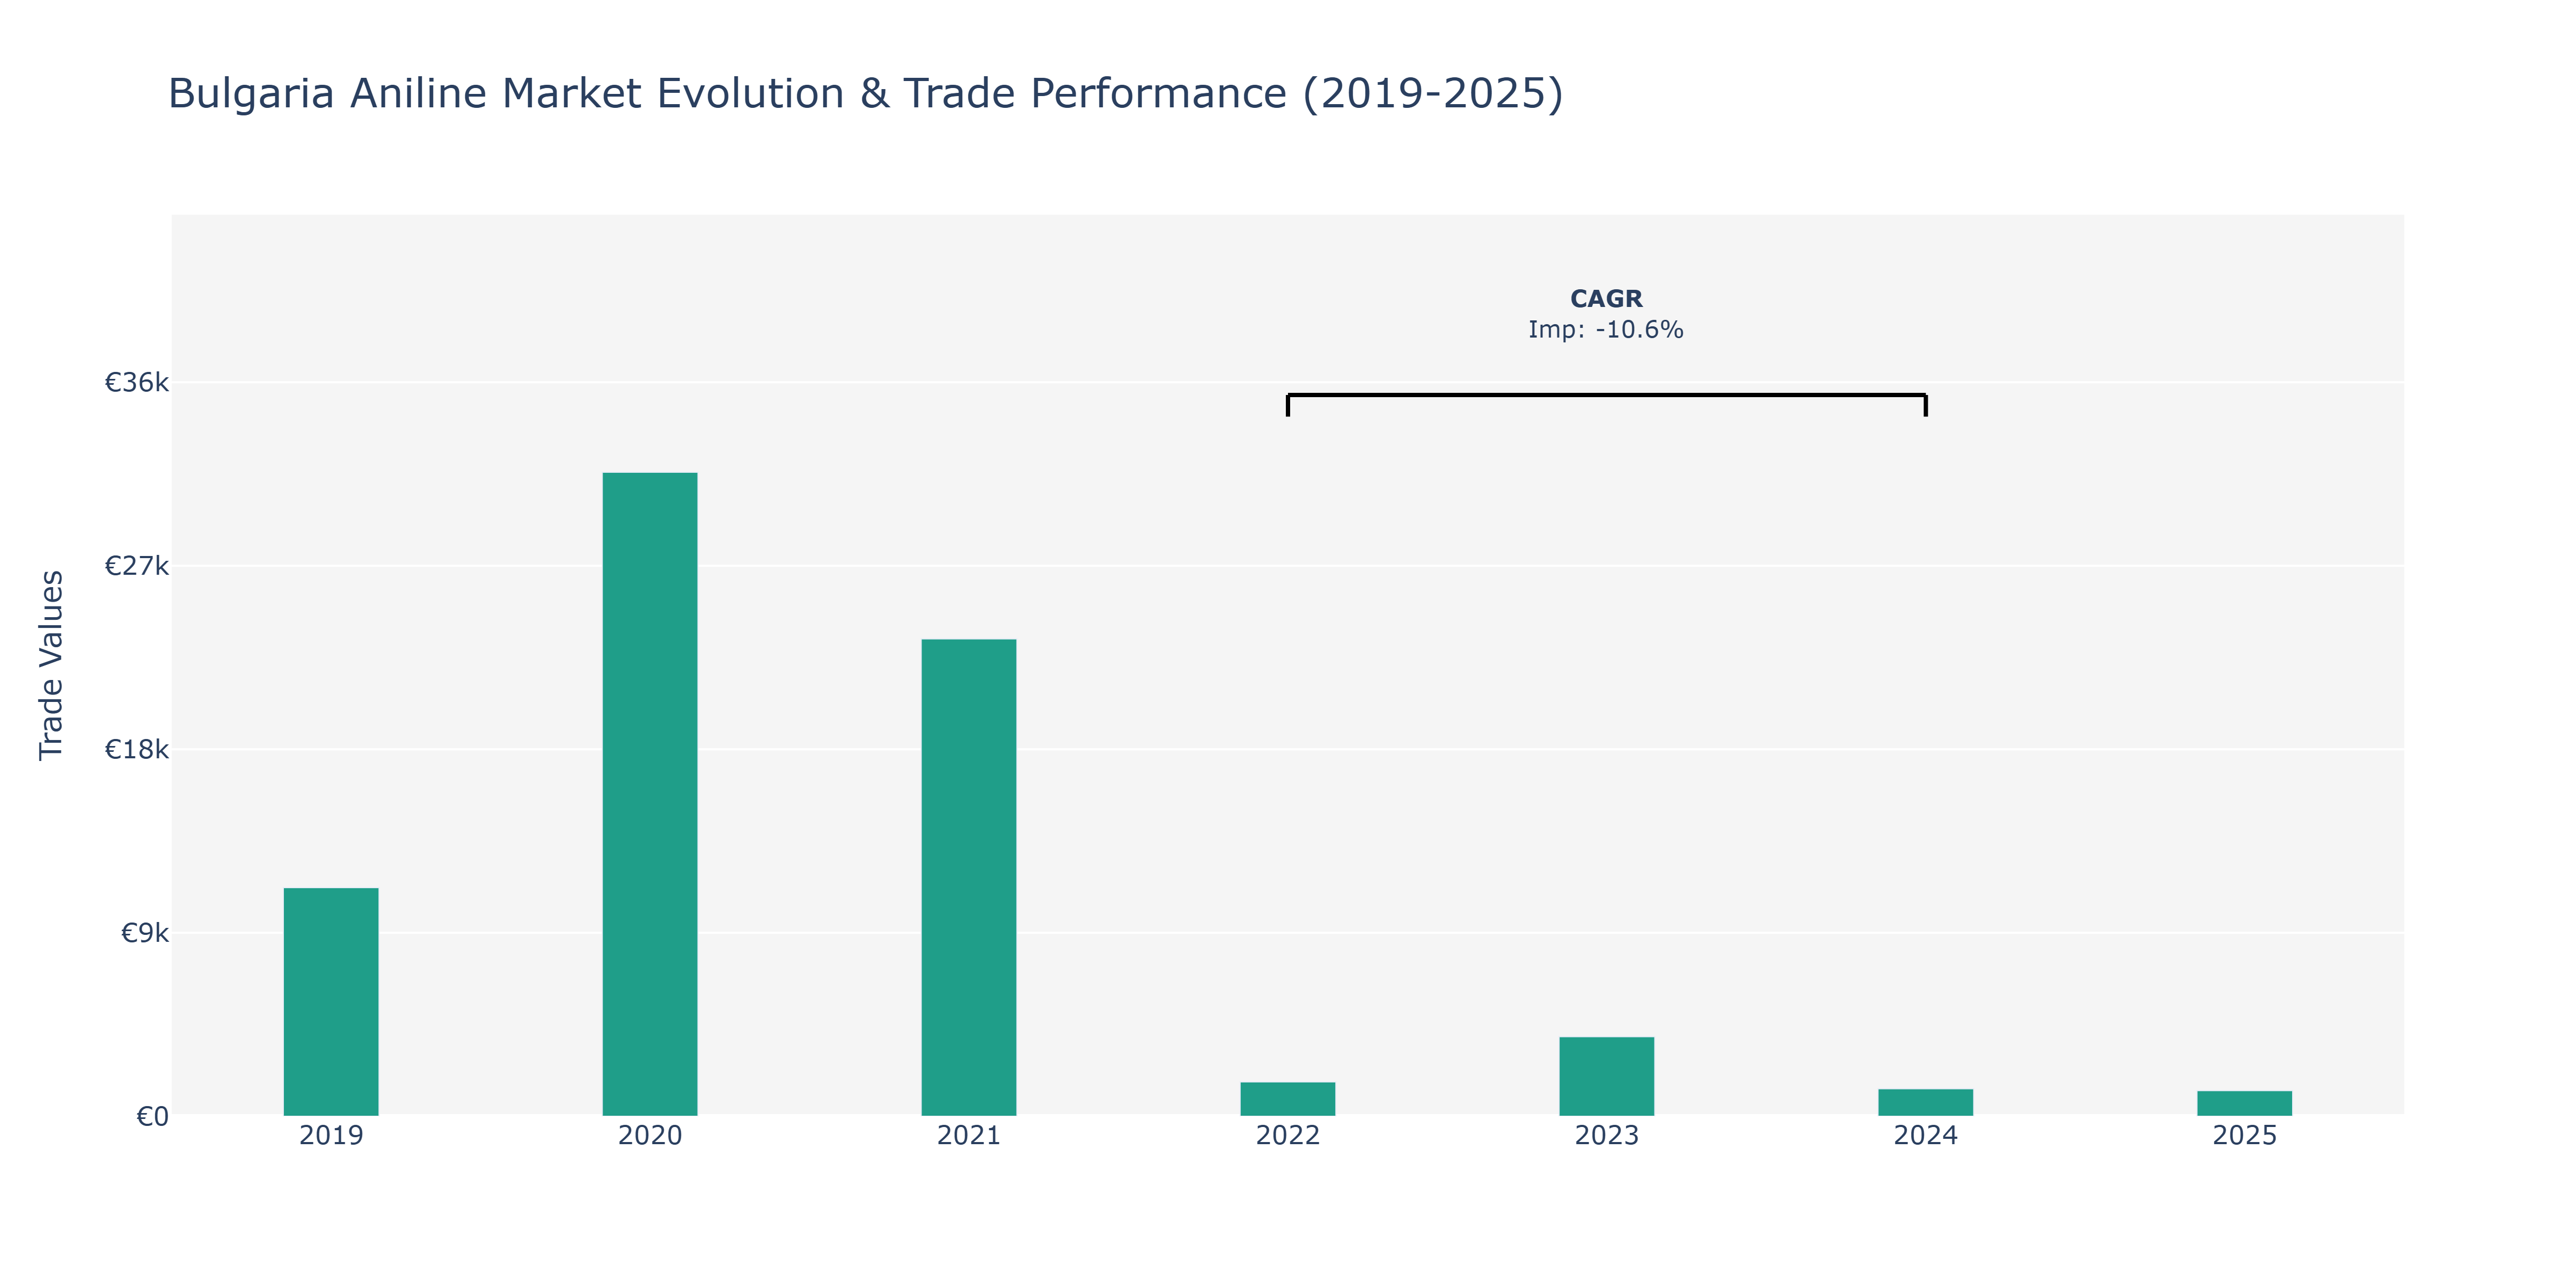
Between 2019 and 2025, Bulgaria's aniline imports witnessed notable fluctuations. In 2020, imports surged to €31.59 thousand, marking a significant increase from the previous year's €11.21 thousand. The following year, imports declined to €23.41 thousand before experiencing a sharp drop to €1.69 thousand in 2022. The downward trend continued in 2023 (€3.9 thousand) and 2024 (€1.35 thousand), reaching the lowest point in this period. By 2025, imports slightly increased to €1.25 thousand. These fluctuations can be attributed to various factors, including evolving market demand, global supply chain disruptions, and economic conditions impacting import volumes. The declining trend from 2020 to 2024 could also indicate fluctuations in domestic production capacities affecting import requirements. Further analysis could explore how changes in consumer preferences or regulatory developments influenced the demand for aniline imports in Bulgaria during this period.
Key Highlights of the Report:
- Bulgaria Aniline Market Outlook
- Market Size of Bulgaria Aniline Market, 2025
- Forecast of Bulgaria Aniline Market, 2032
- Historical Data and Forecast of Bulgaria Aniline Revenues & Volume for the Period 2022 - 2032F
- Bulgaria Aniline Market Trend Evolution
- Bulgaria Aniline Market Drivers and Challenges
- Bulgaria Aniline Price Trends
- Bulgaria Aniline Porter`s Five Forces
- Bulgaria Aniline Industry Life Cycle
- Historical Data and Forecast of Bulgaria Aniline Market Revenues & Volume By Product Type for the Period 2022 - 2032F
- Historical Data and Forecast of Bulgaria Aniline Market Revenues & Volume By Synthetic Aniline for the Period 2022 - 2032F
- Historical Data and Forecast of Bulgaria Aniline Market Revenues & Volume By Bio-Based Aniline for the Period 2022 - 2032F
- Historical Data and Forecast of Bulgaria Aniline Market Revenues & Volume By Application for the Period 2022 - 2032F
- Historical Data and Forecast of Bulgaria Aniline Market Revenues & Volume By Methylene Diphenyl Diisocyanate (MDI) for the Period 2022 - 2032F
- Historical Data and Forecast of Bulgaria Aniline Market Revenues & Volume By Others for the Period 2022 - 2032F
- Historical Data and Forecast of Bulgaria Aniline Market Revenues & Volume By Industry Vertical for the Period 2022 - 2032F
- Historical Data and Forecast of Bulgaria Aniline Market Revenues & Volume By Building & Construction for the Period 2022 - 2032F
- Historical Data and Forecast of Bulgaria Aniline Market Revenues & Volume By Rubber for the Period 2022 - 2032F
- Historical Data and Forecast of Bulgaria Aniline Market Revenues & Volume By Consumer Goods for the Period 2022 - 2032F
- Historical Data and Forecast of Bulgaria Aniline Market Revenues & Volume By Automotive for the Period 2022 - 2032F
- Historical Data and Forecast of Bulgaria Aniline Market Revenues & Volume By Packaging for the Period 2022 - 2032F
- Historical Data and Forecast of Bulgaria Aniline Market Revenues & Volume By Agriculture for the Period 2022 - 2032F
- Historical Data and Forecast of Bulgaria Aniline Market Revenues & Volume By Others for the Period 2022 - 2032F
- Bulgaria Aniline Import Export Trade Statistics
- Market Opportunity Assessment By Product Type
- Market Opportunity Assessment By Application
- Market Opportunity Assessment By Industry Vertical
- Bulgaria Aniline Top Companies Market Share
- Bulgaria Aniline Competitive Benchmarking By Technical and Operational Parameters
- Bulgaria Aniline Company Profiles
- Bulgaria Aniline Key Strategic Recommendations
Frequently Asked Questions About the Market Study (FAQs):
6Wresearch actively monitors the Bulgaria Aniline Market and publishes its comprehensive annual report, highlighting emerging trends, growth drivers, revenue analysis, and forecast outlook. Our insights help businesses to make data-backed strategic decisions with ongoing market dynamics. Our analysts track relevent industries related to the Bulgaria Aniline Market, allowing our clients with actionable intelligence and reliable forecasts tailored to emerging regional needs.
Yes, we provide customisation as per your requirements. To learn more, feel free to contact us on sales@6wresearch.com
1 Executive Summary |
2 Introduction |
2.1 Key Highlights of the Report |
2.2 Report Description |
2.3 Market Scope & Segmentation |
2.4 Research Methodology |
2.5 Assumptions |
3 Bulgaria Aniline Market Overview |
3.1 Bulgaria Country Macro Economic Indicators |
3.2 Bulgaria Aniline Market Revenues & Volume, 2022 & 2032F |
3.3 Bulgaria Aniline Market - Industry Life Cycle |
3.4 Bulgaria Aniline Market - Porter's Five Forces |
3.5 Bulgaria Aniline Market Revenues & Volume Share, By Product Type, 2022 & 2032F |
3.6 Bulgaria Aniline Market Revenues & Volume Share, By Application, 2022 & 2032F |
3.7 Bulgaria Aniline Market Revenues & Volume Share, By Industry Vertical, 2022 & 2032F |
4 Bulgaria Aniline Market Dynamics |
4.1 Impact Analysis |
4.2 Market Drivers |
4.2.1 Growth in end-use industries such as rubber, plastics, and pharmaceuticals, which are major consumers of aniline. |
4.2.2 Increasing demand for dyes and pigments in the textile industry, where aniline is a key ingredient. |
4.2.3 Government initiatives to boost chemical manufacturing and promote local production of aniline. |
4.3 Market Restraints |
4.3.1 Volatility in raw material prices, particularly benzene, a key component in aniline production. |
4.3.2 Stringent environmental regulations impacting aniline production processes and increasing compliance costs. |
4.3.3 Competition from substitute products like acetanilide and nitrobenzene affecting market growth. |
5 Bulgaria Aniline Market Trends |
6 Bulgaria Aniline Market Segmentations |
6.1 Bulgaria Aniline Market, By Product Type |
6.1.1 Overview and Analysis |
6.1.2 Bulgaria Aniline Market Revenues & Volume, By Synthetic Aniline, 2022 - 2032F |
6.1.3 Bulgaria Aniline Market Revenues & Volume, By Bio-Based Aniline, 2022 - 2032F |
6.2 Bulgaria Aniline Market, By Application |
6.2.1 Overview and Analysis |
6.2.2 Bulgaria Aniline Market Revenues & Volume, By Methylene Diphenyl Diisocyanate (MDI), 2022 - 2032F |
6.2.3 Bulgaria Aniline Market Revenues & Volume, By Others, 2022 - 2032F |
6.3 Bulgaria Aniline Market, By Industry Vertical |
6.3.1 Overview and Analysis |
6.3.2 Bulgaria Aniline Market Revenues & Volume, By Building & Construction, 2022 - 2032F |
6.3.3 Bulgaria Aniline Market Revenues & Volume, By Rubber, 2022 - 2032F |
6.3.4 Bulgaria Aniline Market Revenues & Volume, By Consumer Goods, 2022 - 2032F |
6.3.5 Bulgaria Aniline Market Revenues & Volume, By Automotive, 2022 - 2032F |
6.3.6 Bulgaria Aniline Market Revenues & Volume, By Packaging, 2022 - 2032F |
6.3.7 Bulgaria Aniline Market Revenues & Volume, By Agriculture, 2022 - 2032F |
7 Bulgaria Aniline Market Import-Export Trade Statistics |
7.1 Bulgaria Aniline Market Export to Major Countries |
7.2 Bulgaria Aniline Market Imports from Major Countries |
8 Bulgaria Aniline Market Key Performance Indicators |
8.1 Capacity utilization rate of aniline manufacturing plants in Bulgaria. |
8.2 Average selling price of aniline in the Bulgarian market. |
8.3 Research and development investments in new aniline production technologies. |
8.4 Percentage of aniline production meeting environmental compliance standards. |
9 Bulgaria Aniline Market - Opportunity Assessment |
9.1 Bulgaria Aniline Market Opportunity Assessment, By Product Type, 2022 & 2032F |
9.2 Bulgaria Aniline Market Opportunity Assessment, By Application, 2022 & 2032F |
9.3 Bulgaria Aniline Market Opportunity Assessment, By Industry Vertical, 2022 & 2032F |
10 Bulgaria Aniline Market - Competitive Landscape |
10.1 Bulgaria Aniline Market Revenue Share, By Companies, 2025 |
10.2 Bulgaria Aniline Market Competitive Benchmarking, By Operating and Technical Parameters |
11 Company Profiles |
12 Recommendations | 13 Disclaimer |
Export potential assessment - trade Analytics for 2030
Export potential enables firms to identify high-growth global markets with greater confidence by combining advanced trade intelligence with a structured quantitative methodology. The framework analyzes emerging demand trends and country-level import patterns while integrating macroeconomic and trade datasets such as GDP and population forecasts, bilateral import–export flows, tariff structures, elasticity differentials between developed and developing economies, geographic distance, and import demand projections. Using weighted trade values from 2020–2024 as the base period to project country-to-country export potential for 2030, these inputs are operationalized through calculated drivers such as gravity model parameters, tariff impact factors, and projected GDP per-capita growth. Through an analysis of hidden potentials, demand hotspots, and market conditions that are most favorable to success, this method enables firms to focus on target countries, maximize returns, and global expansion with data, backed by accuracy.
By factoring in the projected importer demand gap that is currently unmet and could be potential opportunity, it identifies the potential for the Exporter (Country) among 190 countries, against the general trade analysis, which identifies the biggest importer or exporter.
To discover high-growth global markets and optimize your business strategy:
Click Here
Pricing
- Single User License$ 1,995
- Department License$ 2,400
- Site License$ 3,120
- Global License$ 3,795

Search
Thought Leadership and Analyst Meet


Our Clients
Latest Reports
- China Electric Appliance Rental Market (2026-2032) | Trends, Revenue, Growth, Challenges, Size, Value, Outlook, Pricing, Strategy, Insights, Restraints, segmentation, Companies, Investment Opportunities, Analysis, Demand, Drivers, Competition, Forecast, Share
- Chile Electric Appliance Rental Market (2026-2032) | Outlook, Competition, Drivers, Strategy, Revenue, Analysis, Value, Pricing, Restraints, Size, Demand, Share, Growth, Forecast, Challenges, Insights, Investment Opportunities, Companies, Trends, segmentation
- Cambodia Electric Appliance Rental Market (2026-2032) | Companies, Analysis, Restraints, Pricing, Insights, Challenges, Outlook, Strategy, Forecast, Trends, Competition, Value, Revenue, Investment Opportunities, segmentation, Drivers, Size, Demand, Growth, Share
- Brazil Electric Appliance Rental Market (2026-2032) | Revenue, Strategy, Forecast, Companies, segmentation, Competition, Size, Investment Opportunities, Pricing, Restraints, Outlook, Challenges, Analysis, Drivers, Value, Demand, Insights, Trends, Growth, Share
- Bangladesh Electric Appliance Rental Market (2026-2032) | Drivers, Forecast, Investment Opportunities, Strategy, Insights, Demand, Challenges, Outlook, Trends, Competition, Value, Revenue, Size, Pricing, Analysis, Companies, Restraints, segmentation, Share, Growth
- Bahrain Electric Appliance Rental Market (2026-2032) | Outlook, Size, Competition, Restraints, Drivers, Value, Trends, Investment Opportunities, Insights, Forecast, Revenue, Strategy, Growth, Share, Demand, Analysis, Challenges, Companies, segmentation, Pricing
- Azerbaijan Electric Appliance Rental Market (2026-2032) | Trends, Investment Opportunities, Restraints, Insights, Strategy, Competition, Value, Growth, Demand, Drivers, Analysis, Forecast, Size, Share, Outlook, segmentation, Pricing, Challenges, Revenue, Companies
- Australia Electric Appliance Rental Market (2026-2032) | Challenges, Restraints, Forecast, Demand, Size, Competition, Pricing, Investment Opportunities, Revenue, Trends, Drivers, Growth, Outlook, Analysis, Strategy, Value, segmentation, Insights, Companies, Share
- Argentina Electric Appliance Rental Market (2026-2032) | Growth, Trends, Insights, Outlook, Forecast, Size, Drivers, Analysis, Restraints, Challenges, Share, Revenue, Investment Opportunities, Strategy, Demand, Value, Companies, segmentation, Competition, Pricing
- Algeria Electric Appliance Rental Market (2026-2032) | Share, Size, Value, Strategy, Competition, Outlook, Challenges, Companies, Trends, Pricing, Insights, Forecast, Investment Opportunities, Revenue, Growth, Restraints, segmentation, Analysis, Demand, Drivers
Industry Events and Analyst Meet

HIMTEX 2026

India Refining Summit 2026

India EV Show 2026

EV tech India Expo 2026

Auto Tech Asia 2026
Whitepaper
- Middle East & Africa Commercial Security Market Click here to view more.
- Middle East & Africa Fire Safety Systems & Equipment Market Click here to view more.
- GCC Drone Market Click here to view more.
- Middle East Lighting Fixture Market Click here to view more.
- GCC Physical & Perimeter Security Market Click here to view more.
6WResearch In News
- Doha a strategic location for EV manufacturing hub: IPA Qatar
- Demand for luxury TVs surging in the GCC, says Samsung
- Empowering Growth: The Thriving Journey of Bangladesh’s Cable Industry
- Demand for luxury TVs surging in the GCC, says Samsung
- Video call with a traditional healer? Once unthinkable, it’s now common in South Africa
- Intelligent Buildings To Smooth GCC’s Path To Net Zero