Bulgaria Copper Sulfate Market (2026-2032) | Pricing Analysis, Competitive, Restraints, Trends, Investment Trends, Revenue, Companies, Value, Demand, Analysis, Segmentation, Forecast, Strategy, Segments, Strategic Insights, Competition, Share, Drivers, Supply, Challenges, Growth, Outlook, Consumer Insights, Opportunities, Industry, Size
Market Forecast By Form (Powder, Liquid, Crystals, Others), By Grade (Technical Grade, Industrial Grade, Feed Grade, Others), By Application (Fungicide, Electroplating, Feed Additive, Others), By End-Use (Agriculture, Electronics, Animal Nutrition, Others), By Distribution Channel (Direct Sales, Distributors, Online Sales, Others) And Competitive Landscape
| Product Code: ETC11761674 | Publication Date: Apr 2025 | Updated Date: Apr 2026 | Product Type: Market Research Report | |
| Publisher: 6Wresearch | No. of Pages: 65 | No. of Figures: 34 | No. of Tables: 19 | |
Bulgaria Copper Sulfate Market Size (2020-2030)
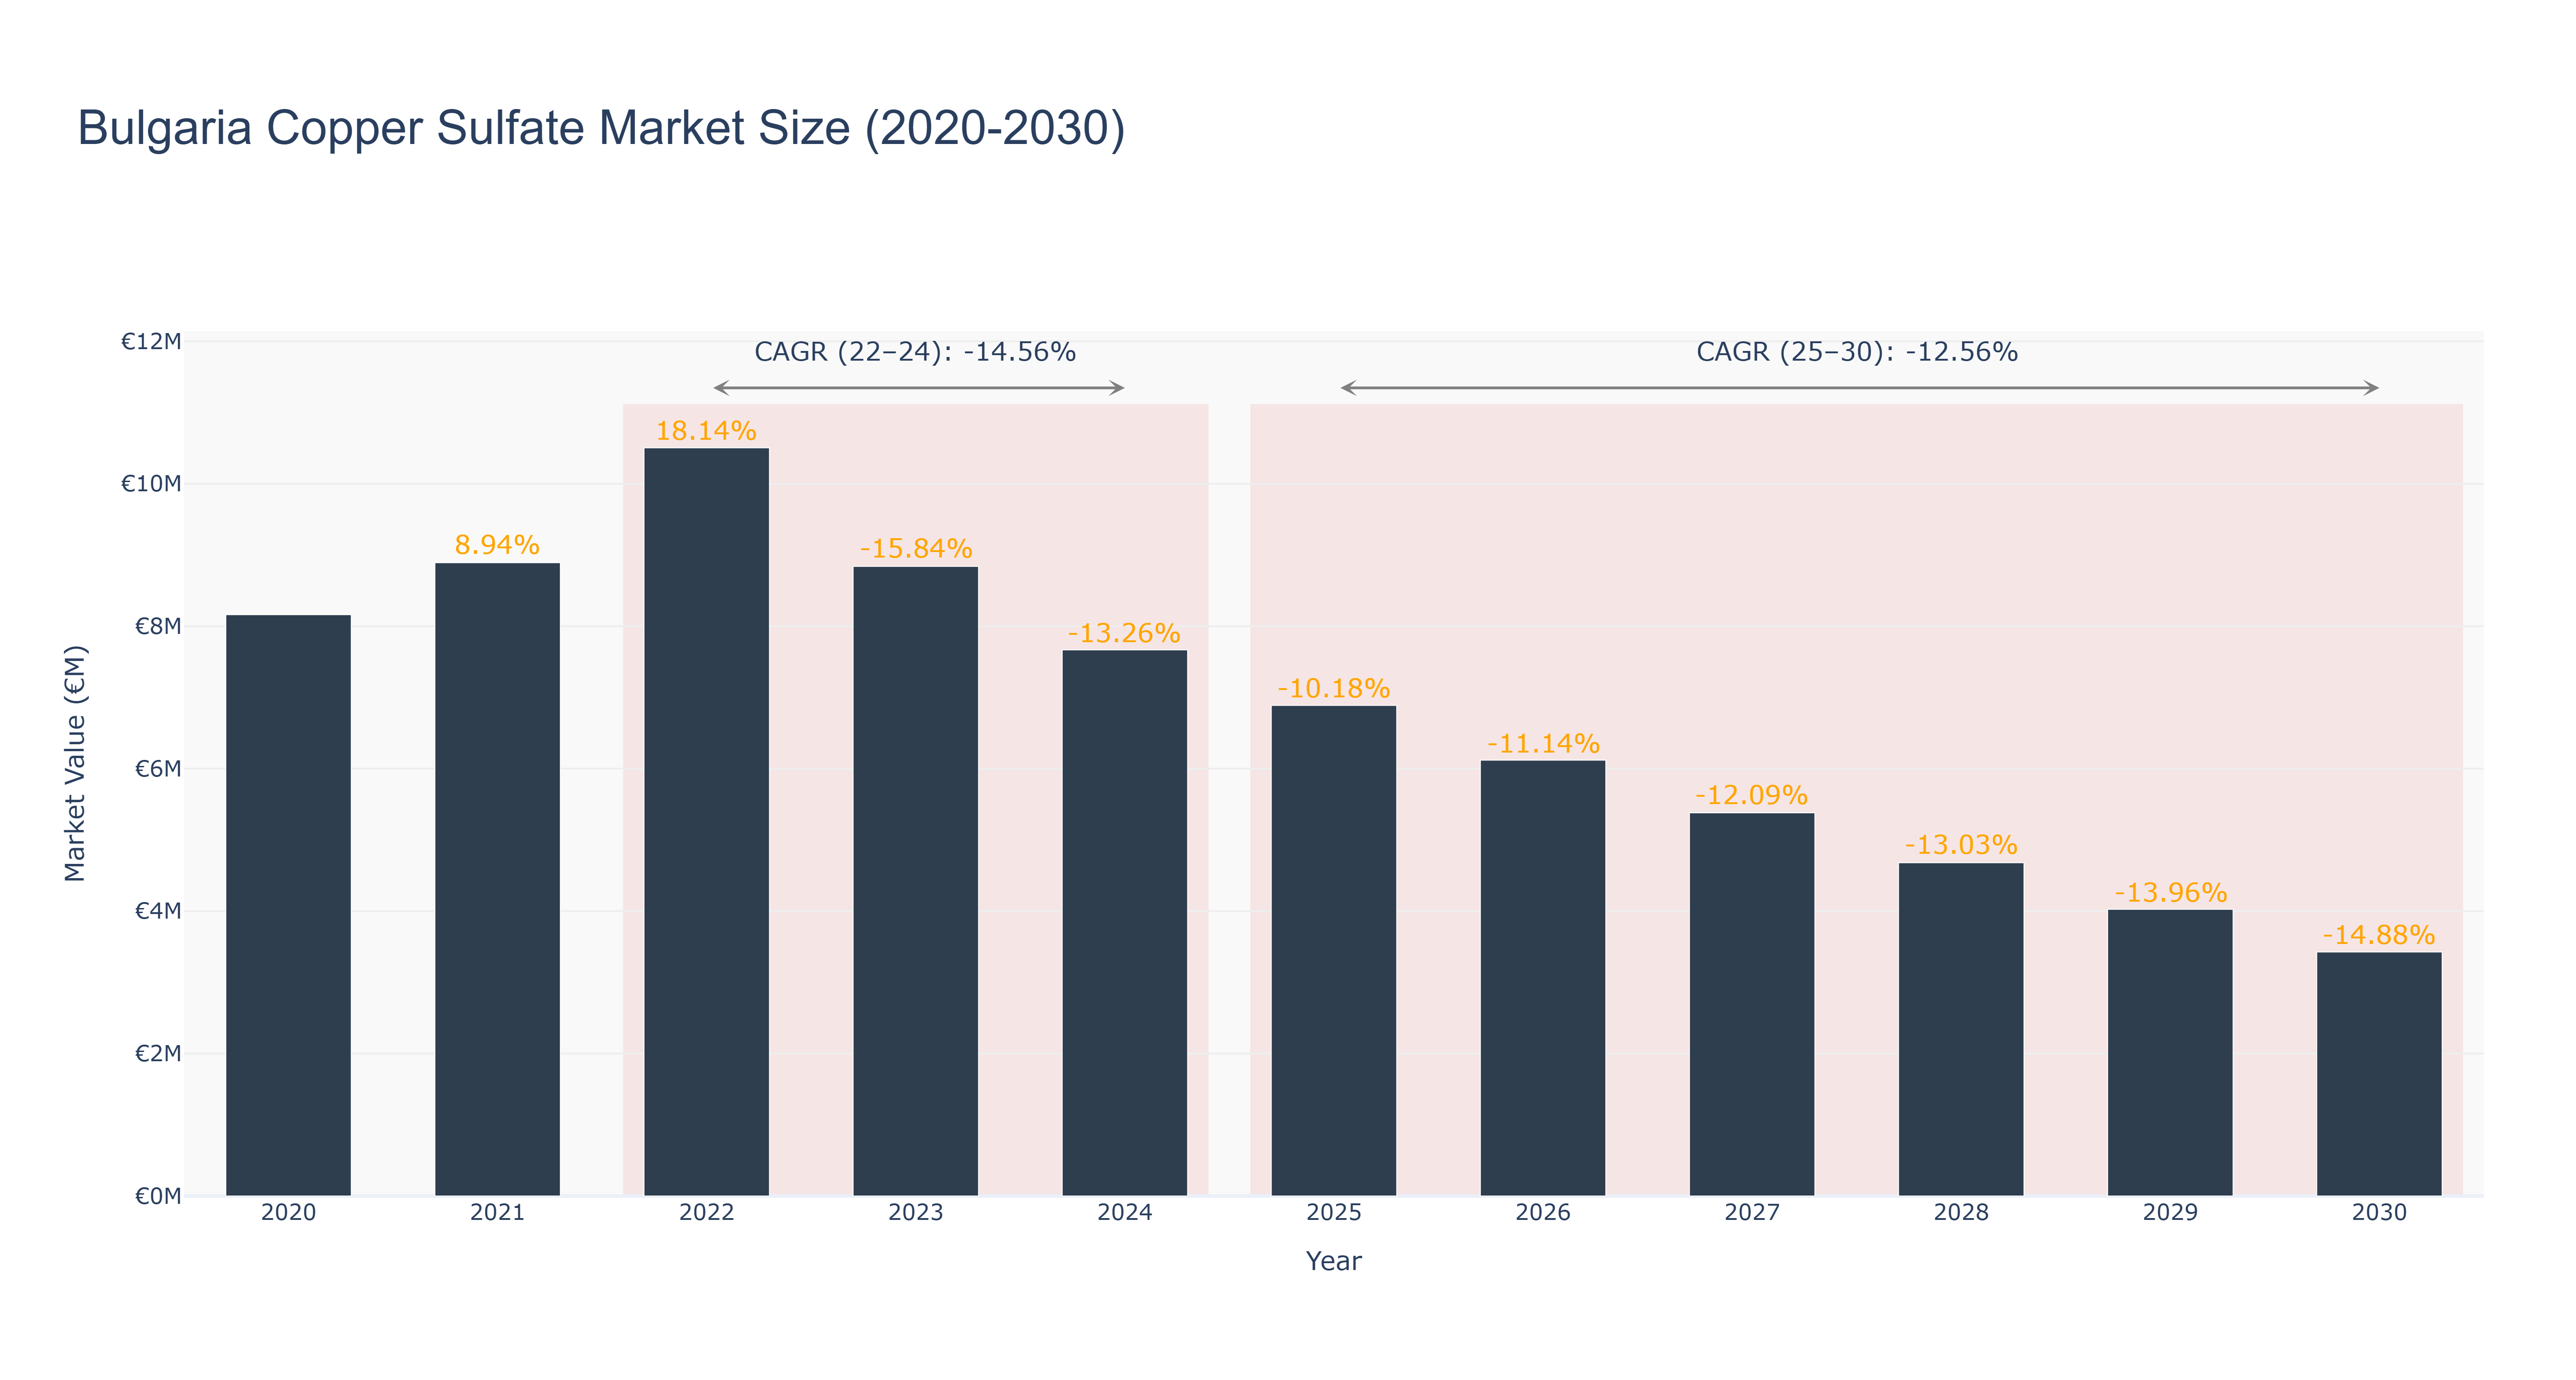
Bulgaria Copper Sulfate Market has experienced a notable decline since 2020, with a peak market size of €10.51 million in 2022. The actual market size decreased to €7.67 million in 2024, reflecting a negative trend. The forecasted market size is expected to continue decreasing from €6.89 million in 2025 to €3.43 million in 2030, with a CAGR of -12.56% from 2025-30. The downward trend can be attributed to various factors such as changing consumer preferences, economic conditions, and environmental regulations impacting the demand for copper sulfate. Despite the current challenges, the market is expected to witness new projects focusing on sustainable production methods and innovative applications of copper sulfate in agriculture and industrial sectors, aiming to revitalize the market in the near future. Industry drivers include technological advancements, increasing awareness about environmental sustainability, and evolving regulatory landscape.
Bulgaria Copper Sulfate Market: Production & Trade Performance (2019-2025)
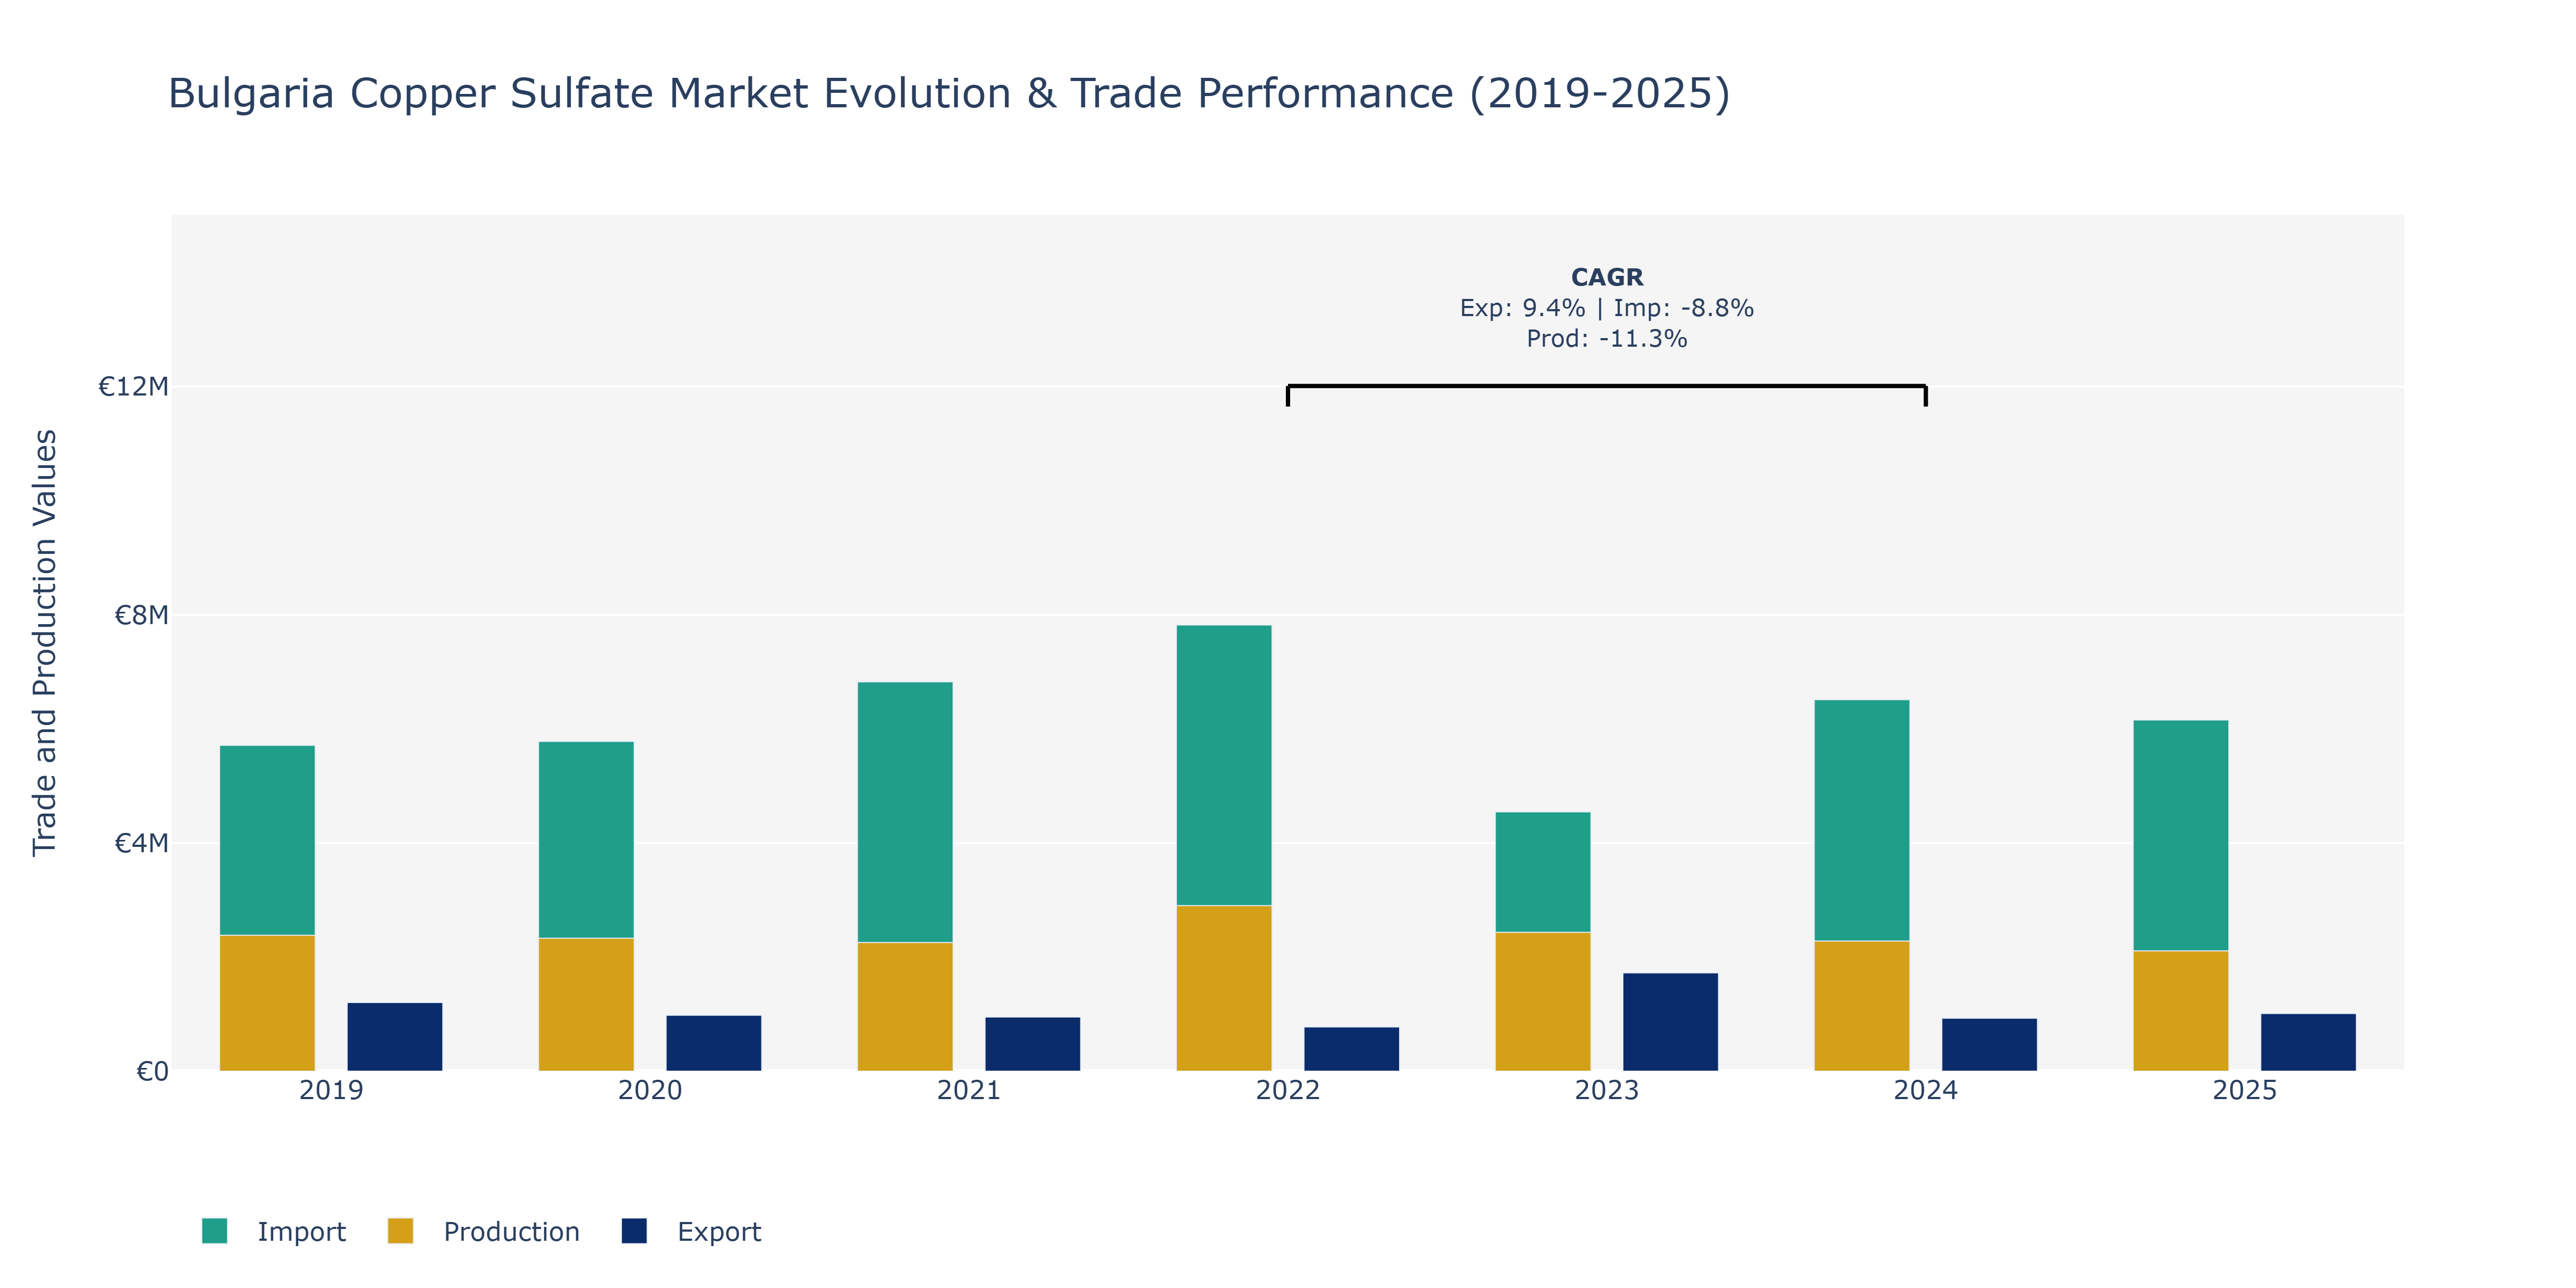
Between 2019 and 2025, Bulgaria's Copper Sulfate Market experienced fluctuations in exports, imports, and production. Exports started at €1.21 million in 2019, decreased to €0.78 million in 2022, peaked at €1.72 million in 2023, and then stabilized around €1.01 million in 2025. Imports exhibited a different pattern, starting at €5.71 million in 2019, increasing to €7.82 million in 2022, and then decreasing to €6.16 million in 2025. Production levels varied as well, beginning at €2.38 million in 2019, reaching a peak of €2.90 million in 2022, and dropping to €2.11 million in 2025. The decline in production from 2022 to 2025 could be attributed to factors such as changes in demand, raw material availability, or technological advancements impacting production efficiency. Import fluctuations may have been influenced by global market trends, currency exchange rates, or trade agreements affecting the import costs. The varying export levels might have been impacted by international demand, competition, or government policies supporting or hindering exports. To sustain growth, market players could focus on enhancing production efficiency, exploring new export markets, and optimizing import strategies to navigate market uncertainties and capitalize on emerging opportunities.
Key Highlights of the Report:
- Bulgaria Copper Sulfate Market Outlook
- Market Size of Bulgaria Copper Sulfate Market, 2025
- Forecast of Bulgaria Copper Sulfate Market, 2032
- Historical Data and Forecast of Bulgaria Copper Sulfate Revenues & Volume for the Period 2022 - 2032F
- Bulgaria Copper Sulfate Market Trend Evolution
- Bulgaria Copper Sulfate Market Drivers and Challenges
- Bulgaria Copper Sulfate Price Trends
- Bulgaria Copper Sulfate Porter's Five Forces
- Bulgaria Copper Sulfate Industry Life Cycle
- Historical Data and Forecast of Bulgaria Copper Sulfate Market Revenues & Volume By Form for the Period 2022 - 2032F
- Historical Data and Forecast of Bulgaria Copper Sulfate Market Revenues & Volume By Powder for the Period 2022 - 2032F
- Historical Data and Forecast of Bulgaria Copper Sulfate Market Revenues & Volume By Liquid for the Period 2022 - 2032F
- Historical Data and Forecast of Bulgaria Copper Sulfate Market Revenues & Volume By Crystals for the Period 2022 - 2032F
- Historical Data and Forecast of Bulgaria Copper Sulfate Market Revenues & Volume By Others for the Period 2022 - 2032F
- Historical Data and Forecast of Bulgaria Copper Sulfate Market Revenues & Volume By Grade for the Period 2022 - 2032F
- Historical Data and Forecast of Bulgaria Copper Sulfate Market Revenues & Volume By Technical Grade for the Period 2022 - 2032F
- Historical Data and Forecast of Bulgaria Copper Sulfate Market Revenues & Volume By Industrial Grade for the Period 2022 - 2032F
- Historical Data and Forecast of Bulgaria Copper Sulfate Market Revenues & Volume By Feed Grade for the Period 2022 - 2032F
- Historical Data and Forecast of Bulgaria Copper Sulfate Market Revenues & Volume By Others for the Period 2022 - 2032F
- Historical Data and Forecast of Bulgaria Copper Sulfate Market Revenues & Volume By Application for the Period 2022 - 2032F
- Historical Data and Forecast of Bulgaria Copper Sulfate Market Revenues & Volume By Fungicide for the Period 2022 - 2032F
- Historical Data and Forecast of Bulgaria Copper Sulfate Market Revenues & Volume By Electroplating for the Period 2022 - 2032F
- Historical Data and Forecast of Bulgaria Copper Sulfate Market Revenues & Volume By Feed Additive for the Period 2022 - 2032F
- Historical Data and Forecast of Bulgaria Copper Sulfate Market Revenues & Volume By Others for the Period 2022 - 2032F
- Historical Data and Forecast of Bulgaria Copper Sulfate Market Revenues & Volume By End-Use for the Period 2022 - 2032F
- Historical Data and Forecast of Bulgaria Copper Sulfate Market Revenues & Volume By Agriculture for the Period 2022 - 2032F
- Historical Data and Forecast of Bulgaria Copper Sulfate Market Revenues & Volume By Electronics for the Period 2022 - 2032F
- Historical Data and Forecast of Bulgaria Copper Sulfate Market Revenues & Volume By Animal Nutrition for the Period 2022 - 2032F
- Historical Data and Forecast of Bulgaria Copper Sulfate Market Revenues & Volume By Others for the Period 2022 - 2032F
- Historical Data and Forecast of Bulgaria Copper Sulfate Market Revenues & Volume By Distribution Channel for the Period 2022 - 2032F
- Historical Data and Forecast of Bulgaria Copper Sulfate Market Revenues & Volume By Direct Sales for the Period 2022 - 2032F
- Historical Data and Forecast of Bulgaria Copper Sulfate Market Revenues & Volume By Distributors for the Period 2022 - 2032F
- Historical Data and Forecast of Bulgaria Copper Sulfate Market Revenues & Volume By Online Sales for the Period 2022 - 2032F
- Historical Data and Forecast of Bulgaria Copper Sulfate Market Revenues & Volume By Others for the Period 2022 - 2032F
- Bulgaria Copper Sulfate Import Export Trade Statistics
- Market Opportunity Assessment By Form
- Market Opportunity Assessment By Grade
- Market Opportunity Assessment By Application
- Market Opportunity Assessment By End-Use
- Market Opportunity Assessment By Distribution Channel
- Bulgaria Copper Sulfate Top Companies Market Share
- Bulgaria Copper Sulfate Competitive Benchmarking By Technical and Operational Parameters
- Bulgaria Copper Sulfate Company Profiles
- Bulgaria Copper Sulfate Key Strategic Recommendations
Frequently Asked Questions About the Market Study (FAQs):
6Wresearch actively monitors the Bulgaria Copper Sulfate Market and publishes its comprehensive annual report, highlighting emerging trends, growth drivers, revenue analysis, and forecast outlook. Our insights help businesses to make data-backed strategic decisions with ongoing market dynamics. Our analysts track relevent industries related to the Bulgaria Copper Sulfate Market, allowing our clients with actionable intelligence and reliable forecasts tailored to emerging regional needs.
Yes, we provide customisation as per your requirements. To learn more, feel free to contact us on sales@6wresearch.com
1 Executive Summary |
2 Introduction |
2.1 Key Highlights of the Report |
2.2 Report Description |
2.3 Market Scope & Segmentation |
2.4 Research Methodology |
2.5 Assumptions |
3 Bulgaria Copper Sulfate Market Overview |
3.1 Bulgaria Country Macro Economic Indicators |
3.2 Bulgaria Copper Sulfate Market Revenues & Volume, 2022 & 2032F |
3.3 Bulgaria Copper Sulfate Market - Industry Life Cycle |
3.4 Bulgaria Copper Sulfate Market - Porter's Five Forces |
3.5 Bulgaria Copper Sulfate Market Revenues & Volume Share, By Form, 2022 & 2032F |
3.6 Bulgaria Copper Sulfate Market Revenues & Volume Share, By Grade, 2022 & 2032F |
3.7 Bulgaria Copper Sulfate Market Revenues & Volume Share, By Application, 2022 & 2032F |
3.8 Bulgaria Copper Sulfate Market Revenues & Volume Share, By End-Use, 2022 & 2032F |
3.9 Bulgaria Copper Sulfate Market Revenues & Volume Share, By Distribution Channel, 2022 & 2032F |
4 Bulgaria Copper Sulfate Market Dynamics |
4.1 Impact Analysis |
4.2 Market Drivers |
4.2.1 Increasing demand for agricultural products leading to higher usage of copper sulfate as a fungicide and pesticide. |
4.2.2 Growing awareness about the benefits of copper sulfate in various industrial applications like electroplating and mining. |
4.2.3 Government initiatives promoting the use of copper sulfate in water treatment and animal feed additives. |
4.3 Market Restraints |
4.3.1 Fluctuating prices of raw materials like copper and sulfur impacting the production cost of copper sulfate. |
4.3.2 Environmental concerns regarding the toxicity of copper sulfate leading to regulatory restrictions. |
4.3.3 Competition from alternative products and substitutes in the market. |
5 Bulgaria Copper Sulfate Market Trends |
6 Bulgaria Copper Sulfate Market, By Types |
6.1 Bulgaria Copper Sulfate Market, By Form |
6.1.1 Overview and Analysis |
6.1.2 Bulgaria Copper Sulfate Market Revenues & Volume, By Form, 2022 - 2032F |
6.1.3 Bulgaria Copper Sulfate Market Revenues & Volume, By Powder, 2022 - 2032F |
6.1.4 Bulgaria Copper Sulfate Market Revenues & Volume, By Liquid, 2022 - 2032F |
6.1.5 Bulgaria Copper Sulfate Market Revenues & Volume, By Crystals, 2022 - 2032F |
6.1.6 Bulgaria Copper Sulfate Market Revenues & Volume, By Others, 2022 - 2032F |
6.2 Bulgaria Copper Sulfate Market, By Grade |
6.2.1 Overview and Analysis |
6.2.2 Bulgaria Copper Sulfate Market Revenues & Volume, By Technical Grade, 2022 - 2032F |
6.2.3 Bulgaria Copper Sulfate Market Revenues & Volume, By Industrial Grade, 2022 - 2032F |
6.2.4 Bulgaria Copper Sulfate Market Revenues & Volume, By Feed Grade, 2022 - 2032F |
6.2.5 Bulgaria Copper Sulfate Market Revenues & Volume, By Others, 2022 - 2032F |
6.3 Bulgaria Copper Sulfate Market, By Application |
6.3.1 Overview and Analysis |
6.3.2 Bulgaria Copper Sulfate Market Revenues & Volume, By Fungicide, 2022 - 2032F |
6.3.3 Bulgaria Copper Sulfate Market Revenues & Volume, By Electroplating, 2022 - 2032F |
6.3.4 Bulgaria Copper Sulfate Market Revenues & Volume, By Feed Additive, 2022 - 2032F |
6.3.5 Bulgaria Copper Sulfate Market Revenues & Volume, By Others, 2022 - 2032F |
6.4 Bulgaria Copper Sulfate Market, By End-Use |
6.4.1 Overview and Analysis |
6.4.2 Bulgaria Copper Sulfate Market Revenues & Volume, By Agriculture, 2022 - 2032F |
6.4.3 Bulgaria Copper Sulfate Market Revenues & Volume, By Electronics, 2022 - 2032F |
6.4.4 Bulgaria Copper Sulfate Market Revenues & Volume, By Animal Nutrition, 2022 - 2032F |
6.4.5 Bulgaria Copper Sulfate Market Revenues & Volume, By Others, 2022 - 2032F |
6.5 Bulgaria Copper Sulfate Market, By Distribution Channel |
6.5.1 Overview and Analysis |
6.5.2 Bulgaria Copper Sulfate Market Revenues & Volume, By Direct Sales, 2022 - 2032F |
6.5.3 Bulgaria Copper Sulfate Market Revenues & Volume, By Distributors, 2022 - 2032F |
6.5.4 Bulgaria Copper Sulfate Market Revenues & Volume, By Online Sales, 2022 - 2032F |
6.5.5 Bulgaria Copper Sulfate Market Revenues & Volume, By Others, 2022 - 2032F |
7 Bulgaria Copper Sulfate Market Import-Export Trade Statistics |
7.1 Bulgaria Copper Sulfate Market Export to Major Countries |
7.2 Bulgaria Copper Sulfate Market Imports from Major Countries |
8 Bulgaria Copper Sulfate Market Key Performance Indicators |
8.1 Number of new product developments or innovations in the copper sulfate market. |
8.2 Adoption rate of copper sulfate in different industries and applications. |
8.3 Environmental compliance metrics related to the safe usage and disposal of copper sulfate. |
9 Bulgaria Copper Sulfate Market - Opportunity Assessment |
9.1 Bulgaria Copper Sulfate Market Opportunity Assessment, By Form, 2022 & 2032F |
9.2 Bulgaria Copper Sulfate Market Opportunity Assessment, By Grade, 2022 & 2032F |
9.3 Bulgaria Copper Sulfate Market Opportunity Assessment, By Application, 2022 & 2032F |
9.4 Bulgaria Copper Sulfate Market Opportunity Assessment, By End-Use, 2022 & 2032F |
9.5 Bulgaria Copper Sulfate Market Opportunity Assessment, By Distribution Channel, 2022 & 2032F |
10 Bulgaria Copper Sulfate Market - Competitive Landscape |
10.1 Bulgaria Copper Sulfate Market Revenue Share, By Companies, 2025 |
10.2 Bulgaria Copper Sulfate Market Competitive Benchmarking, By Operating and Technical Parameters |
11 Company Profiles |
12 Recommendations |
13 Disclaimer |
Export potential assessment - trade Analytics for 2030
Export potential enables firms to identify high-growth global markets with greater confidence by combining advanced trade intelligence with a structured quantitative methodology. The framework analyzes emerging demand trends and country-level import patterns while integrating macroeconomic and trade datasets such as GDP and population forecasts, bilateral import–export flows, tariff structures, elasticity differentials between developed and developing economies, geographic distance, and import demand projections. Using weighted trade values from 2020–2024 as the base period to project country-to-country export potential for 2030, these inputs are operationalized through calculated drivers such as gravity model parameters, tariff impact factors, and projected GDP per-capita growth. Through an analysis of hidden potentials, demand hotspots, and market conditions that are most favorable to success, this method enables firms to focus on target countries, maximize returns, and global expansion with data, backed by accuracy.
By factoring in the projected importer demand gap that is currently unmet and could be potential opportunity, it identifies the potential for the Exporter (Country) among 190 countries, against the general trade analysis, which identifies the biggest importer or exporter.
To discover high-growth global markets and optimize your business strategy:
Click Here
Pricing
- Single User License$ 1,995
- Department License$ 2,400
- Site License$ 3,120
- Global License$ 3,795

Search
Thought Leadership and Analyst Meet


Our Clients
Latest Reports
- France Thermally Conductive Filler Dispersants Market (2026-2032) | Challenges, Restraints, Value, Share, Size, segmentation, Analysis, Trends, Investment Opportunities, Outlook, Pricing, Demand, Forecast, Revenue, Companies, Growth, Drivers, Strategy, Insights, Competition
- Egypt Thermally Conductive Filler Dispersants Market (2026-2032) | Competition, Forecast, Strategy, Value, Insights, Outlook, Investment Opportunities, Pricing, Demand, Share, segmentation, Drivers, Size, Companies, Restraints, Growth, Trends, Revenue, Challenges, Analysis
- Czech Republic Thermally Conductive Filler Dispersants Market (2026-2032) | Forecast, Pricing, Analysis, Drivers, Insights, Size, Demand, Growth, Challenges, segmentation, Competition, Outlook, Trends, Investment Opportunities, Companies, Strategy, Revenue, Share, Value, Restraints
- Colombia Thermally Conductive Filler Dispersants Market (2026-2032) | segmentation, Trends, Share, Drivers, Strategy, Companies, Demand, Insights, Size, Challenges, Value, Competition, Analysis, Growth, Revenue, Restraints, Forecast, Pricing, Outlook, Investment Opportunities
- China Thermally Conductive Filler Dispersants Market (2026-2032) | Restraints, Investment Opportunities, Pricing, Companies, Share, Size, Challenges, Trends, Outlook, Value, Analysis, Competition, Revenue, Drivers, Forecast, Demand, Insights, Growth, Strategy, segmentation
- Chile Thermally Conductive Filler Dispersants Market (2026-2032) | Investment Opportunities, Trends, Value, Restraints, Share, Companies, Forecast, segmentation, Pricing, Challenges, Demand, Size, Analysis, Drivers, Outlook, Growth, Competition, Strategy, Revenue, Insights
- Cambodia Thermally Conductive Filler Dispersants Market (2026-2032) | Analysis, Share, Outlook, Strategy, Pricing, Demand, Size, Growth, segmentation, Insights, Revenue, Forecast, Challenges, Competition, Companies, Investment Opportunities, Trends, Restraints, Value, Drivers
- Brazil Thermally Conductive Filler Dispersants Market (2026-2032) | Restraints, Forecast, Competition, Size, Revenue, Value, Investment Opportunities, Trends, Insights, Outlook, Growth, Analysis, Drivers, segmentation, Pricing, Challenges, Strategy, Share, Companies, Demand
- Bangladesh Thermally Conductive Filler Dispersants Market (2026-2032) | Restraints, Trends, Analysis, Competition, Insights, Forecast, Value, Investment Opportunities, Pricing, Share, Demand, Outlook, Revenue, segmentation, Companies, Drivers, Growth, Size, Challenges, Strategy
- Bahrain Thermally Conductive Filler Dispersants Market (2026-2032) | Trends, Outlook, Pricing, Demand, Value, Competition, Forecast, Growth, segmentation, Revenue, Companies, Analysis, Insights, Size, Drivers, Challenges, Strategy, Investment Opportunities, Share, Restraints
Industry Events and Analyst Meet

HIMTEX 2026

India Refining Summit 2026

India EV Show 2026

EV tech India Expo 2026

Auto Tech Asia 2026
Whitepaper
- Middle East & Africa Commercial Security Market Click here to view more.
- Middle East & Africa Fire Safety Systems & Equipment Market Click here to view more.
- GCC Drone Market Click here to view more.
- Middle East Lighting Fixture Market Click here to view more.
- GCC Physical & Perimeter Security Market Click here to view more.
6WResearch In News
- Doha a strategic location for EV manufacturing hub: IPA Qatar
- Demand for luxury TVs surging in the GCC, says Samsung
- Empowering Growth: The Thriving Journey of Bangladesh’s Cable Industry
- Demand for luxury TVs surging in the GCC, says Samsung
- Video call with a traditional healer? Once unthinkable, it’s now common in South Africa
- Intelligent Buildings To Smooth GCC’s Path To Net Zero