Bulgaria Investment Castings Market (2026-2032) | Share, Investment Trends, Industry, Drivers, Forecast, Opportunities, Challenges, Competition, Demand, Segmentation, Outlook, Supply, Analysis, Competitive, Revenue, Companies, Size, Value, Restraints, Trends, Strategic Insights, Growth, Consumer Insights, Segments, Pricing Analysis, Strategy
Market Forecast By Material (Stainless Steel, Aluminum, Titanium), By Application (Aerospace, Automotive, Medical), By Process Type (Silica Sol, Sodium Silicate), By End-Use (Industrial Machinery, Defense, Oil and Gas) And Competitive Landscape
| Product Code: ETC12851274 | Publication Date: Apr 2025 | Updated Date: Apr 2026 | Product Type: Market Research Report | |
| Publisher: 6Wresearch | Author: Sachin Kumar Rai | No. of Pages: 65 | No. of Figures: 34 | No. of Tables: 19 |
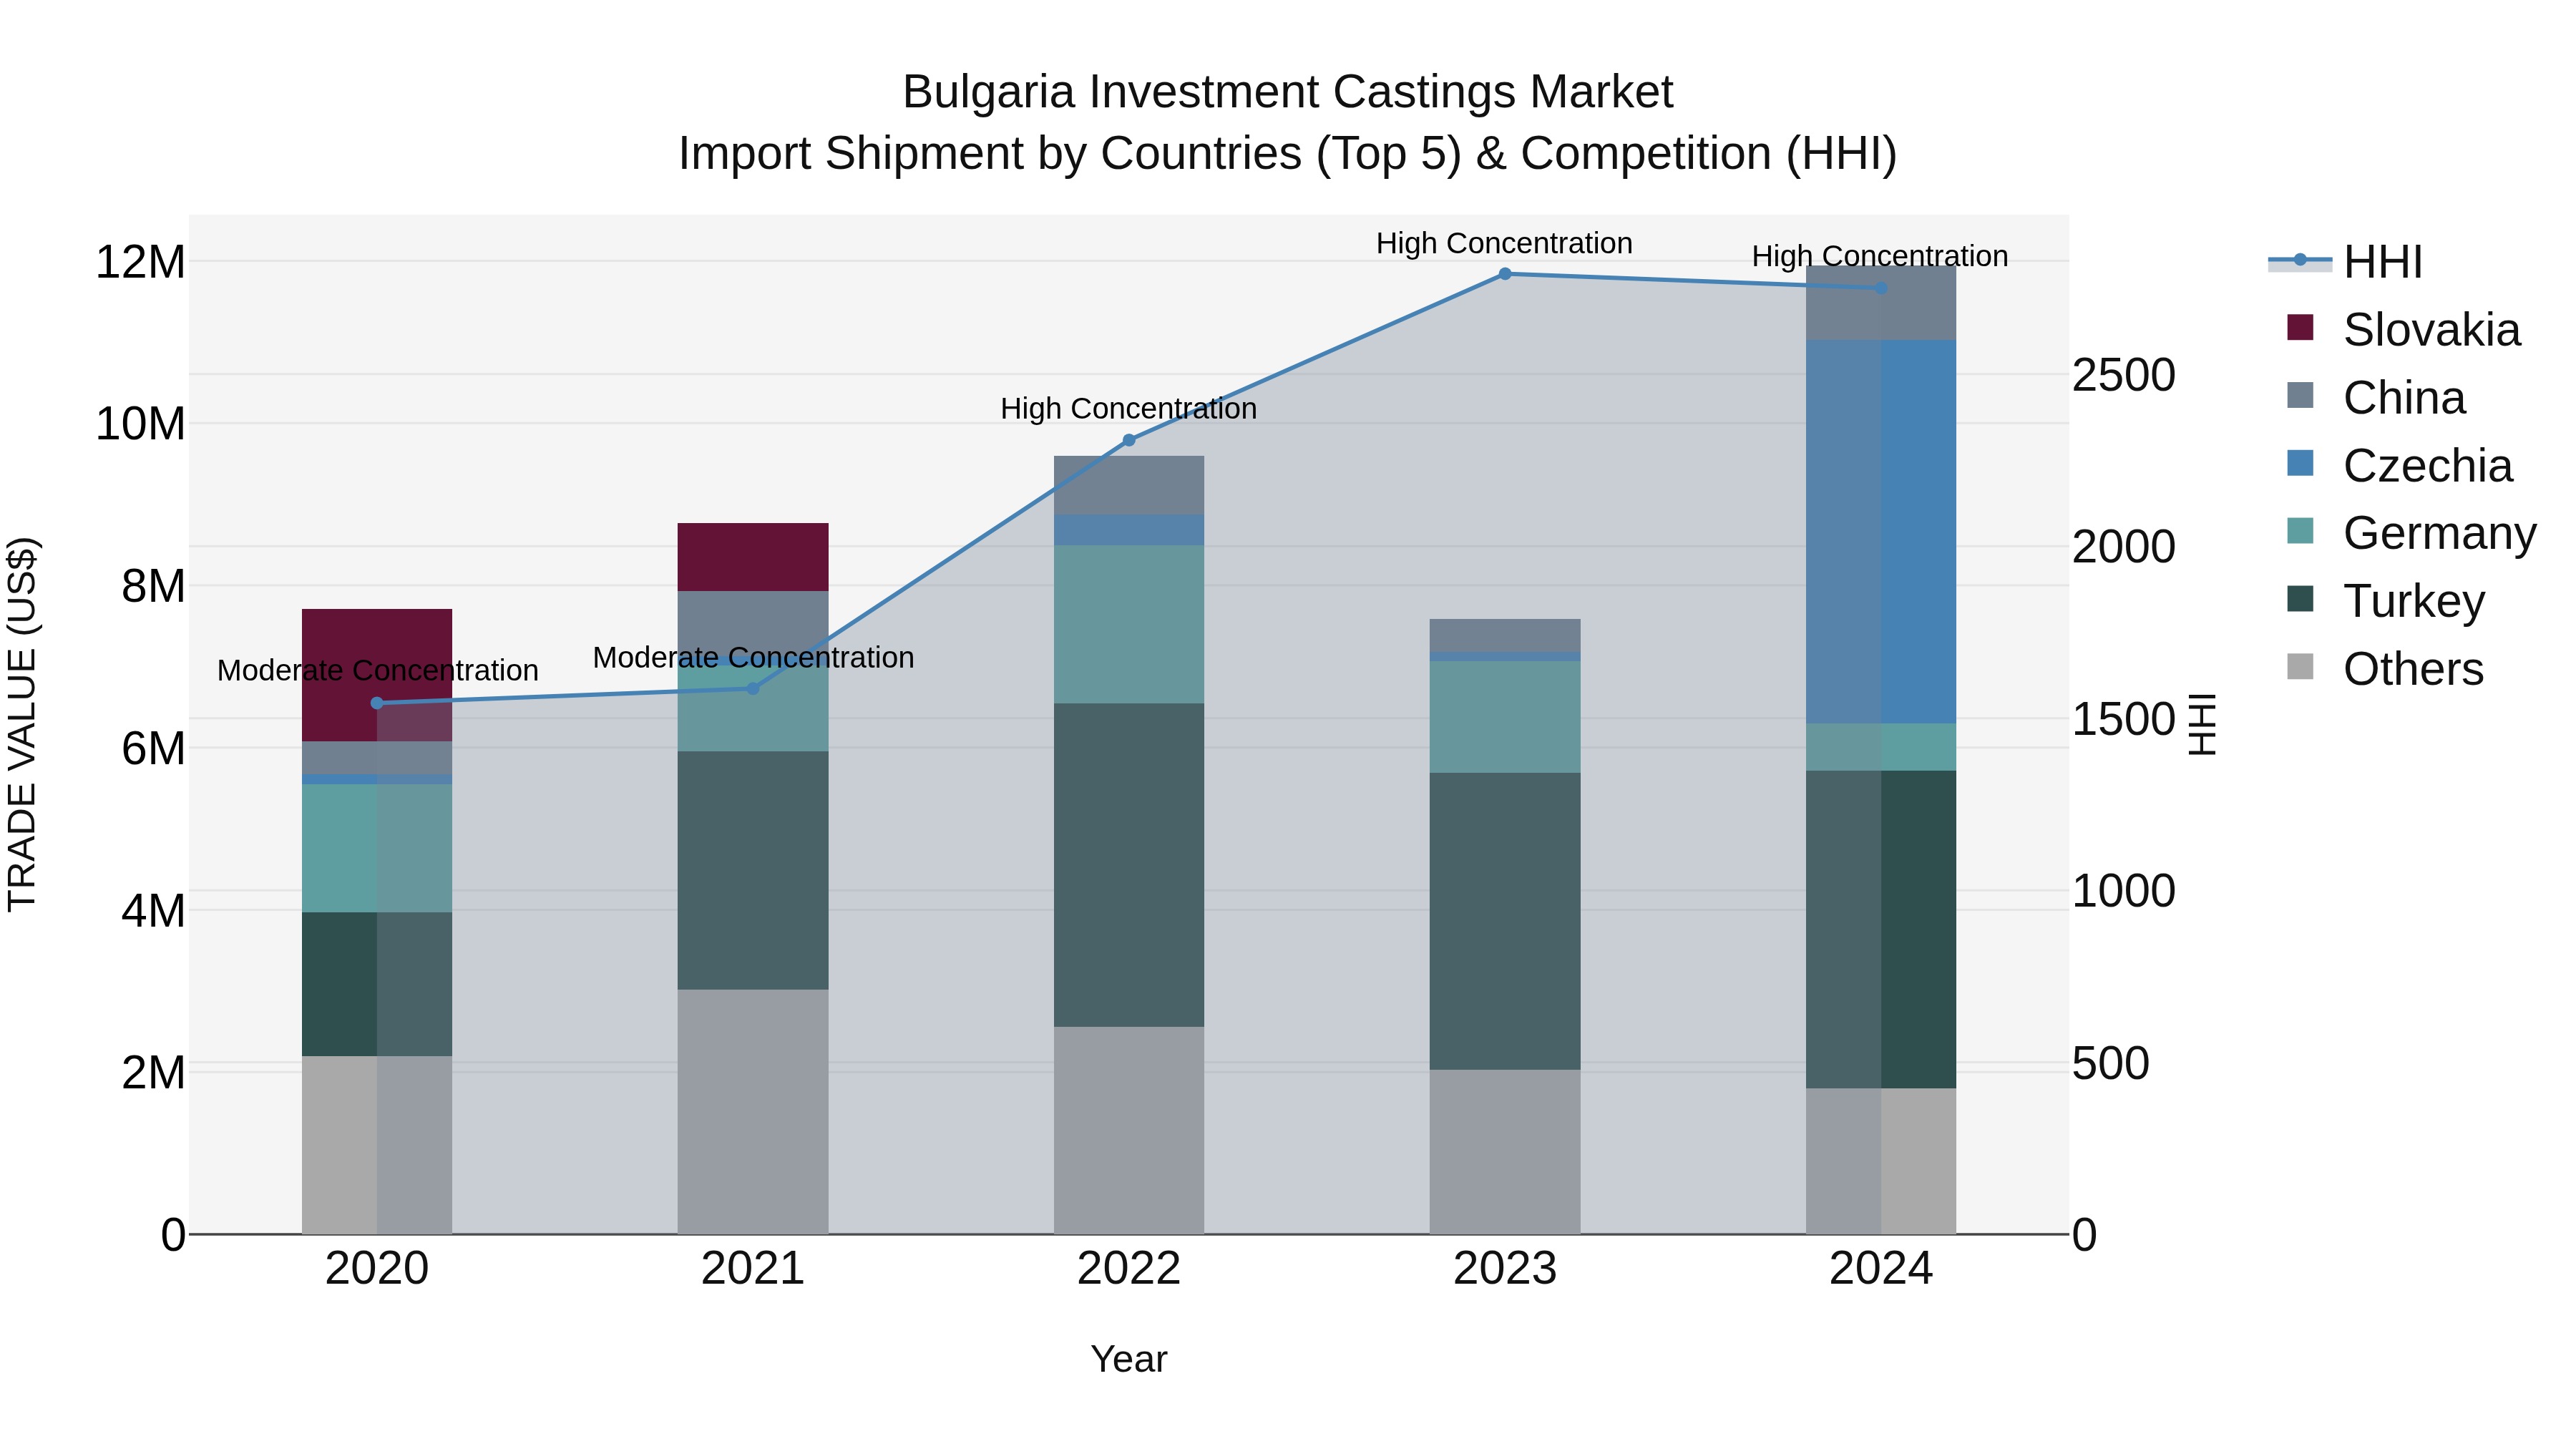
Bulgaria Investment Castings Market Top 5 Importing Countries and Market Competition (HHI) Analysis
Bulgaria`s import of investment castings saw significant growth in 2024, with top exporters being Czechia, Turkey, China, Germany, and Metropolitan France. The high Herfindahl-Hirschman Index (HHI) indicates a concentrated Market Top 5 Importing Countries and Market Competition (HHI) Analysis . The compound annual growth rate (CAGR) from 2020 to 2024 stood at a promising 11.55%, while the growth rate from 2023 to 2024 spiked at 57.47%, reflecting a strong upward trend in Bulgaria`s import shipments of investment castings. This data suggests a thriving Market Top 5 Importing Countries and Market Competition (HHI) Analysis with increasing demand for these products in Bulgaria.
Key Highlights of the Report:
- Bulgaria Investment Castings Market Outlook
- Market Size of Bulgaria Investment Castings Market, 2025
- Forecast of Bulgaria Investment Castings Market, 2032
- Historical Data and Forecast of Bulgaria Investment Castings Revenues & Volume for the Period 2022 - 2032F
- Bulgaria Investment Castings Market Trend Evolution
- Bulgaria Investment Castings Market Drivers and Challenges
- Bulgaria Investment Castings Price Trends
- Bulgaria Investment Castings Porter's Five Forces
- Bulgaria Investment Castings Industry Life Cycle
- Historical Data and Forecast of Bulgaria Investment Castings Market Revenues & Volume By Material for the Period 2022 - 2032F
- Historical Data and Forecast of Bulgaria Investment Castings Market Revenues & Volume By Stainless Steel for the Period 2022 - 2032F
- Historical Data and Forecast of Bulgaria Investment Castings Market Revenues & Volume By Aluminum for the Period 2022 - 2032F
- Historical Data and Forecast of Bulgaria Investment Castings Market Revenues & Volume By Titanium for the Period 2022 - 2032F
- Historical Data and Forecast of Bulgaria Investment Castings Market Revenues & Volume By Application for the Period 2022 - 2032F
- Historical Data and Forecast of Bulgaria Investment Castings Market Revenues & Volume By Aerospace for the Period 2022 - 2032F
- Historical Data and Forecast of Bulgaria Investment Castings Market Revenues & Volume By Automotive for the Period 2022 - 2032F
- Historical Data and Forecast of Bulgaria Investment Castings Market Revenues & Volume By Medical for the Period 2022 - 2032F
- Historical Data and Forecast of Bulgaria Investment Castings Market Revenues & Volume By Process Type for the Period 2022 - 2032F
- Historical Data and Forecast of Bulgaria Investment Castings Market Revenues & Volume By Silica Sol for the Period 2022 - 2032F
- Historical Data and Forecast of Bulgaria Investment Castings Market Revenues & Volume By Sodium Silicate for the Period 2022 - 2032F
- Historical Data and Forecast of Bulgaria Investment Castings Market Revenues & Volume By End-Use for the Period 2022 - 2032F
- Historical Data and Forecast of Bulgaria Investment Castings Market Revenues & Volume By Industrial Machinery for the Period 2022 - 2032F
- Historical Data and Forecast of Bulgaria Investment Castings Market Revenues & Volume By Defense for the Period 2022 - 2032F
- Historical Data and Forecast of Bulgaria Investment Castings Market Revenues & Volume By Oil and Gas for the Period 2022 - 2032F
- Bulgaria Investment Castings Import Export Trade Statistics
- Market Opportunity Assessment By Material
- Market Opportunity Assessment By Application
- Market Opportunity Assessment By Process Type
- Market Opportunity Assessment By End-Use
- Bulgaria Investment Castings Top Companies Market Share
- Bulgaria Investment Castings Competitive Benchmarking By Technical and Operational Parameters
- Bulgaria Investment Castings Company Profiles
- Bulgaria Investment Castings Key Strategic Recommendations
Frequently Asked Questions About the Market Study (FAQs):
6Wresearch actively monitors the Bulgaria Investment Castings Market and publishes its comprehensive annual report, highlighting emerging trends, growth drivers, revenue analysis, and forecast outlook. Our insights help businesses to make data-backed strategic decisions with ongoing market dynamics. Our analysts track relevent industries related to the Bulgaria Investment Castings Market, allowing our clients with actionable intelligence and reliable forecasts tailored to emerging regional needs.
Yes, we provide customisation as per your requirements. To learn more, feel free to contact us on sales@6wresearch.com
1 Executive Summary |
2 Introduction |
2.1 Key Highlights of the Report |
2.2 Report Description |
2.3 Market Scope & Segmentation |
2.4 Research Methodology |
2.5 Assumptions |
3 Bulgaria Investment Castings Market Overview |
3.1 Bulgaria Country Macro Economic Indicators |
3.2 Bulgaria Investment Castings Market Revenues & Volume, 2022 & 2032F |
3.3 Bulgaria Investment Castings Market - Industry Life Cycle |
3.4 Bulgaria Investment Castings Market - Porter's Five Forces |
3.5 Bulgaria Investment Castings Market Revenues & Volume Share, By Material, 2022 & 2032F |
3.6 Bulgaria Investment Castings Market Revenues & Volume Share, By Application, 2022 & 2032F |
3.7 Bulgaria Investment Castings Market Revenues & Volume Share, By Process Type, 2022 & 2032F |
3.8 Bulgaria Investment Castings Market Revenues & Volume Share, By End-Use, 2022 & 2032F |
4 Bulgaria Investment Castings Market Dynamics |
4.1 Impact Analysis |
4.2 Market Drivers |
4.2.1 Increasing demand for lightweight and complex-shaped components in industries such as automotive, aerospace, and healthcare. |
4.2.2 Growing adoption of investment castings due to their superior surface finish and dimensional accuracy compared to other casting methods. |
4.2.3 Technological advancements in the casting process leading to improved efficiency and cost-effectiveness. |
4.3 Market Restraints |
4.3.1 High initial setup costs and longer lead times associated with investment casting processes. |
4.3.2 Fluctuating raw material prices impacting the overall production cost and profitability. |
4.3.3 Intense competition from alternative manufacturing methods like sand casting or die casting. |
5 Bulgaria Investment Castings Market Trends |
6 Bulgaria Investment Castings Market, By Types |
6.1 Bulgaria Investment Castings Market, By Material |
6.1.1 Overview and Analysis |
6.1.2 Bulgaria Investment Castings Market Revenues & Volume, By Material, 2022 - 2032F |
6.1.3 Bulgaria Investment Castings Market Revenues & Volume, By Stainless Steel, 2022 - 2032F |
6.1.4 Bulgaria Investment Castings Market Revenues & Volume, By Aluminum, 2022 - 2032F |
6.1.5 Bulgaria Investment Castings Market Revenues & Volume, By Titanium, 2022 - 2032F |
6.2 Bulgaria Investment Castings Market, By Application |
6.2.1 Overview and Analysis |
6.2.2 Bulgaria Investment Castings Market Revenues & Volume, By Aerospace, 2022 - 2032F |
6.2.3 Bulgaria Investment Castings Market Revenues & Volume, By Automotive, 2022 - 2032F |
6.2.4 Bulgaria Investment Castings Market Revenues & Volume, By Medical, 2022 - 2032F |
6.3 Bulgaria Investment Castings Market, By Process Type |
6.3.1 Overview and Analysis |
6.3.2 Bulgaria Investment Castings Market Revenues & Volume, By Silica Sol, 2022 - 2032F |
6.3.3 Bulgaria Investment Castings Market Revenues & Volume, By Sodium Silicate, 2022 - 2032F |
6.4 Bulgaria Investment Castings Market, By End-Use |
6.4.1 Overview and Analysis |
6.4.2 Bulgaria Investment Castings Market Revenues & Volume, By Industrial Machinery, 2022 - 2032F |
6.4.3 Bulgaria Investment Castings Market Revenues & Volume, By Defense, 2022 - 2032F |
6.4.4 Bulgaria Investment Castings Market Revenues & Volume, By Oil and Gas, 2022 - 2032F |
7 Bulgaria Investment Castings Market Import-Export Trade Statistics |
7.1 Bulgaria Investment Castings Market Export to Major Countries |
7.2 Bulgaria Investment Castings Market Imports from Major Countries |
8 Bulgaria Investment Castings Market Key Performance Indicators |
8.1 Scrap and rework rates: Lower rates indicate better process efficiency and cost effectiveness. |
8.2 On-time delivery performance: Ensuring timely delivery of cast components to customers. |
8.3 Customer satisfaction index: Reflecting the quality and reliability of the investment castings produced. |
8.4 Employee training hours: Investing in workforce skills to improve productivity and innovation in the casting process. |
8.5 Energy consumption per unit: Monitoring and optimizing energy usage for sustainable manufacturing practices. |
9 Bulgaria Investment Castings Market - Opportunity Assessment |
9.1 Bulgaria Investment Castings Market Opportunity Assessment, By Material, 2022 & 2032F |
9.2 Bulgaria Investment Castings Market Opportunity Assessment, By Application, 2022 & 2032F |
9.3 Bulgaria Investment Castings Market Opportunity Assessment, By Process Type, 2022 & 2032F |
9.4 Bulgaria Investment Castings Market Opportunity Assessment, By End-Use, 2022 & 2032F |
10 Bulgaria Investment Castings Market - Competitive Landscape |
10.1 Bulgaria Investment Castings Market Revenue Share, By Companies, 2025 |
10.2 Bulgaria Investment Castings Market Competitive Benchmarking, By Operating and Technical Parameters |
11 Company Profiles |
12 Recommendations |
13 Disclaimer |
Export potential assessment - trade Analytics for 2030
Export potential enables firms to identify high-growth global markets with greater confidence by combining advanced trade intelligence with a structured quantitative methodology. The framework analyzes emerging demand trends and country-level import patterns while integrating macroeconomic and trade datasets such as GDP and population forecasts, bilateral import–export flows, tariff structures, elasticity differentials between developed and developing economies, geographic distance, and import demand projections. Using weighted trade values from 2020–2024 as the base period to project country-to-country export potential for 2030, these inputs are operationalized through calculated drivers such as gravity model parameters, tariff impact factors, and projected GDP per-capita growth. Through an analysis of hidden potentials, demand hotspots, and market conditions that are most favorable to success, this method enables firms to focus on target countries, maximize returns, and global expansion with data, backed by accuracy.
By factoring in the projected importer demand gap that is currently unmet and could be potential opportunity, it identifies the potential for the Exporter (Country) among 190 countries, against the general trade analysis, which identifies the biggest importer or exporter.
To discover high-growth global markets and optimize your business strategy:
Click Here
Pricing
- Single User License$ 1,995
- Department License$ 2,400
- Site License$ 3,120
- Global License$ 3,795

Search
Thought Leadership and Analyst Meet


Our Clients
Latest Reports
- China Electric Appliance Rental Market (2026-2032) | Trends, Revenue, Growth, Challenges, Size, Value, Outlook, Pricing, Strategy, Insights, Restraints, segmentation, Companies, Investment Opportunities, Analysis, Demand, Drivers, Competition, Forecast, Share
- Chile Electric Appliance Rental Market (2026-2032) | Outlook, Competition, Drivers, Strategy, Revenue, Analysis, Value, Pricing, Restraints, Size, Demand, Share, Growth, Forecast, Challenges, Insights, Investment Opportunities, Companies, Trends, segmentation
- Cambodia Electric Appliance Rental Market (2026-2032) | Companies, Analysis, Restraints, Pricing, Insights, Challenges, Outlook, Strategy, Forecast, Trends, Competition, Value, Revenue, Investment Opportunities, segmentation, Drivers, Size, Demand, Growth, Share
- Brazil Electric Appliance Rental Market (2026-2032) | Revenue, Strategy, Forecast, Companies, segmentation, Competition, Size, Investment Opportunities, Pricing, Restraints, Outlook, Challenges, Analysis, Drivers, Value, Demand, Insights, Trends, Growth, Share
- Bangladesh Electric Appliance Rental Market (2026-2032) | Drivers, Forecast, Investment Opportunities, Strategy, Insights, Demand, Challenges, Outlook, Trends, Competition, Value, Revenue, Size, Pricing, Analysis, Companies, Restraints, segmentation, Share, Growth
- Bahrain Electric Appliance Rental Market (2026-2032) | Outlook, Size, Competition, Restraints, Drivers, Value, Trends, Investment Opportunities, Insights, Forecast, Revenue, Strategy, Growth, Share, Demand, Analysis, Challenges, Companies, segmentation, Pricing
- Azerbaijan Electric Appliance Rental Market (2026-2032) | Trends, Investment Opportunities, Restraints, Insights, Strategy, Competition, Value, Growth, Demand, Drivers, Analysis, Forecast, Size, Share, Outlook, segmentation, Pricing, Challenges, Revenue, Companies
- Australia Electric Appliance Rental Market (2026-2032) | Challenges, Restraints, Forecast, Demand, Size, Competition, Pricing, Investment Opportunities, Revenue, Trends, Drivers, Growth, Outlook, Analysis, Strategy, Value, segmentation, Insights, Companies, Share
- Argentina Electric Appliance Rental Market (2026-2032) | Growth, Trends, Insights, Outlook, Forecast, Size, Drivers, Analysis, Restraints, Challenges, Share, Revenue, Investment Opportunities, Strategy, Demand, Value, Companies, segmentation, Competition, Pricing
- Algeria Electric Appliance Rental Market (2026-2032) | Share, Size, Value, Strategy, Competition, Outlook, Challenges, Companies, Trends, Pricing, Insights, Forecast, Investment Opportunities, Revenue, Growth, Restraints, segmentation, Analysis, Demand, Drivers
Industry Events and Analyst Meet

HIMTEX 2026

India Refining Summit 2026

India EV Show 2026

EV tech India Expo 2026

Auto Tech Asia 2026
Whitepaper
- Middle East & Africa Commercial Security Market Click here to view more.
- Middle East & Africa Fire Safety Systems & Equipment Market Click here to view more.
- GCC Drone Market Click here to view more.
- Middle East Lighting Fixture Market Click here to view more.
- GCC Physical & Perimeter Security Market Click here to view more.
6WResearch In News
- Doha a strategic location for EV manufacturing hub: IPA Qatar
- Demand for luxury TVs surging in the GCC, says Samsung
- Empowering Growth: The Thriving Journey of Bangladesh’s Cable Industry
- Demand for luxury TVs surging in the GCC, says Samsung
- Video call with a traditional healer? Once unthinkable, it’s now common in South Africa
- Intelligent Buildings To Smooth GCC’s Path To Net Zero