Burundi Ink Market (2025-2031) | Companies, Outlook, Growth, Industry, Trends, Size, Value, Segmentation, Revenue, Forecast, Analysis & Share
Market Forecast By Technology (Lithographic , Flexographic , Gravure, Digital, Letterpress, Others), By Ink Type (Oil Based, Solvent Based, Water Based), By Applications (Label And Packaging, Commercial Printing, Publications, Others) And Competitive Landscape
| Product Code: ETC5098967 | Publication Date: Nov 2023 | Updated Date: Oct 2025 | Product Type: Market Research Report | |
| Publisher: 6Wresearch | Author: Sachin Kumar Rai | No. of Pages: 60 | No. of Figures: 30 | No. of Tables: 5 |
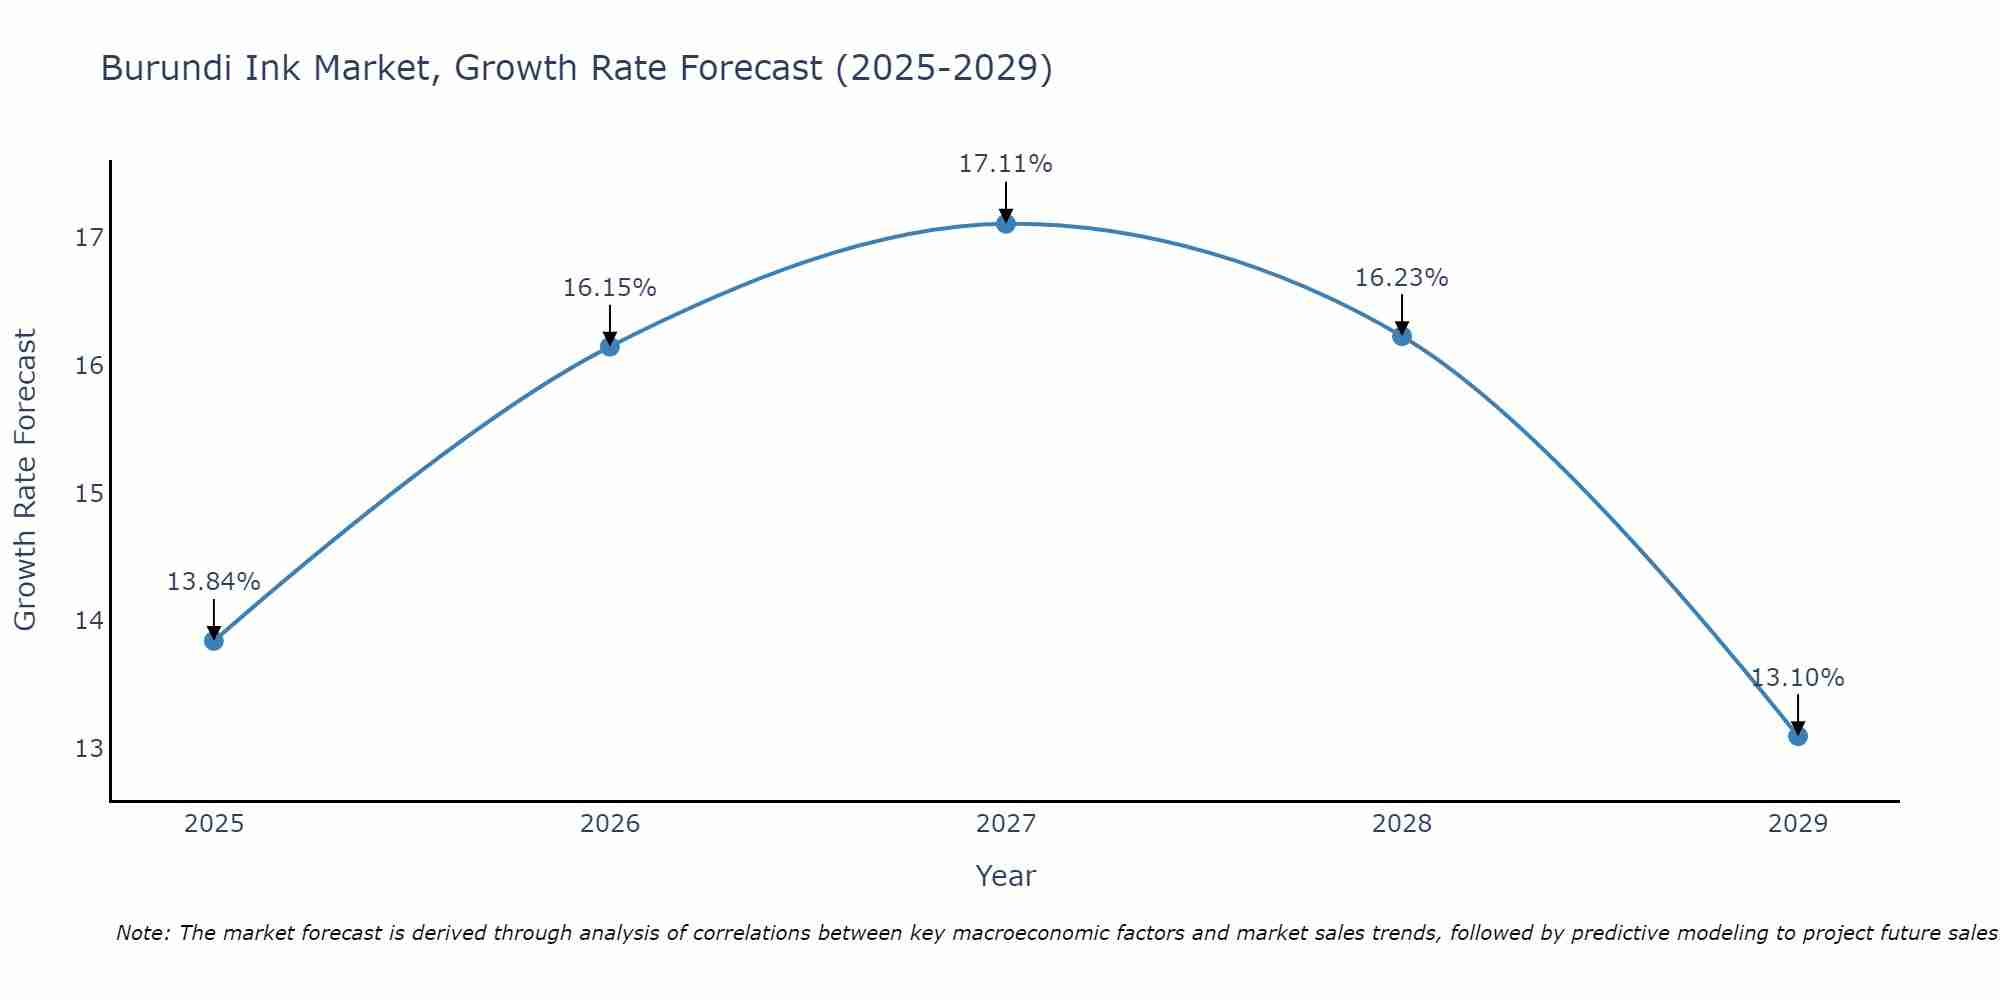
Burundi Ink Market Size Growth Rate
The Burundi Ink Market is projected to witness mixed growth rate patterns during 2025 to 2029. Growth accelerates to 17.11% in 2027, following an initial rate of 13.84%, before easing to 13.10% at the end of the period.
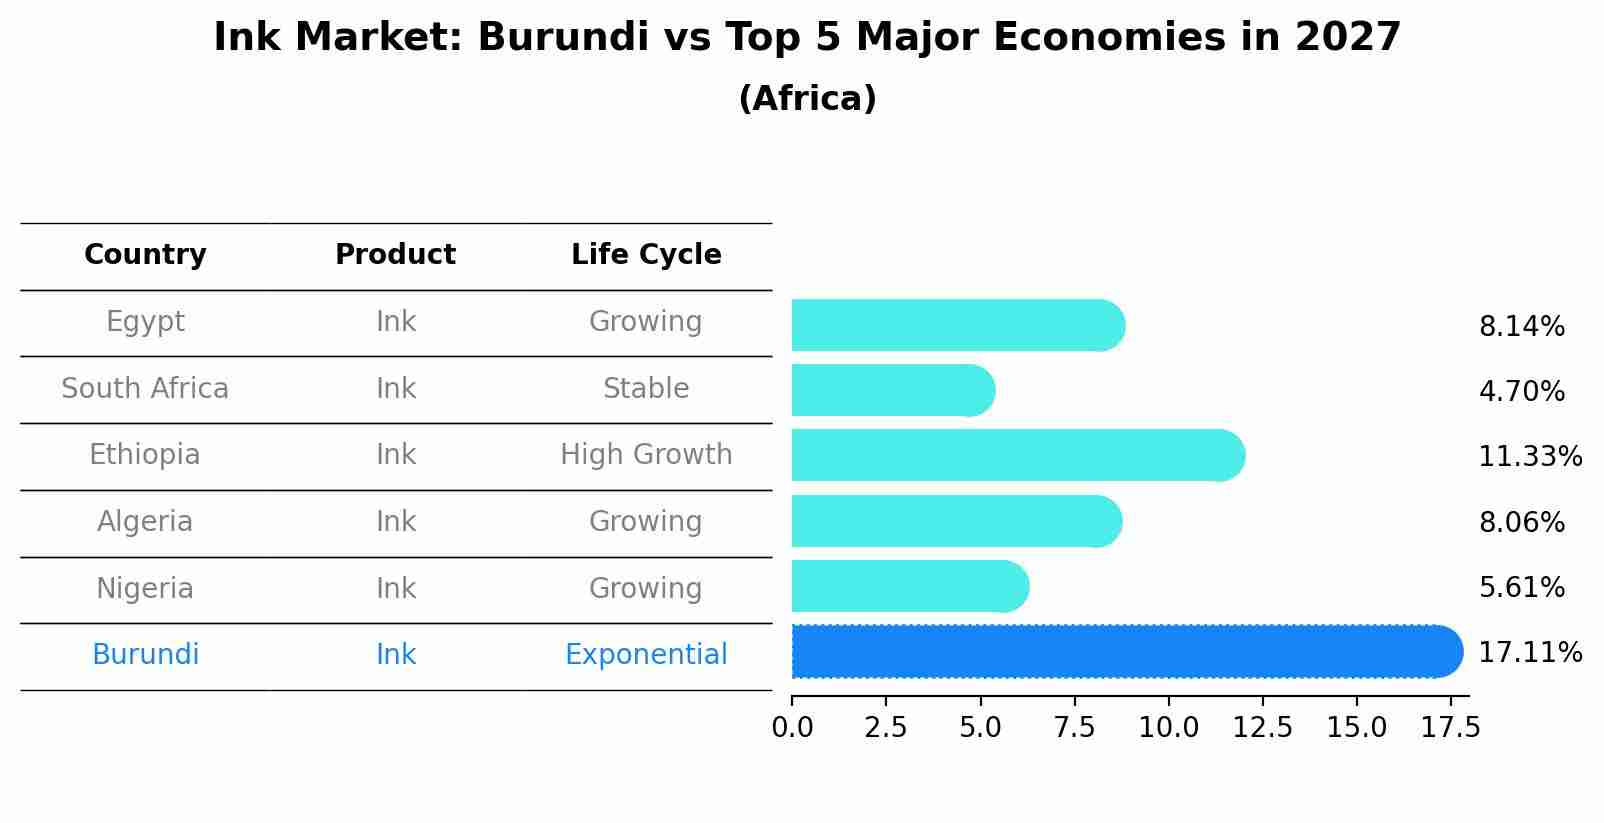
Ink Market: Burundi vs Top 5 Major Economies in 2027 (Africa)
By 2027, the Ink market in Burundi is anticipated to reach a growth rate of 17.11%, as part of an increasingly competitive Africa region, where Egypt remains at the forefront, supported by South Africa, Ethiopia, Algeria and Nigeria, driving innovations and market adoption across sectors.
Burundi Ink Market Overview
The ink market in Burundi involves the production and supply of inks used in printing, writing, and other applications. This market is influenced by the demand for printed materials and the need for high-quality, durable inks. The growth of this market is driven by advancements in ink formulations and technologies, as well as the expanding printing and packaging industries.
/h3
The Burundi Ink Market is influenced by the demand for inks used in printing, packaging, and other applications. Inks are essential for producing printed materials, including labels, packaging, and publications. The growth in printing and packaging industries and the need for high-quality and durable inks drive market expansion.
/h3
The ink market in Burundi faces challenges such as high import costs and limited local manufacturing capabilities. Limited awareness of the benefits and various applications of inks among businesses impacts market growth. Additionally, logistical issues related to the import and distribution of inks, combined with a shortage of skilled professionals and support services, further constrain market development. Inadequate infrastructure affects the efficiency of ink utilization.
/h3
The ink market in Burundi is impacted by government policies that regulate the production and use of inks in various applications, including printing and packaging. The government enforces regulations to ensure ink quality and safety. Incentives for local manufacturing and investment in ink technologies drive market growth as Burundi enhances its printing and packaging industries.
Key Highlights of the Report:
- Burundi Ink Market Outlook
- Market Size of Burundi Ink Market, 2024
- Forecast of Burundi Ink Market, 2031
- Historical Data and Forecast of Burundi Ink Revenues & Volume for the Period 2021-2031
- Burundi Ink Market Trend Evolution
- Burundi Ink Market Drivers and Challenges
- Burundi Ink Price Trends
- Burundi Ink Porter`s Five Forces
- Burundi Ink Industry Life Cycle
- Historical Data and Forecast of Burundi Ink Market Revenues & Volume By Technology for the Period 2021-2031
- Historical Data and Forecast of Burundi Ink Market Revenues & Volume By Lithographic for the Period 2021-2031
- Historical Data and Forecast of Burundi Ink Market Revenues & Volume By Flexographic for the Period 2021-2031
- Historical Data and Forecast of Burundi Ink Market Revenues & Volume By Gravure for the Period 2021-2031
- Historical Data and Forecast of Burundi Ink Market Revenues & Volume By Digital for the Period 2021-2031
- Historical Data and Forecast of Burundi Ink Market Revenues & Volume By Letterpress for the Period 2021-2031
- Historical Data and Forecast of Burundi Ink Market Revenues & Volume By Others for the Period 2021-2031
- Historical Data and Forecast of Burundi Ink Market Revenues & Volume By Ink Type for the Period 2021-2031
- Historical Data and Forecast of Burundi Ink Market Revenues & Volume By Oil Based for the Period 2021-2031
- Historical Data and Forecast of Burundi Ink Market Revenues & Volume By Solvent Based for the Period 2021-2031
- Historical Data and Forecast of Burundi Ink Market Revenues & Volume By Water Based for the Period 2021-2031
- Historical Data and Forecast of Burundi Ink Market Revenues & Volume By Applications for the Period 2021-2031
- Historical Data and Forecast of Burundi Ink Market Revenues & Volume By Label And Packaging for the Period 2021-2031
- Historical Data and Forecast of Burundi Ink Market Revenues & Volume By Commercial Printing for the Period 2021-2031
- Historical Data and Forecast of Burundi Ink Market Revenues & Volume By Publications for the Period 2021-2031
- Historical Data and Forecast of Burundi Ink Market Revenues & Volume By Others for the Period 2021-2031
- Burundi Ink Import Export Trade Statistics
- Market Opportunity Assessment By Technology
- Market Opportunity Assessment By Ink Type
- Market Opportunity Assessment By Applications
- Burundi Ink Top Companies Market Share
- Burundi Ink Competitive Benchmarking By Technical and Operational Parameters
- Burundi Ink Company Profiles
- Burundi Ink Key Strategic Recommendations
Frequently Asked Questions About the Market Study (FAQs):
6Wresearch actively monitors the Burundi Ink Market and publishes its comprehensive annual report, highlighting emerging trends, growth drivers, revenue analysis, and forecast outlook. Our insights help businesses to make data-backed strategic decisions with ongoing market dynamics. Our analysts track relevent industries related to the Burundi Ink Market, allowing our clients with actionable intelligence and reliable forecasts tailored to emerging regional needs.
Yes, we provide customisation as per your requirements. To learn more, feel free to contact us on sales@6wresearch.com
1 Executive Summary |
2 Introduction |
2.1 Key Highlights of the Report |
2.2 Report Description |
2.3 Market Scope & Segmentation |
2.4 Research Methodology |
2.5 Assumptions |
3 Burundi Ink Market Overview |
3.1 Burundi Country Macro Economic Indicators |
3.2 Burundi Ink Market Revenues & Volume, 2021 & 2031F |
3.3 Burundi Ink Market - Industry Life Cycle |
3.4 Burundi Ink Market - Porter's Five Forces |
3.5 Burundi Ink Market Revenues & Volume Share, By Technology, 2021 & 2031F |
3.6 Burundi Ink Market Revenues & Volume Share, By Ink Type, 2021 & 2031F |
3.7 Burundi Ink Market Revenues & Volume Share, By Applications, 2021 & 2031F |
4 Burundi Ink Market Dynamics |
4.1 Impact Analysis |
4.2 Market Drivers |
4.2.1 Increasing demand for printing and packaging materials in Burundi |
4.2.2 Growth of the education sector leading to higher demand for writing materials |
4.2.3 Expansion of businesses and offices driving the need for ink supplies |
4.3 Market Restraints |
4.3.1 Fluctuating prices of raw materials impacting production costs |
4.3.2 Limited availability of high-quality ink products in the market |
4.3.3 Economic challenges affecting consumer purchasing power |
5 Burundi Ink Market Trends |
6 Burundi Ink Market Segmentations |
6.1 Burundi Ink Market, By Technology |
6.1.1 Overview and Analysis |
6.1.2 Burundi Ink Market Revenues & Volume, By Lithographic , 2021-2031F |
6.1.3 Burundi Ink Market Revenues & Volume, By Flexographic , 2021-2031F |
6.1.4 Burundi Ink Market Revenues & Volume, By Gravure, 2021-2031F |
6.1.5 Burundi Ink Market Revenues & Volume, By Digital, 2021-2031F |
6.1.6 Burundi Ink Market Revenues & Volume, By Letterpress, 2021-2031F |
6.1.7 Burundi Ink Market Revenues & Volume, By Others, 2021-2031F |
6.2 Burundi Ink Market, By Ink Type |
6.2.1 Overview and Analysis |
6.2.2 Burundi Ink Market Revenues & Volume, By Oil Based, 2021-2031F |
6.2.3 Burundi Ink Market Revenues & Volume, By Solvent Based, 2021-2031F |
6.2.4 Burundi Ink Market Revenues & Volume, By Water Based, 2021-2031F |
6.3 Burundi Ink Market, By Applications |
6.3.1 Overview and Analysis |
6.3.2 Burundi Ink Market Revenues & Volume, By Label And Packaging, 2021-2031F |
6.3.3 Burundi Ink Market Revenues & Volume, By Commercial Printing, 2021-2031F |
6.3.4 Burundi Ink Market Revenues & Volume, By Publications, 2021-2031F |
6.3.5 Burundi Ink Market Revenues & Volume, By Others, 2021-2031F |
7 Burundi Ink Market Import-Export Trade Statistics |
7.1 Burundi Ink Market Export to Major Countries |
7.2 Burundi Ink Market Imports from Major Countries |
8 Burundi Ink Market Key Performance Indicators |
8.1 Number of new businesses established in Burundi |
8.2 Percentage growth in the education sector |
8.3 Rate of urbanization in key cities in Burundi |
9 Burundi Ink Market - Opportunity Assessment |
9.1 Burundi Ink Market Opportunity Assessment, By Technology, 2021 & 2031F |
9.2 Burundi Ink Market Opportunity Assessment, By Ink Type, 2021 & 2031F |
9.3 Burundi Ink Market Opportunity Assessment, By Applications, 2021 & 2031F |
10 Burundi Ink Market - Competitive Landscape |
10.1 Burundi Ink Market Revenue Share, By Companies, 2024 |
10.2 Burundi Ink Market Competitive Benchmarking, By Operating and Technical Parameters |
11 Company Profiles |
12 Recommendations | 13 Disclaimer |
Global Go To Market Strategy - 2030
Export potential enables firms to identify high-growth global markets with greater confidence by combining advanced trade intelligence with a structured quantitative methodology. The framework analyzes emerging demand trends and country-level import patterns while integrating macroeconomic and trade datasets such as GDP and population forecasts, bilateral import–export flows, tariff structures, elasticity differentials between developed and developing economies, geographic distance, and import demand projections. Using weighted trade values from 2020–2024 as the base period to project country-to-country export potential for 2030, these inputs are operationalized through calculated drivers such as gravity model parameters, tariff impact factors, and projected GDP per-capita growth. Through an analysis of hidden potentials, demand hotspots, and market conditions that are most favorable to success, this method enables firms to focus on target countries, maximize returns, and global expansion with data, backed by accuracy.
By factoring in the projected importer demand gap that is currently unmet and could be potential opportunity, it identifies the potential for the Exporter (Country) among 190 countries, against the general trade analysis, which identifies the biggest importer or exporter.
To discover high-growth global markets and optimize your business strategy:
Click Here
Pricing
- Single User License$ 1,995
- Department License$ 2,400
- Site License$ 3,120
- Global License$ 3,795

Leadership Perspectives from Industry Events
Search
Thought Leadership and Analyst Meet


Our Clients
6WResearch In News
- Doha a strategic location for EV manufacturing hub: IPA Qatar
- Demand for luxury TVs surging in the GCC, says Samsung
- Empowering Growth: The Thriving Journey of Bangladesh’s Cable Industry
- Demand for luxury TVs surging in the GCC, says Samsung
- Video call with a traditional healer? Once unthinkable, it’s now common in South Africa
- Intelligent Buildings To Smooth GCC’s Path To Net Zero
Latest Reports
- New Zealand Aseptic Manufacturing Market (2026-2032)
- Netherlands Aseptic Manufacturing Market (2026-2032)
- Nauru Aseptic Manufacturing Market (2026-2032)
- Namibia Aseptic Manufacturing Market (2026-2032)
- Mozambique Aseptic Manufacturing Market (2026-2032)
- Montenegro Aseptic Manufacturing Market (2026-2032)
- Mongolia Aseptic Manufacturing Market (2026-2032)
- Monaco Aseptic Manufacturing Market (2026-2032)
- Micronesia Aseptic Manufacturing Market (2026-2032)
- Mauritius Aseptic Manufacturing Market (2026-2032)
Industry Events and Analyst Meet

HIMTEX 2026

India Refining Summit 2026

India EV Show 2026

EV tech India Expo 2026

Auto Tech Asia 2026
Whitepaper
- Middle East & Africa Commercial Security Market Click here to view more.
- Middle East & Africa Fire Safety Systems & Equipment Market Click here to view more.
- GCC Drone Market Click here to view more.
- Middle East Lighting Fixture Market Click here to view more.
- GCC Physical & Perimeter Security Market Click here to view more.