Cambodia Graphite Packing Market (2026-2032) | Competition, Share, Analysis, Investment Trends, Growth, Size, Consumer Insights, Strategy, Forecast, Drivers, Challenges, Competitive, Segments, Demand, Supply, Value, Industry, Opportunities, Outlook, Pricing Analysis, Revenue, Companies, Trends, Strategic Insights, Segmentation, Restraints
Market Forecast By Packing Type (Braided Packing, Molded Packing, Ribbon Packing), By Material (Pure Graphite, Graphite with PTFE, Flexible Graphite), By Application (Valves, Pumps, Sealing), By End User (Oil & Gas Industry, Chemical Industry, Power Plants), By Distribution Channel (Direct Sales, Distributors, Online Stores) And Competitive Landscape
| Product Code: ETC12378307 | Publication Date: Apr 2025 | Updated Date: Feb 2026 | Product Type: Market Research Report | |
| Publisher: 6Wresearch | No. of Pages: 65 | No. of Figures: 34 | No. of Tables: 19 | |
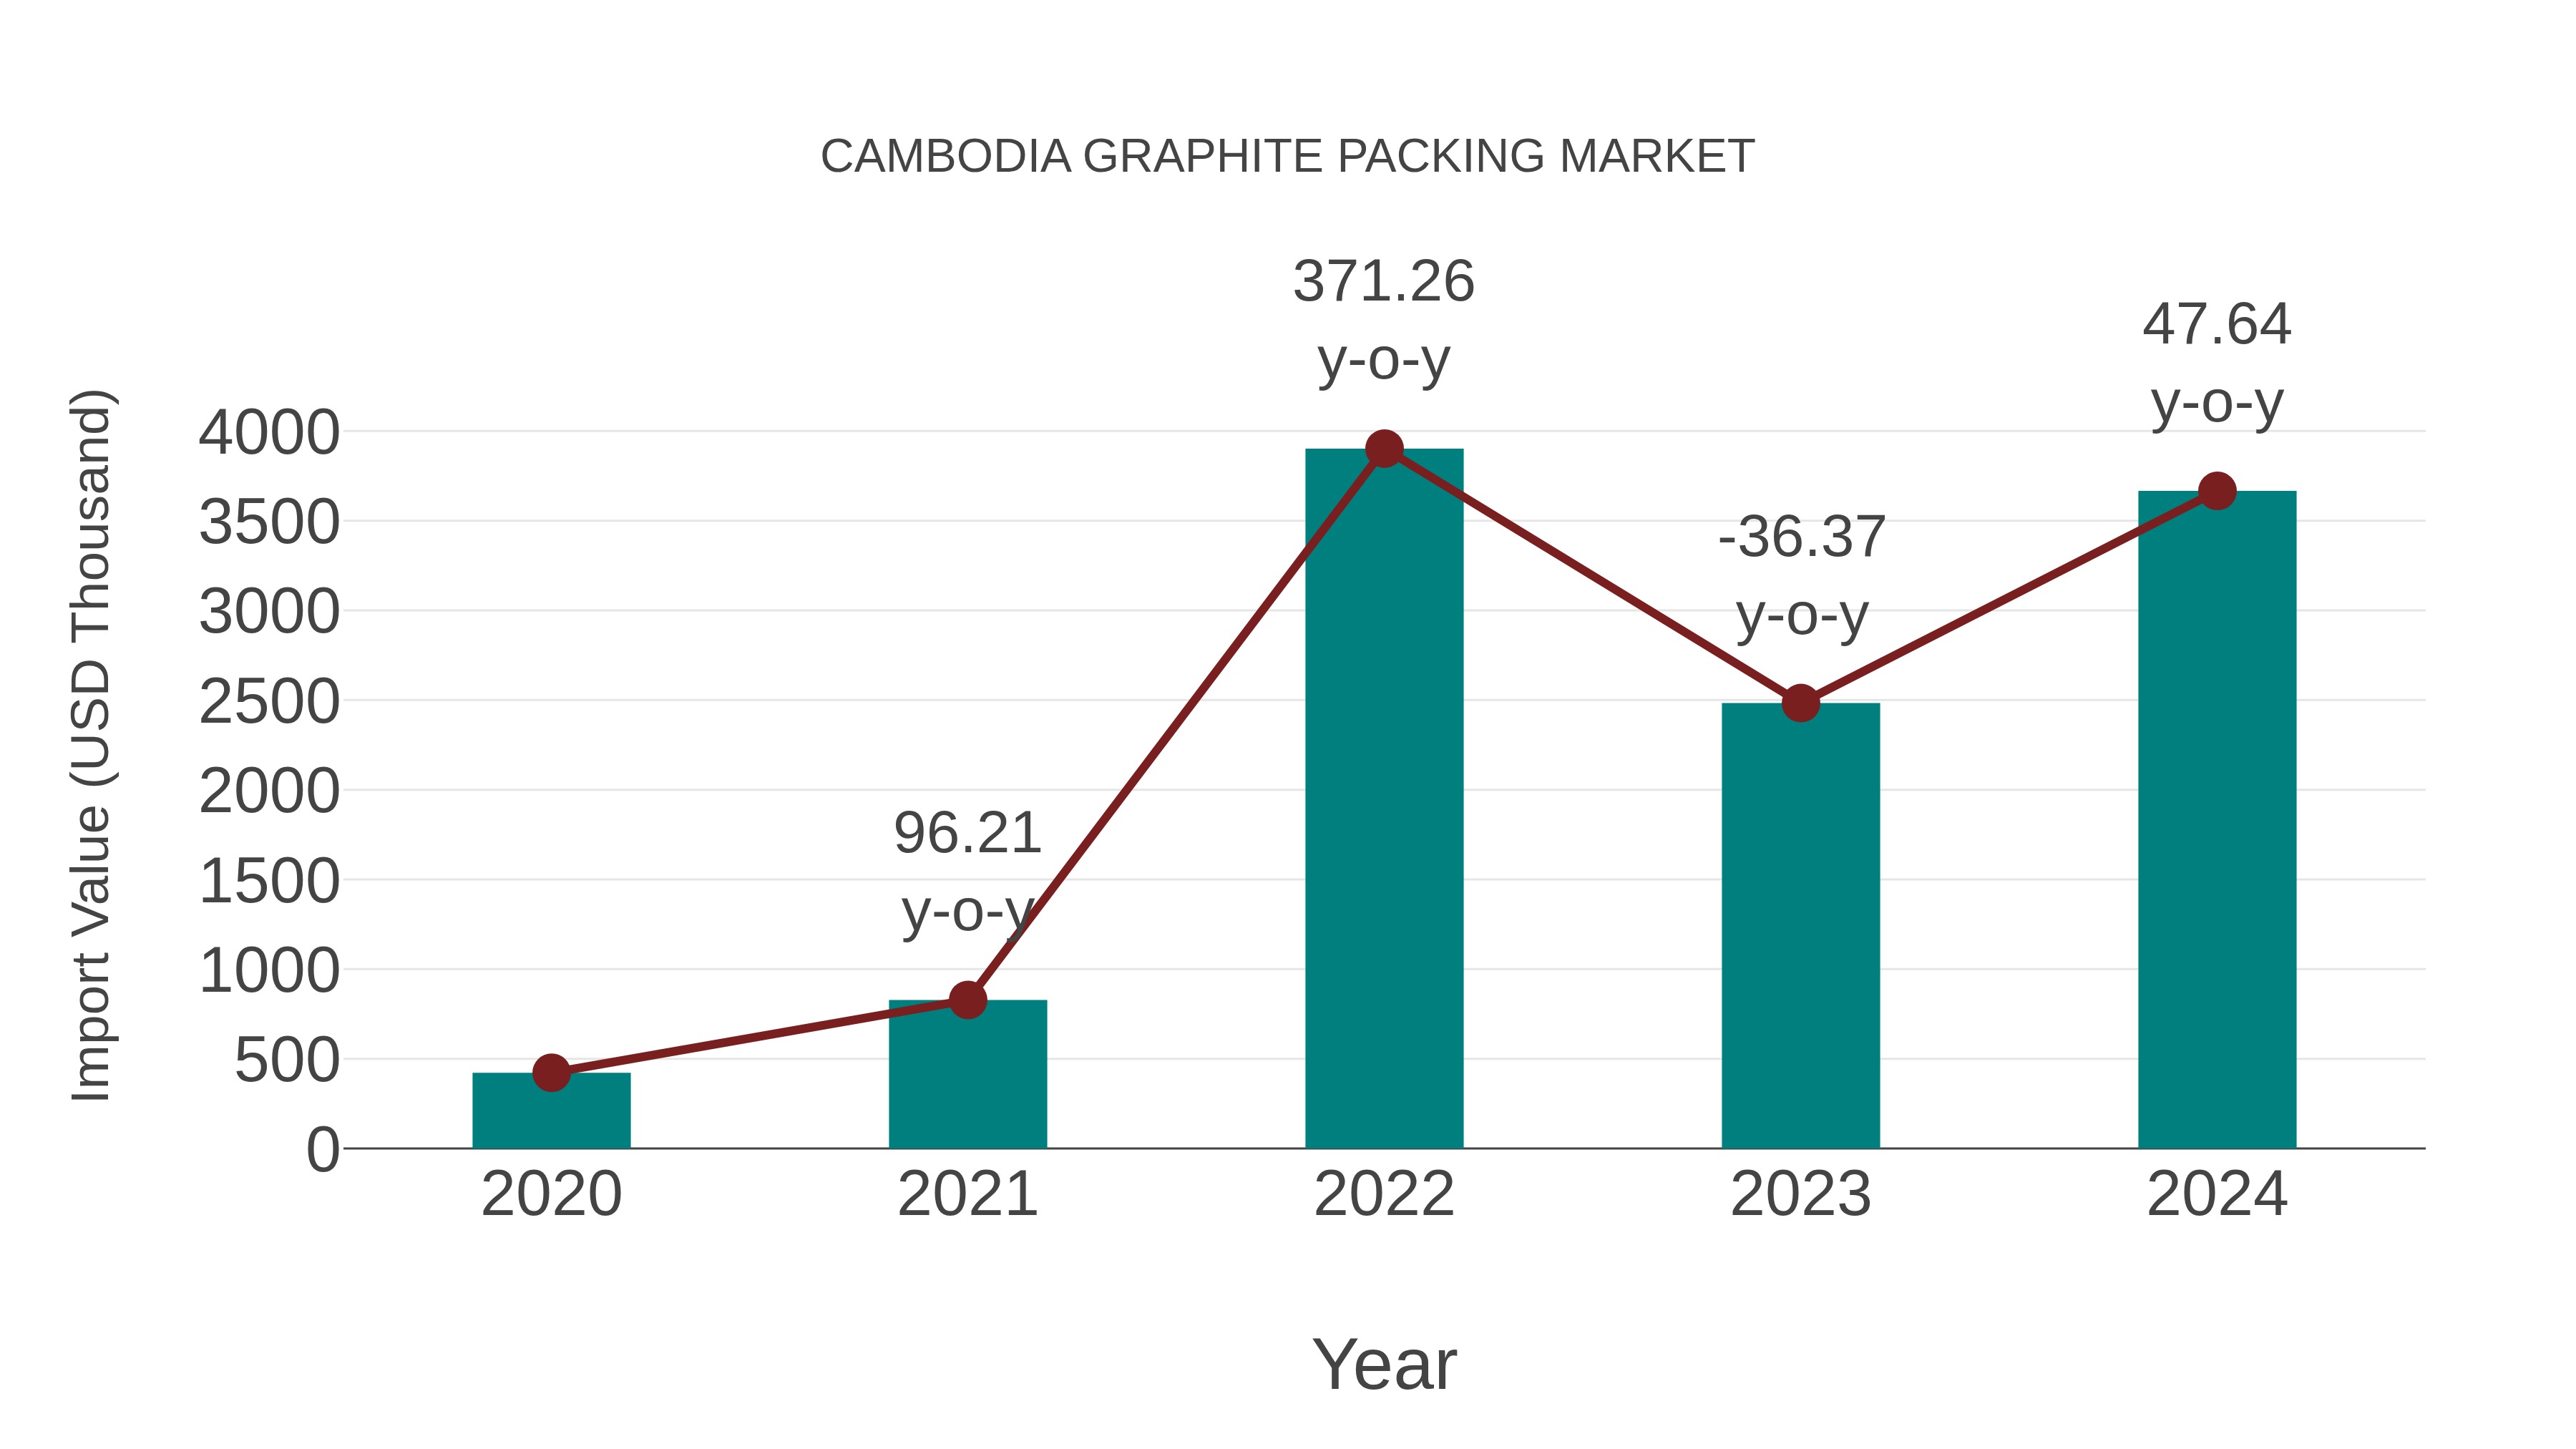
Cambodia Graphite Packing Market: Import Trend Analysis
Cambodia import trend for graphite packing in 2024 exhibited significant growth, with a growth rate of 47.64% compared to the previous year. The compound annual growth rate (CAGR) from 2020 to 2024 stood at 71.68%. This surge in imports can be attributed to a notable demand shift towards high-quality graphite packing materials, indicating a potential market stability and growing preference for such products in the region.
Key Highlights of the Report:
- Cambodia Graphite Packing Market Outlook
- Market Size of Cambodia Graphite Packing Market, 2025
- Forecast of Cambodia Graphite Packing Market, 2032
- Historical Data and Forecast of Cambodia Graphite Packing Revenues & Volume for the Period 2022-2032F
- Cambodia Graphite Packing Market Trend Evolution
- Cambodia Graphite Packing Market Drivers and Challenges
- Cambodia Graphite Packing Price Trends
- Cambodia Graphite Packing Porter's Five Forces
- Cambodia Graphite Packing Industry Life Cycle
- Historical Data and Forecast of Cambodia Graphite Packing Market Revenues & Volume By Packing Type for the Period 2022-2032F
- Historical Data and Forecast of Cambodia Graphite Packing Market Revenues & Volume By Braided Packing for the Period 2022-2032F
- Historical Data and Forecast of Cambodia Graphite Packing Market Revenues & Volume By Molded Packing for the Period 2022-2032F
- Historical Data and Forecast of Cambodia Graphite Packing Market Revenues & Volume By Ribbon Packing for the Period 2022-2032F
- Historical Data and Forecast of Cambodia Graphite Packing Market Revenues & Volume By Material for the Period 2022-2032F
- Historical Data and Forecast of Cambodia Graphite Packing Market Revenues & Volume By Pure Graphite for the Period 2022-2032F
- Historical Data and Forecast of Cambodia Graphite Packing Market Revenues & Volume By Graphite with PTFE for the Period 2022-2032F
- Historical Data and Forecast of Cambodia Graphite Packing Market Revenues & Volume By Flexible Graphite for the Period 2022-2032F
- Historical Data and Forecast of Cambodia Graphite Packing Market Revenues & Volume By Application for the Period 2022-2032F
- Historical Data and Forecast of Cambodia Graphite Packing Market Revenues & Volume By Valves for the Period 2022-2032F
- Historical Data and Forecast of Cambodia Graphite Packing Market Revenues & Volume By Pumps for the Period 2022-2032F
- Historical Data and Forecast of Cambodia Graphite Packing Market Revenues & Volume By Sealing for the Period 2022-2032F
- Historical Data and Forecast of Cambodia Graphite Packing Market Revenues & Volume By End User for the Period 2022-2032F
- Historical Data and Forecast of Cambodia Graphite Packing Market Revenues & Volume By Oil & Gas Industry for the Period 2022-2032F
- Historical Data and Forecast of Cambodia Graphite Packing Market Revenues & Volume By Chemical Industry for the Period 2022-2032F
- Historical Data and Forecast of Cambodia Graphite Packing Market Revenues & Volume By Power Plants for the Period 2022-2032F
- Historical Data and Forecast of Cambodia Graphite Packing Market Revenues & Volume By Distribution Channel for the Period 2022-2032F
- Historical Data and Forecast of Cambodia Graphite Packing Market Revenues & Volume By Direct Sales for the Period 2022-2032F
- Historical Data and Forecast of Cambodia Graphite Packing Market Revenues & Volume By Distributors for the Period 2022-2032F
- Historical Data and Forecast of Cambodia Graphite Packing Market Revenues & Volume By Online Stores for the Period 2022-2032F
- Cambodia Graphite Packing Import Export Trade Statistics
- Market Opportunity Assessment By Packing Type
- Market Opportunity Assessment By Material
- Market Opportunity Assessment By Application
- Market Opportunity Assessment By End User
- Market Opportunity Assessment By Distribution Channel
- Cambodia Graphite Packing Top Companies Market Share
- Cambodia Graphite Packing Competitive Benchmarking By Technical and Operational Parameters
- Cambodia Graphite Packing Company Profiles
- Cambodia Graphite Packing Key Strategic Recommendations
Frequently Asked Questions About the Market Study (FAQs):
6Wresearch actively monitors the Cambodia Graphite Packing Market and publishes its comprehensive annual report, highlighting emerging trends, growth drivers, revenue analysis, and forecast outlook. Our insights help businesses to make data-backed strategic decisions with ongoing market dynamics. Our analysts track relevent industries related to the Cambodia Graphite Packing Market, allowing our clients with actionable intelligence and reliable forecasts tailored to emerging regional needs.
Yes, we provide customisation as per your requirements. To learn more, feel free to contact us on sales@6wresearch.com
1 Executive Summary |
2 Introduction |
2.1 Key Highlights of the Report |
2.2 Report Description |
2.3 Market Scope & Segmentation |
2.4 Research Methodology |
2.5 Assumptions |
3 Cambodia Graphite Packing Market Overview |
3.1 Cambodia Country Macro Economic Indicators |
3.2 Cambodia Graphite Packing Market Revenues & Volume, 2022 & 2032F |
3.3 Cambodia Graphite Packing Market - Industry Life Cycle |
3.4 Cambodia Graphite Packing Market - Porter's Five Forces |
3.5 Cambodia Graphite Packing Market Revenues & Volume Share, By Packing Type, 2022 & 2032F |
3.6 Cambodia Graphite Packing Market Revenues & Volume Share, By Material, 2022 & 2032F |
3.7 Cambodia Graphite Packing Market Revenues & Volume Share, By Application, 2022 & 2032F |
3.8 Cambodia Graphite Packing Market Revenues & Volume Share, By End User, 2022 & 2032F |
3.9 Cambodia Graphite Packing Market Revenues & Volume Share, By Distribution Channel, 2022 & 2032F |
4 Cambodia Graphite Packing Market Dynamics |
4.1 Impact Analysis |
4.2 Market Drivers |
4.2.1 Growing industrialization and infrastructure development in Cambodia leading to increased demand for graphite packing for machinery and equipment. |
4.2.2 Rising awareness about the benefits of graphite packing such as high temperature resistance and chemical inertness, driving its adoption in various industries. |
4.2.3 Increasing focus on improving energy efficiency and reducing emissions, creating a demand for graphite packing in energy and environmental sectors. |
4.3 Market Restraints |
4.3.1 Limited availability of high-quality graphite material in Cambodia, leading to dependency on imports and potential supply chain disruptions. |
4.3.2 Price volatility of graphite raw materials impacting the overall cost of production for graphite packing manufacturers. |
4.3.3 Competition from alternative packing materials such as PTFE and ceramic, posing a challenge to the market growth of graphite packing. |
5 Cambodia Graphite Packing Market Trends |
6 Cambodia Graphite Packing Market, By Types |
6.1 Cambodia Graphite Packing Market, By Packing Type |
6.1.1 Overview and Analysis |
6.1.2 Cambodia Graphite Packing Market Revenues & Volume, By Packing Type, 2022 - 2032F |
6.1.3 Cambodia Graphite Packing Market Revenues & Volume, By Braided Packing, 2022 - 2032F |
6.1.4 Cambodia Graphite Packing Market Revenues & Volume, By Molded Packing, 2022 - 2032F |
6.1.5 Cambodia Graphite Packing Market Revenues & Volume, By Ribbon Packing, 2022 - 2032F |
6.2 Cambodia Graphite Packing Market, By Material |
6.2.1 Overview and Analysis |
6.2.2 Cambodia Graphite Packing Market Revenues & Volume, By Pure Graphite, 2022 - 2032F |
6.2.3 Cambodia Graphite Packing Market Revenues & Volume, By Graphite with PTFE, 2022 - 2032F |
6.2.4 Cambodia Graphite Packing Market Revenues & Volume, By Flexible Graphite, 2022 - 2032F |
6.3 Cambodia Graphite Packing Market, By Application |
6.3.1 Overview and Analysis |
6.3.2 Cambodia Graphite Packing Market Revenues & Volume, By Valves, 2022 - 2032F |
6.3.3 Cambodia Graphite Packing Market Revenues & Volume, By Pumps, 2022 - 2032F |
6.3.4 Cambodia Graphite Packing Market Revenues & Volume, By Sealing, 2022 - 2032F |
6.4 Cambodia Graphite Packing Market, By End User |
6.4.1 Overview and Analysis |
6.4.2 Cambodia Graphite Packing Market Revenues & Volume, By Oil & Gas Industry, 2022 - 2032F |
6.4.3 Cambodia Graphite Packing Market Revenues & Volume, By Chemical Industry, 2022 - 2032F |
6.4.4 Cambodia Graphite Packing Market Revenues & Volume, By Power Plants, 2022 - 2032F |
6.5 Cambodia Graphite Packing Market, By Distribution Channel |
6.5.1 Overview and Analysis |
6.5.2 Cambodia Graphite Packing Market Revenues & Volume, By Direct Sales, 2022 - 2032F |
6.5.3 Cambodia Graphite Packing Market Revenues & Volume, By Distributors, 2022 - 2032F |
6.5.4 Cambodia Graphite Packing Market Revenues & Volume, By Online Stores, 2022 - 2032F |
7 Cambodia Graphite Packing Market Import-Export Trade Statistics |
7.1 Cambodia Graphite Packing Market Export to Major Countries |
7.2 Cambodia Graphite Packing Market Imports from Major Countries |
8 Cambodia Graphite Packing Market Key Performance Indicators |
8.1 Average lead time for graphite packing production and delivery to customers. |
8.2 Percentage of repeat customers indicating customer satisfaction and loyalty. |
8.3 Rate of new product development and innovation in graphite packing technology. |
8.4 Number of partnerships or collaborations with local distributors or manufacturers to expand market reach. |
8.5 Percentage of market share within specific industries or applications where graphite packing is commonly used. |
9 Cambodia Graphite Packing Market - Opportunity Assessment |
9.1 Cambodia Graphite Packing Market Opportunity Assessment, By Packing Type, 2022 & 2032F |
9.2 Cambodia Graphite Packing Market Opportunity Assessment, By Material, 2022 & 2032F |
9.3 Cambodia Graphite Packing Market Opportunity Assessment, By Application, 2022 & 2032F |
9.4 Cambodia Graphite Packing Market Opportunity Assessment, By End User, 2022 & 2032F |
9.5 Cambodia Graphite Packing Market Opportunity Assessment, By Distribution Channel, 2022 & 2032F |
10 Cambodia Graphite Packing Market - Competitive Landscape |
10.1 Cambodia Graphite Packing Market Revenue Share, By Companies, 2025 |
10.2 Cambodia Graphite Packing Market Competitive Benchmarking, By Operating and Technical Parameters |
11 Company Profiles |
12 Recommendations |
13 Disclaimer |
Global Go To Market Strategy - 2030
Export potential enables firms to identify high-growth global markets with greater confidence by combining advanced trade intelligence with a structured quantitative methodology. The framework analyzes emerging demand trends and country-level import patterns while integrating macroeconomic and trade datasets such as GDP and population forecasts, bilateral import–export flows, tariff structures, elasticity differentials between developed and developing economies, geographic distance, and import demand projections. Using weighted trade values from 2020–2024 as the base period to project country-to-country export potential for 2030, these inputs are operationalized through calculated drivers such as gravity model parameters, tariff impact factors, and projected GDP per-capita growth. Through an analysis of hidden potentials, demand hotspots, and market conditions that are most favorable to success, this method enables firms to focus on target countries, maximize returns, and global expansion with data, backed by accuracy.
By factoring in the projected importer demand gap that is currently unmet and could be potential opportunity, it identifies the potential for the Exporter (Country) among 190 countries, against the general trade analysis, which identifies the biggest importer or exporter.
To discover high-growth global markets and optimize your business strategy:
Click Here
Pricing
- Single User License$ 1,995
- Department License$ 2,400
- Site License$ 3,120
- Global License$ 3,795

Leadership Perspectives from Industry Events
Search
Thought Leadership and Analyst Meet


Our Clients
6WResearch In News
- Doha a strategic location for EV manufacturing hub: IPA Qatar
- Demand for luxury TVs surging in the GCC, says Samsung
- Empowering Growth: The Thriving Journey of Bangladesh’s Cable Industry
- Demand for luxury TVs surging in the GCC, says Samsung
- Video call with a traditional healer? Once unthinkable, it’s now common in South Africa
- Intelligent Buildings To Smooth GCC’s Path To Net Zero
Latest Reports
- Taiwan Airport Wireless Infrastructure Market (2026-2032)
- Vietnam Airport Wireless Infrastructure Market (2026-2032)
- Thailand Airport Wireless Infrastructure Market (2026-2032)
- South Korea Airport Wireless Infrastructure Market (2026-2032)
- Romania Airport Wireless Infrastructure Market (2026-2032)
- Qatar Airport Wireless Infrastructure Market (2026-2032)
- Philippines Airport Wireless Infrastructure Market (2026-2032)
- Japan Airport Wireless Infrastructure Market (2026-2032)
- Taiwan Airport Winter Services Market (2026-2032)
- Vietnam Airport Winter Services Market (2026-2032)
Industry Events and Analyst Meet

HIMTEX 2026

India Refining Summit 2026

India EV Show 2026

EV tech India Expo 2026

Auto Tech Asia 2026
Whitepaper
- Middle East & Africa Commercial Security Market Click here to view more.
- Middle East & Africa Fire Safety Systems & Equipment Market Click here to view more.
- GCC Drone Market Click here to view more.
- Middle East Lighting Fixture Market Click here to view more.
- GCC Physical & Perimeter Security Market Click here to view more.