Cambodia Interactive Tables Market (2026-2032) Outlook | Analysis, Trends, Growth, Revenue, Value, Forecast, Size, Share, Industry, Companies
Market Forecast By Technology (LCD, LED, Capacitive, Others), By Screen Size (32-65 Inch, 65 Inch & Above), By Application (Exhibition & Trade Shows, Education, Retail, Control Room, Hospitality, Transportation, Others) And Competitive Landscape
| Product Code: ETC275073 | Publication Date: Aug 2022 | Updated Date: Mar 2026 | Product Type: Market Research Report | |
| Publisher: 6Wresearch | Author: Ravi Bhandari | No. of Pages: 75 | No. of Figures: 35 | No. of Tables: 20 |
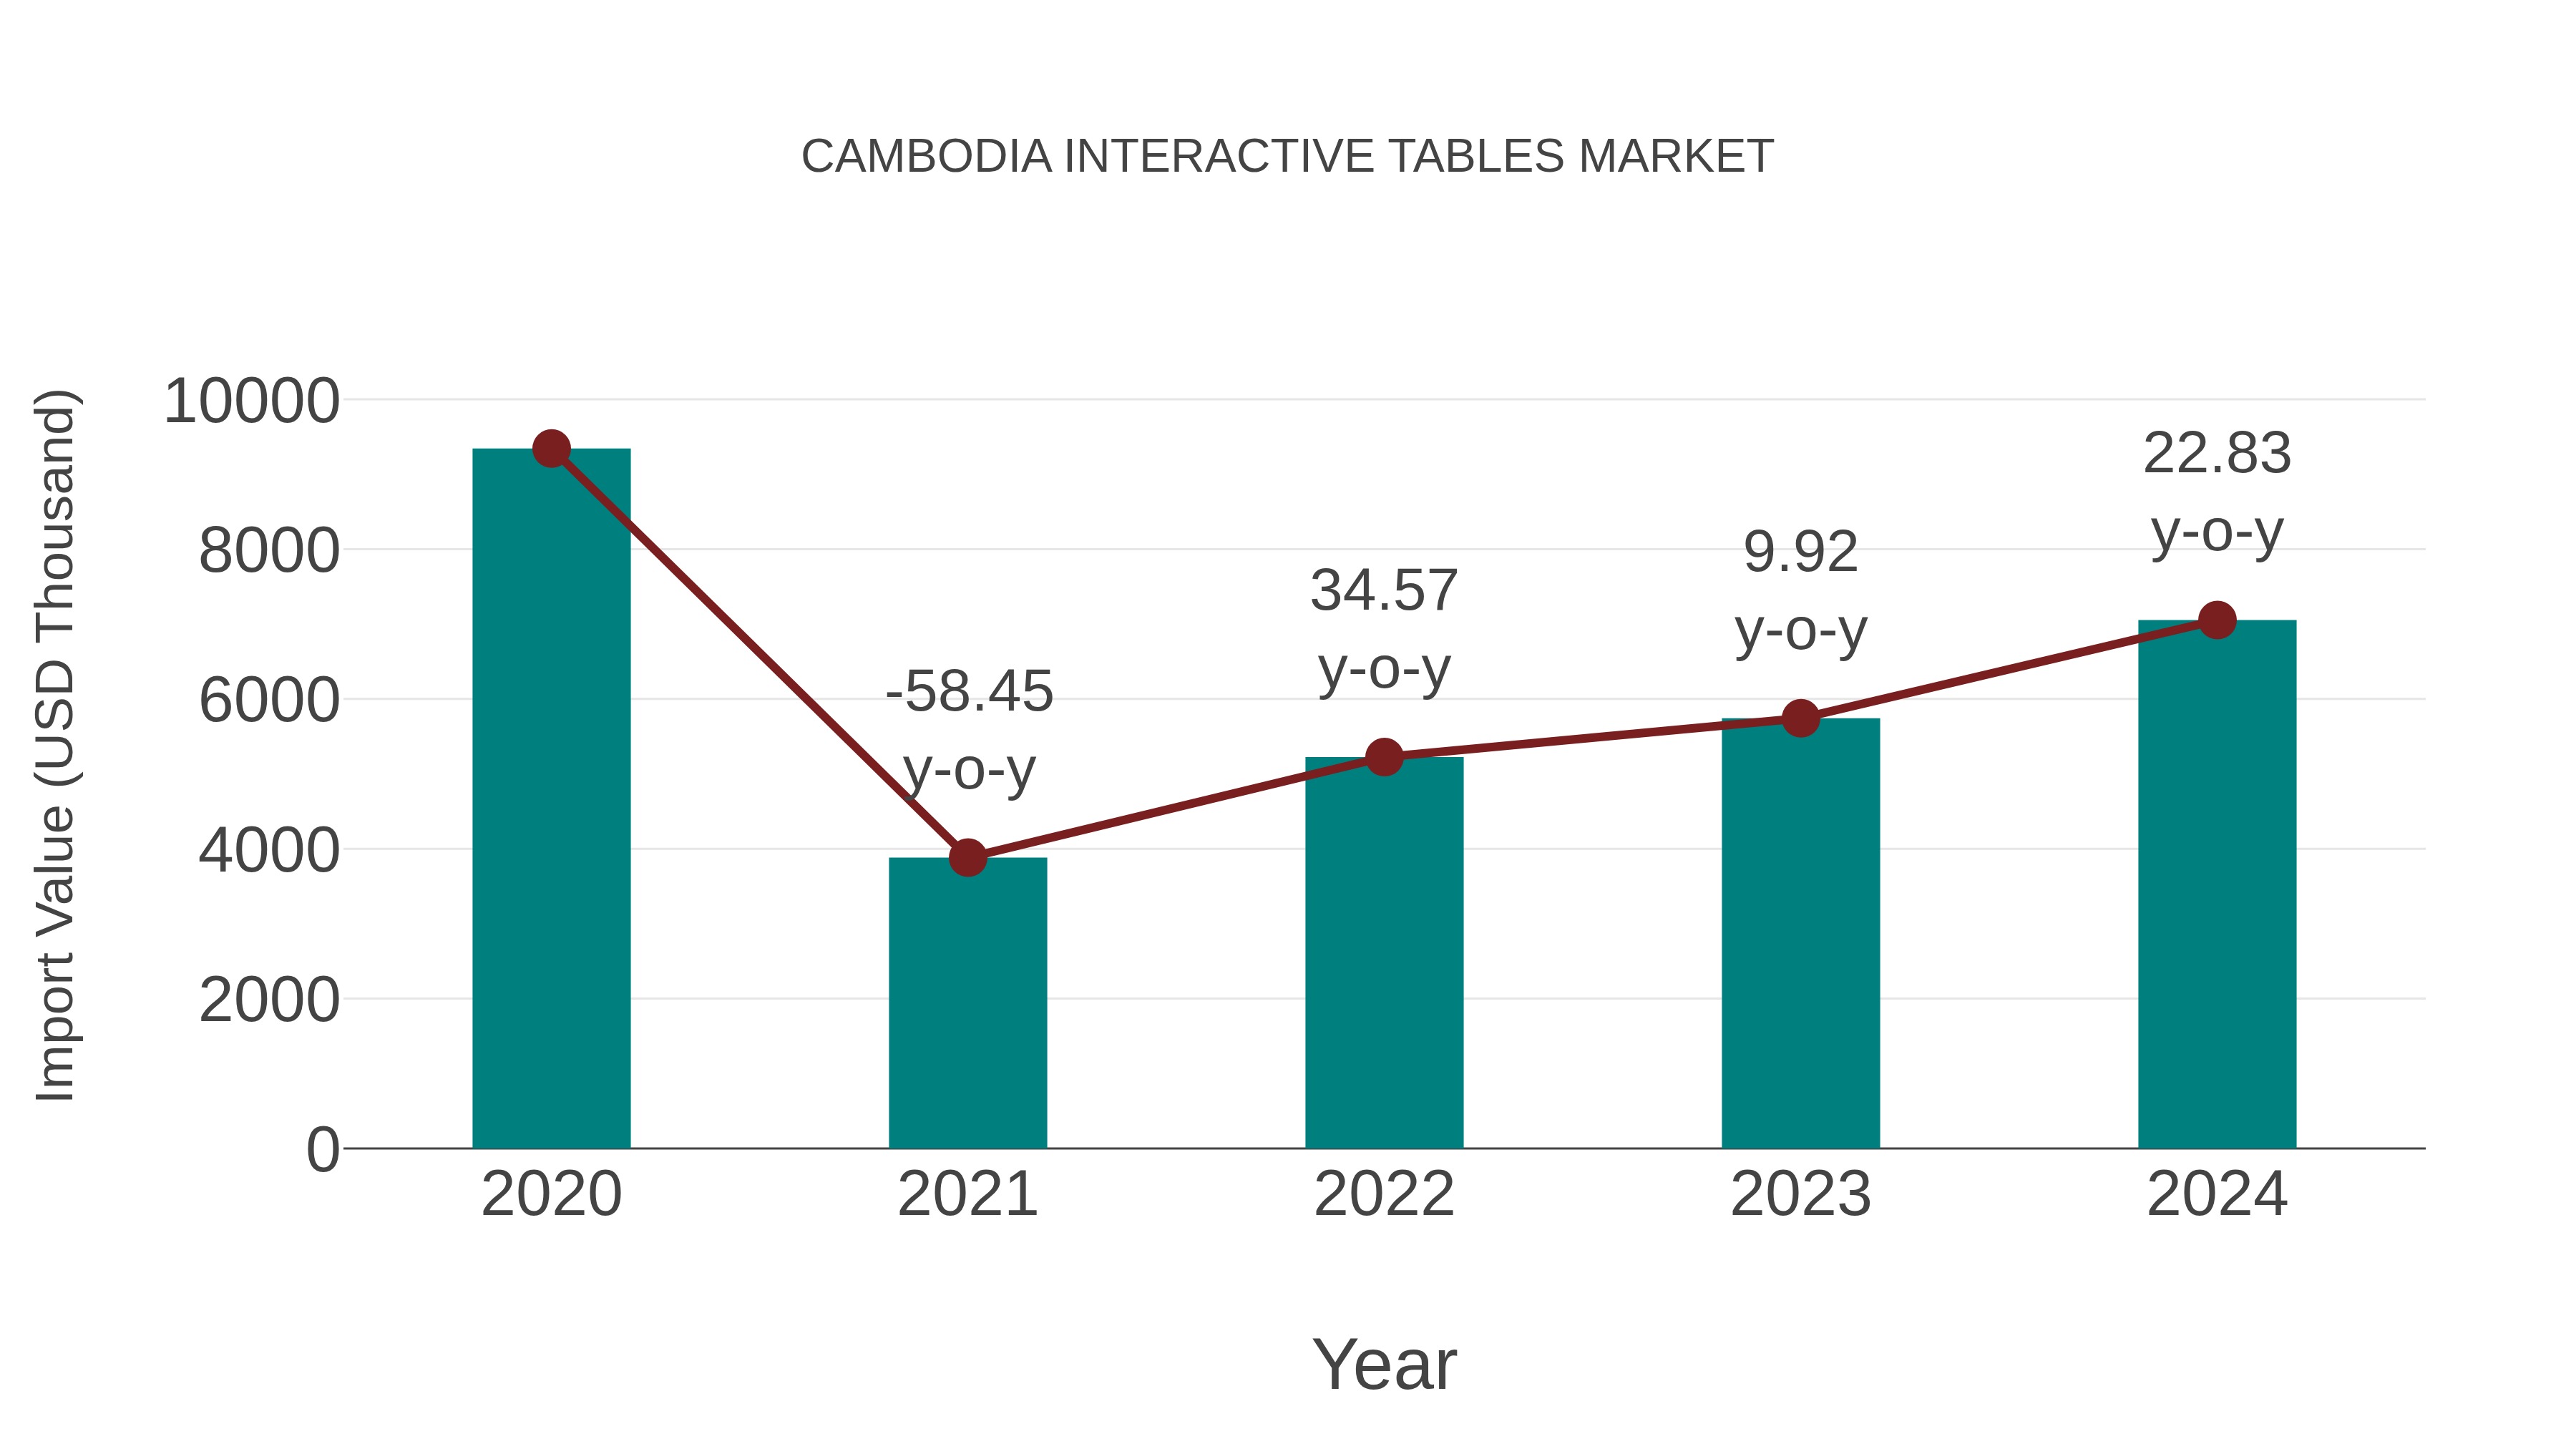
Cambodia Interactive Tables Market: Import Trend Analysis
During 2020-2024, the Cambodia interactive tables market experienced a negative Compound Annual Growth Rate (CAGR) of -6.79%. However, in 2023-2024, there was a notable year-on-year growth rate of 22.83%. This increase in imports during this period can be attributed to the positive growth observed in 2023-2024, offsetting the overall negative trend from 2020-2024.
Cambodia Interactive Tables Market Overview
Interactive tables, equipped with touchscreen technology and interactive software, offer engaging and collaborative experiences for users in retail, hospitality, education, and entertainment settings. In Cambodia, the market for interactive tables is driven by the demand for interactive retail displays, digital classrooms, and interactive exhibits in museums and exhibitions.
Drivers of the market
The interactive tables market in Cambodia is driven by factors such as hospitality experiences, retail engagement, and interactive entertainment venues. Interactive tables feature touch-sensitive surfaces, multimedia content, and interactive applications for customer interaction, product showcasing, and entertainment purposes. Factors such as customer engagement, brand differentiation, and experiential marketing drive demand for interactive table solutions, stimulating market growth.
Challenges of the market
Challenges in the interactive tables market include addressing concerns related to table durability and user experience. Ensuring table reliability and addressing compatibility with interactive software pose hurdles for manufacturers. Moreover, promoting collaborative features and addressing market demand for interactive learning solutions could impact market growth.
Government Policy of the market
In the interactive tables market, the Cambodian government emphasizes creativity, collaboration, and interactive learning experiences. Policies may include regulations governing interactive table design, accessibility standards, and educational content requirements to ensure compliance with pedagogical principles and user needs. Moreover, measures to support research and development in interactive table technology, promote industry standards and best practices, and provide incentives for deploying interactive table solutions in educational institutions, libraries, museums, and collaborative workspaces may be implemented to enhance learning outcomes, foster creativity, and promote digital literacy among students and learners of all ages.
Key Highlights of the Report:
- Cambodia Interactive Tables Market Outlook
- Market Size of Cambodia Interactive Tables Market, 2025
- Forecast of Cambodia Interactive Tables Market, 2032
- Historical Data and Forecast of Cambodia Interactive Tables Revenues & Volume for the Period 2022-2032F
- Cambodia Interactive Tables Market Trend Evolution
- Cambodia Interactive Tables Market Drivers and Challenges
- Cambodia Interactive Tables Price Trends
- Cambodia Interactive Tables Porter's Five Forces
- Cambodia Interactive Tables Industry Life Cycle
- Historical Data and Forecast of Cambodia Interactive Tables Market Revenues & Volume By Technology for the Period 2022-2032F
- Historical Data and Forecast of Cambodia Interactive Tables Market Revenues & Volume By LCD for the Period 2022-2032F
- Historical Data and Forecast of Cambodia Interactive Tables Market Revenues & Volume By LED for the Period 2022-2032F
- Historical Data and Forecast of Cambodia Interactive Tables Market Revenues & Volume By Capacitive for the Period 2022-2032F
- Historical Data and Forecast of Cambodia Interactive Tables Market Revenues & Volume By Others for the Period 2022-2032F
- Historical Data and Forecast of Cambodia Interactive Tables Market Revenues & Volume By Screen Size for the Period 2022-2032F
- Historical Data and Forecast of Cambodia Interactive Tables Market Revenues & Volume By 32-65 Inch for the Period 2022-2032F
- Historical Data and Forecast of Cambodia Interactive Tables Market Revenues & Volume By 65 Inch & Above for the Period 2022-2032F
- Historical Data and Forecast of Cambodia Interactive Tables Market Revenues & Volume By Application for the Period 2022-2032F
- Historical Data and Forecast of Cambodia Interactive Tables Market Revenues & Volume By Exhibition & Trade Shows for the Period 2022-2032F
- Historical Data and Forecast of Cambodia Interactive Tables Market Revenues & Volume By Education for the Period 2022-2032F
- Historical Data and Forecast of Cambodia Interactive Tables Market Revenues & Volume By Retail for the Period 2022-2032F
- Historical Data and Forecast of Cambodia Interactive Tables Market Revenues & Volume By Control Room for the Period 2022-2032F
- Historical Data and Forecast of Cambodia Interactive Tables Market Revenues & Volume By Hospitality for the Period 2022-2032F
- Historical Data and Forecast of Cambodia Interactive Tables Market Revenues & Volume By Transportation for the Period 2022-2032F
- Historical Data and Forecast of Cambodia Interactive Tables Market Revenues & Volume By Others for the Period 2022-2032F
- Cambodia Interactive Tables Import Export Trade Statistics
- Market Opportunity Assessment By Technology
- Market Opportunity Assessment By Screen Size
- Market Opportunity Assessment By Application
- Cambodia Interactive Tables Top Companies Market Share
- Cambodia Interactive Tables Competitive Benchmarking By Technical and Operational Parameters
- Cambodia Interactive Tables Company Profiles
- Cambodia Interactive Tables Key Strategic Recommendations
Cambodia Interactive Tables Market (2026-2032): FAQs
6Wresearch actively monitors the Cambodia Interactive Tables Market and publishes its comprehensive annual report, highlighting emerging trends, growth drivers, revenue analysis, and forecast outlook. Our insights help businesses to make data-backed strategic decisions with ongoing market dynamics. Our analysts track relevent industries related to the Cambodia Interactive Tables Market, allowing our clients with actionable intelligence and reliable forecasts tailored to emerging regional needs.
Yes, we provide customisation as per your requirements. To learn more, feel free to contact us on sales@6wresearch.com
1 Executive Summary |
2 Introduction |
2.1 Key Highlights of the Report |
2.2 Report Description |
2.3 Market Scope & Segmentation |
2.4 Research Methodology |
2.5 Assumptions |
3 Cambodia Interactive Tables Market Overview |
3.1 Cambodia Country Macro Economic Indicators |
3.2 Cambodia Interactive Tables Market Revenues & Volume, 2022 & 2032F |
3.3 Cambodia Interactive Tables Market - Industry Life Cycle |
3.4 Cambodia Interactive Tables Market - Porter's Five Forces |
3.5 Cambodia Interactive Tables Market Revenues & Volume Share, By Technology, 2022 & 2032F |
3.6 Cambodia Interactive Tables Market Revenues & Volume Share, By Screen Size, 2022 & 2032F |
3.7 Cambodia Interactive Tables Market Revenues & Volume Share, By Application, 2022 & 2032F |
4 Cambodia Interactive Tables Market Dynamics |
4.1 Impact Analysis |
4.2 Market Drivers |
4.2.1 Increasing demand for interactive and engaging customer experiences in restaurants, hotels, and retail spaces |
4.2.2 Growing adoption of digital technology and smart devices in Cambodia |
4.2.3 Rise in disposable income and changing consumer preferences towards interactive solutions |
4.3 Market Restraints |
4.3.1 High initial investment cost for implementing interactive table solutions |
4.3.2 Limited awareness and understanding of the benefits of interactive tables among businesses in Cambodia |
4.3.3 Lack of skilled professionals to develop and maintain interactive table systems |
5 Cambodia Interactive Tables Market Trends |
6 Cambodia Interactive Tables Market, By Types |
6.1 Cambodia Interactive Tables Market, By Technology |
6.1.1 Overview and Analysis |
6.1.2 Cambodia Interactive Tables Market Revenues & Volume, By Technology, 2022-2032F |
6.1.3 Cambodia Interactive Tables Market Revenues & Volume, By LCD, 2022-2032F |
6.1.4 Cambodia Interactive Tables Market Revenues & Volume, By LED, 2022-2032F |
6.1.5 Cambodia Interactive Tables Market Revenues & Volume, By Capacitive, 2022-2032F |
6.1.6 Cambodia Interactive Tables Market Revenues & Volume, By Others, 2022-2032F |
6.2 Cambodia Interactive Tables Market, By Screen Size |
6.2.1 Overview and Analysis |
6.2.2 Cambodia Interactive Tables Market Revenues & Volume, By 32-65 Inch, 2022-2032F |
6.2.3 Cambodia Interactive Tables Market Revenues & Volume, By 65 Inch & Above, 2022-2032F |
6.3 Cambodia Interactive Tables Market, By Application |
6.3.1 Overview and Analysis |
6.3.2 Cambodia Interactive Tables Market Revenues & Volume, By Exhibition & Trade Shows, 2022-2032F |
6.3.3 Cambodia Interactive Tables Market Revenues & Volume, By Education, 2022-2032F |
6.3.4 Cambodia Interactive Tables Market Revenues & Volume, By Retail, 2022-2032F |
6.3.5 Cambodia Interactive Tables Market Revenues & Volume, By Control Room, 2022-2032F |
6.3.6 Cambodia Interactive Tables Market Revenues & Volume, By Hospitality, 2022-2032F |
6.3.7 Cambodia Interactive Tables Market Revenues & Volume, By Transportation, 2022-2032F |
7 Cambodia Interactive Tables Market Import-Export Trade Statistics |
7.1 Cambodia Interactive Tables Market Export to Major Countries |
7.2 Cambodia Interactive Tables Market Imports from Major Countries |
8 Cambodia Interactive Tables Market Key Performance Indicators |
8.1 Average time spent per customer using interactive tables |
8.2 Number of businesses adopting interactive tables in Cambodia |
8.3 Percentage increase in customer satisfaction scores after implementing interactive tables |
9 Cambodia Interactive Tables Market - Opportunity Assessment |
9.1 Cambodia Interactive Tables Market Opportunity Assessment, By Technology, 2022 & 2032F |
9.2 Cambodia Interactive Tables Market Opportunity Assessment, By Screen Size, 2022 & 2032F |
9.3 Cambodia Interactive Tables Market Opportunity Assessment, By Application, 2022 & 2032F |
10 Cambodia Interactive Tables Market - Competitive Landscape |
10.1 Cambodia Interactive Tables Market Revenue Share, By Companies, 2025 |
10.2 Cambodia Interactive Tables Market Competitive Benchmarking, By Operating and Technical Parameters |
11 Company Profiles |
12 Recommendations |
13 Disclaimer |
Export potential assessment - trade Analytics for 2030
Export potential enables firms to identify high-growth global markets with greater confidence by combining advanced trade intelligence with a structured quantitative methodology. The framework analyzes emerging demand trends and country-level import patterns while integrating macroeconomic and trade datasets such as GDP and population forecasts, bilateral import–export flows, tariff structures, elasticity differentials between developed and developing economies, geographic distance, and import demand projections. Using weighted trade values from 2020–2024 as the base period to project country-to-country export potential for 2030, these inputs are operationalized through calculated drivers such as gravity model parameters, tariff impact factors, and projected GDP per-capita growth. Through an analysis of hidden potentials, demand hotspots, and market conditions that are most favorable to success, this method enables firms to focus on target countries, maximize returns, and global expansion with data, backed by accuracy.
By factoring in the projected importer demand gap that is currently unmet and could be potential opportunity, it identifies the potential for the Exporter (Country) among 190 countries, against the general trade analysis, which identifies the biggest importer or exporter.
To discover high-growth global markets and optimize your business strategy:
Click Here
Pricing
- Single User License$ 1,995
- Department License$ 2,400
- Site License$ 3,120
- Global License$ 3,795

Search
Thought Leadership and Analyst Meet


Our Clients
Latest Reports
- Philippines Polyhydroxybutyrate-co-Hydroxyvalerate Market (2026-2032) | Trends, Insights, Challenges, Restraints, Competition, Size, Value, Forecast, Pricing, Share, Outlook, Revenue, Investment Opportunities, Strategy, Drivers, Demand, Growth, segmentation, Analysis, Companies
- Peru Polyhydroxybutyrate-co-Hydroxyvalerate Market (2026-2032) | Growth, Demand, Challenges, Share, Trends, Analysis, Pricing, Investment Opportunities, Drivers, Value, Forecast, Competition, Size, Companies, Insights, Outlook, Restraints, segmentation, Revenue, Strategy
- Pakistan Polyhydroxybutyrate-co-Hydroxyvalerate Market (2026-2032) | Restraints, segmentation, Pricing, Forecast, Share, Strategy, Competition, Trends, Insights, Drivers, Challenges, Growth, Revenue, Outlook, Value, Investment Opportunities, Companies, Size, Analysis, Demand
- Oman Polyhydroxybutyrate-co-Hydroxyvalerate Market (2026-2032) | Drivers, segmentation, Insights, Competition, Pricing, Outlook, Size, Revenue, Challenges, Forecast, Analysis, Growth, Value, Share, Trends, Investment Opportunities, Strategy, Restraints, Companies, Demand
- Nigeria Polyhydroxybutyrate-co-Hydroxyvalerate Market (2026-2032) | Value, Investment Opportunities, Analysis, Revenue, Restraints, Pricing, Outlook, Competition, Demand, Growth, Forecast, Companies, Trends, Challenges, segmentation, Drivers, Insights, Share, Size, Strategy
- Nepal Polyhydroxybutyrate-co-Hydroxyvalerate Market (2026-2032) | Insights, Analysis, Drivers, Share, Revenue, Demand, segmentation, Investment Opportunities, Competition, Forecast, Growth, Pricing, Companies, Strategy, Trends, Restraints, Challenges, Outlook, Size, Value
- Myanmar Polyhydroxybutyrate-co-Hydroxyvalerate Market (2026-2032) | Outlook, Revenue, Strategy, Restraints, Drivers, segmentation, Share, Forecast, Competition, Insights, Growth, Pricing, Size, Demand, Value, Companies, Trends, Challenges, Investment Opportunities, Analysis
- Morocco Polyhydroxybutyrate-co-Hydroxyvalerate Market (2026-2032) | Outlook, Investment Opportunities, Restraints, Strategy, Forecast, Challenges, Drivers, Growth, Companies, segmentation, Trends, Size, Competition, Revenue, Demand, Insights, Share, Analysis, Value, Pricing
- Mexico Polyhydroxybutyrate-co-Hydroxyvalerate Market (2026-2032) | Size, Drivers, Outlook, Share, Strategy, Growth, Pricing, Challenges, Companies, Demand, Value, Investment Opportunities, Restraints, Trends, Forecast, segmentation, Analysis, Insights, Competition, Revenue
- Malaysia Polyhydroxybutyrate-co-Hydroxyvalerate Market (2026-2032) | Share, segmentation, Size, Companies, Analysis, Insights, Forecast, Value, Revenue, Drivers, Restraints, Challenges, Investment Opportunities, Trends, Competition, Strategy, Demand, Growth, Outlook, Pricing
Industry Events and Analyst Meet

HIMTEX 2026

India Refining Summit 2026

India EV Show 2026

EV tech India Expo 2026

Auto Tech Asia 2026
Whitepaper
- Middle East & Africa Commercial Security Market Click here to view more.
- Middle East & Africa Fire Safety Systems & Equipment Market Click here to view more.
- GCC Drone Market Click here to view more.
- Middle East Lighting Fixture Market Click here to view more.
- GCC Physical & Perimeter Security Market Click here to view more.
6WResearch In News
- Doha a strategic location for EV manufacturing hub: IPA Qatar
- Demand for luxury TVs surging in the GCC, says Samsung
- Empowering Growth: The Thriving Journey of Bangladesh’s Cable Industry
- Demand for luxury TVs surging in the GCC, says Samsung
- Video call with a traditional healer? Once unthinkable, it’s now common in South Africa
- Intelligent Buildings To Smooth GCC’s Path To Net Zero