Cambodia Polyurethane (PU) Microspheres Market (2026-2032) Outlook | Trends, Forecast, Growth, Share, Value, Revenue, Analysis, Companies, Industry & Size
Market Forecast By Applications (Encapsulation, Paints & coatings, Adhesives films, Cosmetics, Other applications) And Competitive Landscape
| Product Code: ETC4512214 | Publication Date: Jul 2023 | Updated Date: Mar 2026 | Product Type: Report | |
| Publisher: 6Wresearch | Author: Dhaval Chaurasia | No. of Pages: 85 | No. of Figures: 45 | No. of Tables: 25 |
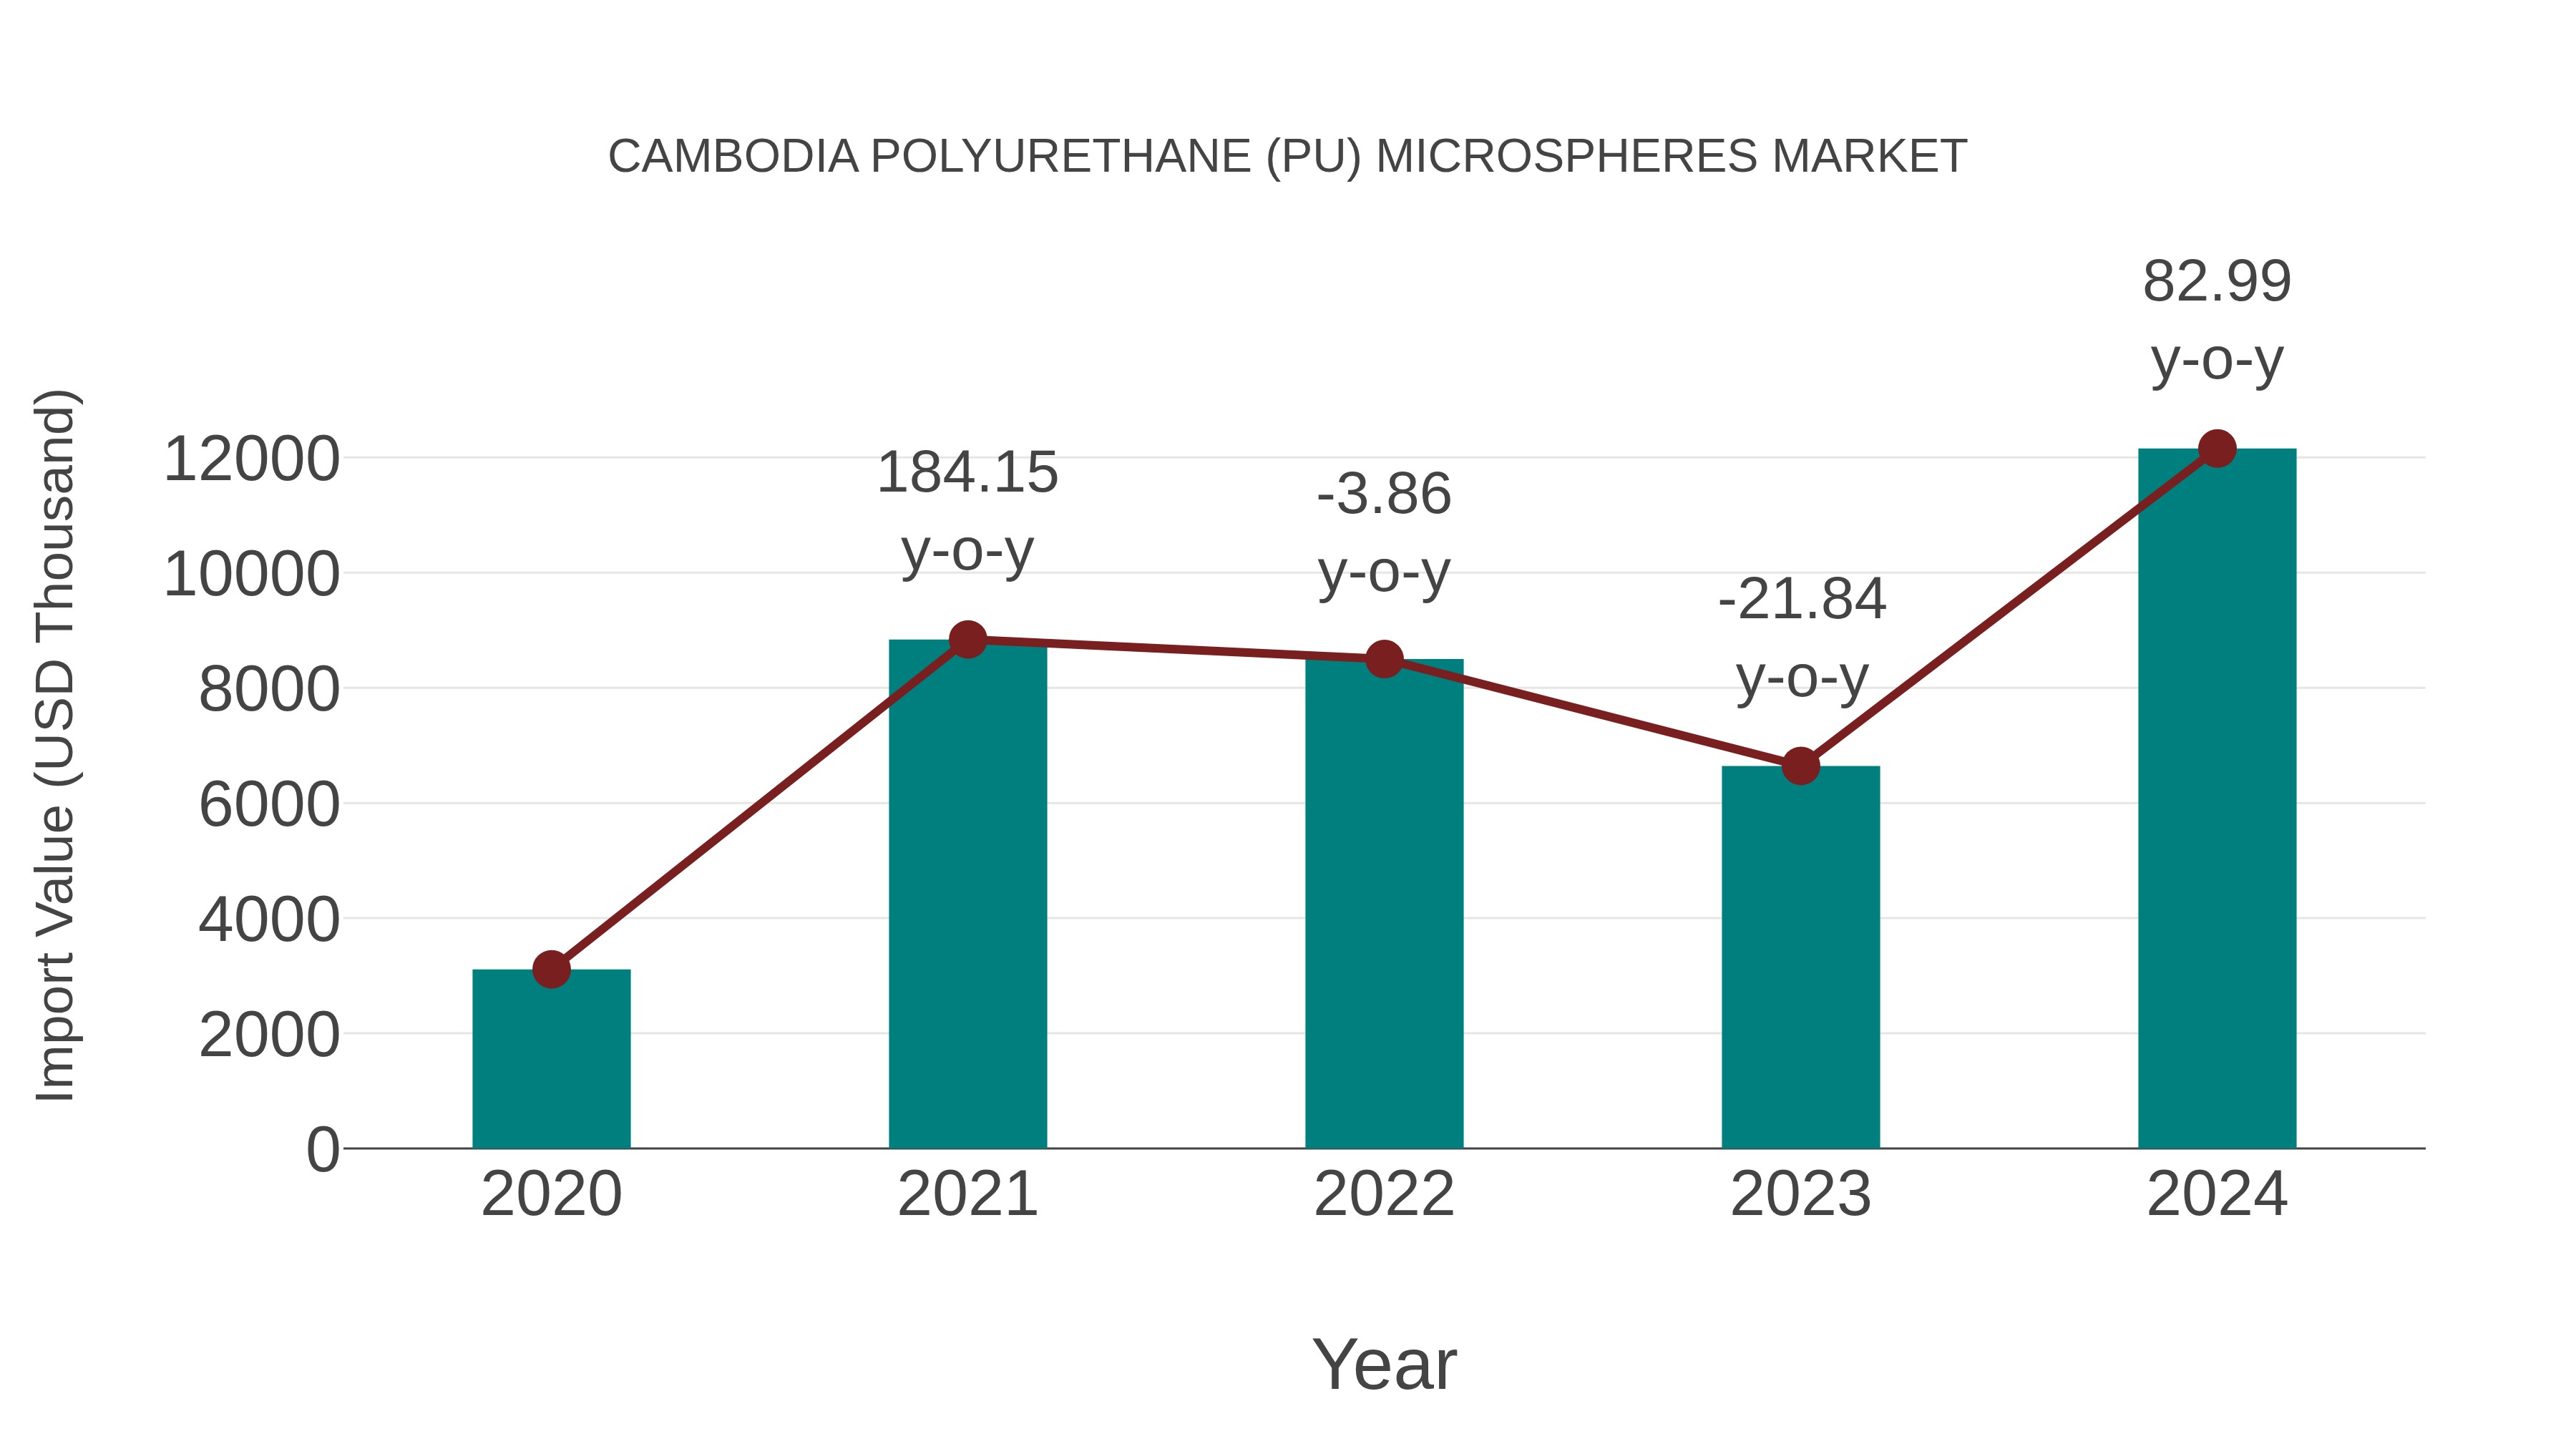
Cambodia Polyurethane (Pu) Microspheres Market: Import Trend Analysis
In 2024, Cambodia import of polyurethane (PU) microspheres increased steadily due to rising demand from various industries. The market`s growth was driven by the country`s expanding manufacturing sector and increased usage of PU microspheres in cosmetics and coatings applications.
Cambodia Polyurethane (PU) Microspheres Market Overview
In Cambodia, the polyurethane microspheres market is experiencing significant growth owing to the versatile applications of PU microspheres across various industries such as coatings, adhesives, and personal care products. PU microspheres offer lightweight, durable, and thermally insulating properties, making them ideal for enhancing product performance and aesthetics. As industries in Cambodia continue to innovate and expand, the demand for polyurethane microspheres is expected to rise further, driving market growth.
Drivers of the market
The Cambodia polyurethane microspheres market is experiencing robust growth owing to their extensive use in diverse industries such as automotive, construction, and cosmetics. These microspheres are valued for their lightweight properties, high strength, and excellent insulation characteristics. In the construction sector, the rising demand for energy-efficient materials is fueling the adoption of polyurethane microspheres in insulation applications. Moreover, the expanding automotive production in Cambodia is driving the demand for lightweight materials, thereby boosting the growth of the polyurethane microspheres market.
Challenges of the market
The Cambodian market for polyurethane microspheres faces various challenges that impact its growth potential. One significant challenge is the lack of domestic production facilities for polyurethane microspheres in Cambodia. This absence necessitates reliance on imports, which can be subject to supply chain disruptions, import restrictions, and currency fluctuations, affecting market stability. Moreover, the limited research and development infrastructure in Cambodia hinder innovation and product differentiation in the polyurethane microspheres market. Additionally, the competitive landscape dominated by established international players poses a challenge for local businesses looking to enter or expand in this market segment.
Government Policy of the market
In Cambodia, the polyurethane microspheres market operates under specific government policies geared towards product quality, safety standards, and environmental protection. Regulatory bodies like the Ministry of Environment and the Ministry of Commerce oversee these policies. They involve measures such as quality certifications, import/export regulations, and environmental impact assessments to ensure sustainable production and usage of polyurethane microspheres in various industries.
Key Highlights of the Report:
- Cambodia Polyurethane (PU) Microspheres Market Outlook
- Market Size of Cambodia Polyurethane (PU) Microspheres Market, 2025
- Forecast of Cambodia Polyurethane (PU) Microspheres Market, 2032
- Historical Data and Forecast of Cambodia Polyurethane (PU) Microspheres Revenues & Volume for the Period 2022-2032F
- Cambodia Polyurethane (PU) Microspheres Market Trend Evolution
- Cambodia Polyurethane (PU) Microspheres Market Drivers and Challenges
- Cambodia Polyurethane (PU) Microspheres Price Trends
- Cambodia Polyurethane (PU) Microspheres Porter's Five Forces
- Cambodia Polyurethane (PU) Microspheres Industry Life Cycle
- Historical Data and Forecast of Cambodia Polyurethane (PU) Microspheres Market Revenues & Volume By Applications for the Period 2022-2032F
- Historical Data and Forecast of Cambodia Polyurethane (PU) Microspheres Market Revenues & Volume By Encapsulation for the Period 2022-2032F
- Historical Data and Forecast of Cambodia Polyurethane (PU) Microspheres Market Revenues & Volume By Paints & coatings for the Period 2022-2032F
- Historical Data and Forecast of Cambodia Polyurethane (PU) Microspheres Market Revenues & Volume By Adhesives films for the Period 2022-2032F
- Historical Data and Forecast of Cambodia Polyurethane (PU) Microspheres Market Revenues & Volume By Cosmetics for the Period 2022-2032F
- Historical Data and Forecast of Cambodia Polyurethane (PU) Microspheres Market Revenues & Volume By Other applications for the Period 2022-2032F
- Cambodia Polyurethane (PU) Microspheres Import Export Trade Statistics
- Market Opportunity Assessment By Applications
- Cambodia Polyurethane (PU) Microspheres Top Companies Market Share
- Cambodia Polyurethane (PU) Microspheres Competitive Benchmarking By Technical and Operational Parameters
- Cambodia Polyurethane (PU) Microspheres Company Profiles
- Cambodia Polyurethane (PU) Microspheres Key Strategic Recommendations
Cambodia Polyurethane (PU) Microspheres Market (2026-2032): FAQs
6Wresearch actively monitors the Cambodia Polyurethane (PU) Microspheres Market and publishes its comprehensive annual report, highlighting emerging trends, growth drivers, revenue analysis, and forecast outlook. Our insights help businesses to make data-backed strategic decisions with ongoing market dynamics. Our analysts track relevent industries related to the Cambodia Polyurethane (PU) Microspheres Market, allowing our clients with actionable intelligence and reliable forecasts tailored to emerging regional needs.
Yes, we provide customisation as per your requirements. To learn more, feel free to contact us on sales@6wresearch.com
1 Executive Summary |
2 Introduction |
2.1 Key Highlights of the Report |
2.2 Report Description |
2.3 Market Scope & Segmentation |
2.4 Research Methodology |
2.5 Assumptions |
3 Cambodia Polyurethane (PU) Microspheres Market Overview |
3.1 Cambodia Country Macro Economic Indicators |
3.2 Cambodia Polyurethane (PU) Microspheres Market Revenues & Volume, 2022 & 2032F |
3.3 Cambodia Polyurethane (PU) Microspheres Market - Industry Life Cycle |
3.4 Cambodia Polyurethane (PU) Microspheres Market - Porter's Five Forces |
3.5 Cambodia Polyurethane (PU) Microspheres Market Revenues & Volume Share, By Applications, 2022 & 2032F |
4 Cambodia Polyurethane (PU) Microspheres Market Dynamics |
4.1 Impact Analysis |
4.2 Market Drivers |
4.2.1 Growing demand for lightweight materials in various industries such as automotive, construction, and electronics |
4.2.2 Increasing use of polyurethane microspheres in coatings, adhesives, and sealants for their unique properties like low density and thermal insulation |
4.3 Market Restraints |
4.3.1 Fluctuating raw material prices affecting the production cost of polyurethane microspheres |
4.3.2 Limited awareness about the benefits and applications of polyurethane microspheres among end-users |
5 Cambodia Polyurethane (PU) Microspheres Market Trends |
6 Cambodia Polyurethane (PU) Microspheres Market, By Types |
6.1 Cambodia Polyurethane (PU) Microspheres Market, By Applications |
6.1.1 Overview and Analysis |
6.1.2 Cambodia Polyurethane (PU) Microspheres Market Revenues & Volume, By Applications, 2022-2032F |
6.1.3 Cambodia Polyurethane (PU) Microspheres Market Revenues & Volume, By Encapsulation, 2022-2032F |
6.1.4 Cambodia Polyurethane (PU) Microspheres Market Revenues & Volume, By Paints & coatings, 2022-2032F |
6.1.5 Cambodia Polyurethane (PU) Microspheres Market Revenues & Volume, By Adhesives films, 2022-2032F |
6.1.6 Cambodia Polyurethane (PU) Microspheres Market Revenues & Volume, By Cosmetics, 2022-2032F |
6.1.7 Cambodia Polyurethane (PU) Microspheres Market Revenues & Volume, By Other applications, 2022-2032F |
7 Cambodia Polyurethane (PU) Microspheres Market Import-Export Trade Statistics |
7.1 Cambodia Polyurethane (PU) Microspheres Market Export to Major Countries |
7.2 Cambodia Polyurethane (PU) Microspheres Market Imports from Major Countries |
8 Cambodia Polyurethane (PU) Microspheres Market Key Performance Indicators |
8.1 Research and development investment in innovative applications of polyurethane microspheres |
8.2 Percentage increase in the adoption of polyurethane microspheres by different industries |
8.3 Environmental sustainability initiatives related to the production and use of polyurethane microspheres |
9 Cambodia Polyurethane (PU) Microspheres Market - Opportunity Assessment |
9.1 Cambodia Polyurethane (PU) Microspheres Market Opportunity Assessment, By Applications, 2022 & 2032F |
10 Cambodia Polyurethane (PU) Microspheres Market - Competitive Landscape |
10.1 Cambodia Polyurethane (PU) Microspheres Market Revenue Share, By Companies, 2025 |
10.2 Cambodia Polyurethane (PU) Microspheres Market Competitive Benchmarking, By Operating and Technical Parameters |
11 Company Profiles |
12 Recommendations |
13 Disclaimer |
Global Go To Market Strategy - 2030
Export potential enables firms to identify high-growth global markets with greater confidence by combining advanced trade intelligence with a structured quantitative methodology. The framework analyzes emerging demand trends and country-level import patterns while integrating macroeconomic and trade datasets such as GDP and population forecasts, bilateral import–export flows, tariff structures, elasticity differentials between developed and developing economies, geographic distance, and import demand projections. Using weighted trade values from 2020–2024 as the base period to project country-to-country export potential for 2030, these inputs are operationalized through calculated drivers such as gravity model parameters, tariff impact factors, and projected GDP per-capita growth. Through an analysis of hidden potentials, demand hotspots, and market conditions that are most favorable to success, this method enables firms to focus on target countries, maximize returns, and global expansion with data, backed by accuracy.
By factoring in the projected importer demand gap that is currently unmet and could be potential opportunity, it identifies the potential for the Exporter (Country) among 190 countries, against the general trade analysis, which identifies the biggest importer or exporter.
To discover high-growth global markets and optimize your business strategy:
Click Here
Pricing
- Single User License$ 1,995
- Department License$ 2,400
- Site License$ 3,120
- Global License$ 3,795

Leadership Perspectives from Industry Events
Search
Thought Leadership and Analyst Meet


Our Clients
6WResearch In News
- Doha a strategic location for EV manufacturing hub: IPA Qatar
- Demand for luxury TVs surging in the GCC, says Samsung
- Empowering Growth: The Thriving Journey of Bangladesh’s Cable Industry
- Demand for luxury TVs surging in the GCC, says Samsung
- Video call with a traditional healer? Once unthinkable, it’s now common in South Africa
- Intelligent Buildings To Smooth GCC’s Path To Net Zero
Latest Reports
- Cape Verde Portable Hand-Thrown Extinguisher Market (2026-2032)
- Canada Portable Hand-Thrown Extinguisher Market (2026-2032)
- Cameroon Portable Hand-Thrown Extinguisher Market (2026-2032)
- Burundi Portable Hand-Thrown Extinguisher Market (2026-2032)
- Burkina Faso Portable Hand-Thrown Extinguisher Market (2026-2032)
- Bulgaria Portable Hand-Thrown Extinguisher Market (2026-2032)
- Brunei Portable Hand-Thrown Extinguisher Market (2026-2032)
- Botswana Portable Hand-Thrown Extinguisher Market (2026-2032)
- Bosnia and Herzegovina Portable Hand-Thrown Extinguisher Market (2026-2032)
- Bolivia Portable Hand-Thrown Extinguisher Market (2026-2032)
Industry Events and Analyst Meet

HIMTEX 2026

India Refining Summit 2026

India EV Show 2026

EV tech India Expo 2026

Auto Tech Asia 2026
Whitepaper
- Middle East & Africa Commercial Security Market Click here to view more.
- Middle East & Africa Fire Safety Systems & Equipment Market Click here to view more.
- GCC Drone Market Click here to view more.
- Middle East Lighting Fixture Market Click here to view more.
- GCC Physical & Perimeter Security Market Click here to view more.