Cambodia Soft Drinks Packaging Market (2026-2032) Outlook | Trends, Share, Size, Forecast, Companies, Analysis, Growth, Industry, Revenue & Value
Market Forecast By Material (Paper, Plastic, Metal, Glass), By Product Type (Cans, Boxes, Bottles, Cartons), By Capacity (Up to 100 ml, 100 to 250 ml, 250 to 500 ml, 500 to 1000 ml, 1000 to 2000 ml, Above 2000 ml), By Application (Carbonated soft drinks, Functional Drinks, Sport Drinks, Energy Drinks, Others, Juices) And Competitive Landscape
| Product Code: ETC189885 | Publication Date: May 2022 | Updated Date: Jun 2026 | Product Type: Market Research Report | |
| Publisher: 6Wresearch | Author: Summon Dutta | No. of Pages: 60 | No. of Figures: 40 | No. of Tables: 7 |
Cambodia Soft Drinks Packaging Market Size, Share & Growth Rate
The Cambodia Soft Drinks Packaging Market was estimated at USD 318 Million in 2025 and is projected to reach USD 444 Million by 2032, growing at a CAGR of 4.9% from 2026 to 2032. This growth trajectory is primarily driven by the increasing demand for convenient, on-the-go beverage options, as consumer lifestyles continue to evolve. Additionally, the rising awareness of environmental sustainability is pushing manufacturers towards innovative and eco-friendly packaging solutions, further enhancing market potential.
Cambodia Soft Drinks Packaging Market Year-wise Growth Rate and Key Drivers
This graph highlights how the Cambodia Soft Drinks Packaging Market has steadily grown over the years, supported by major growth factors.
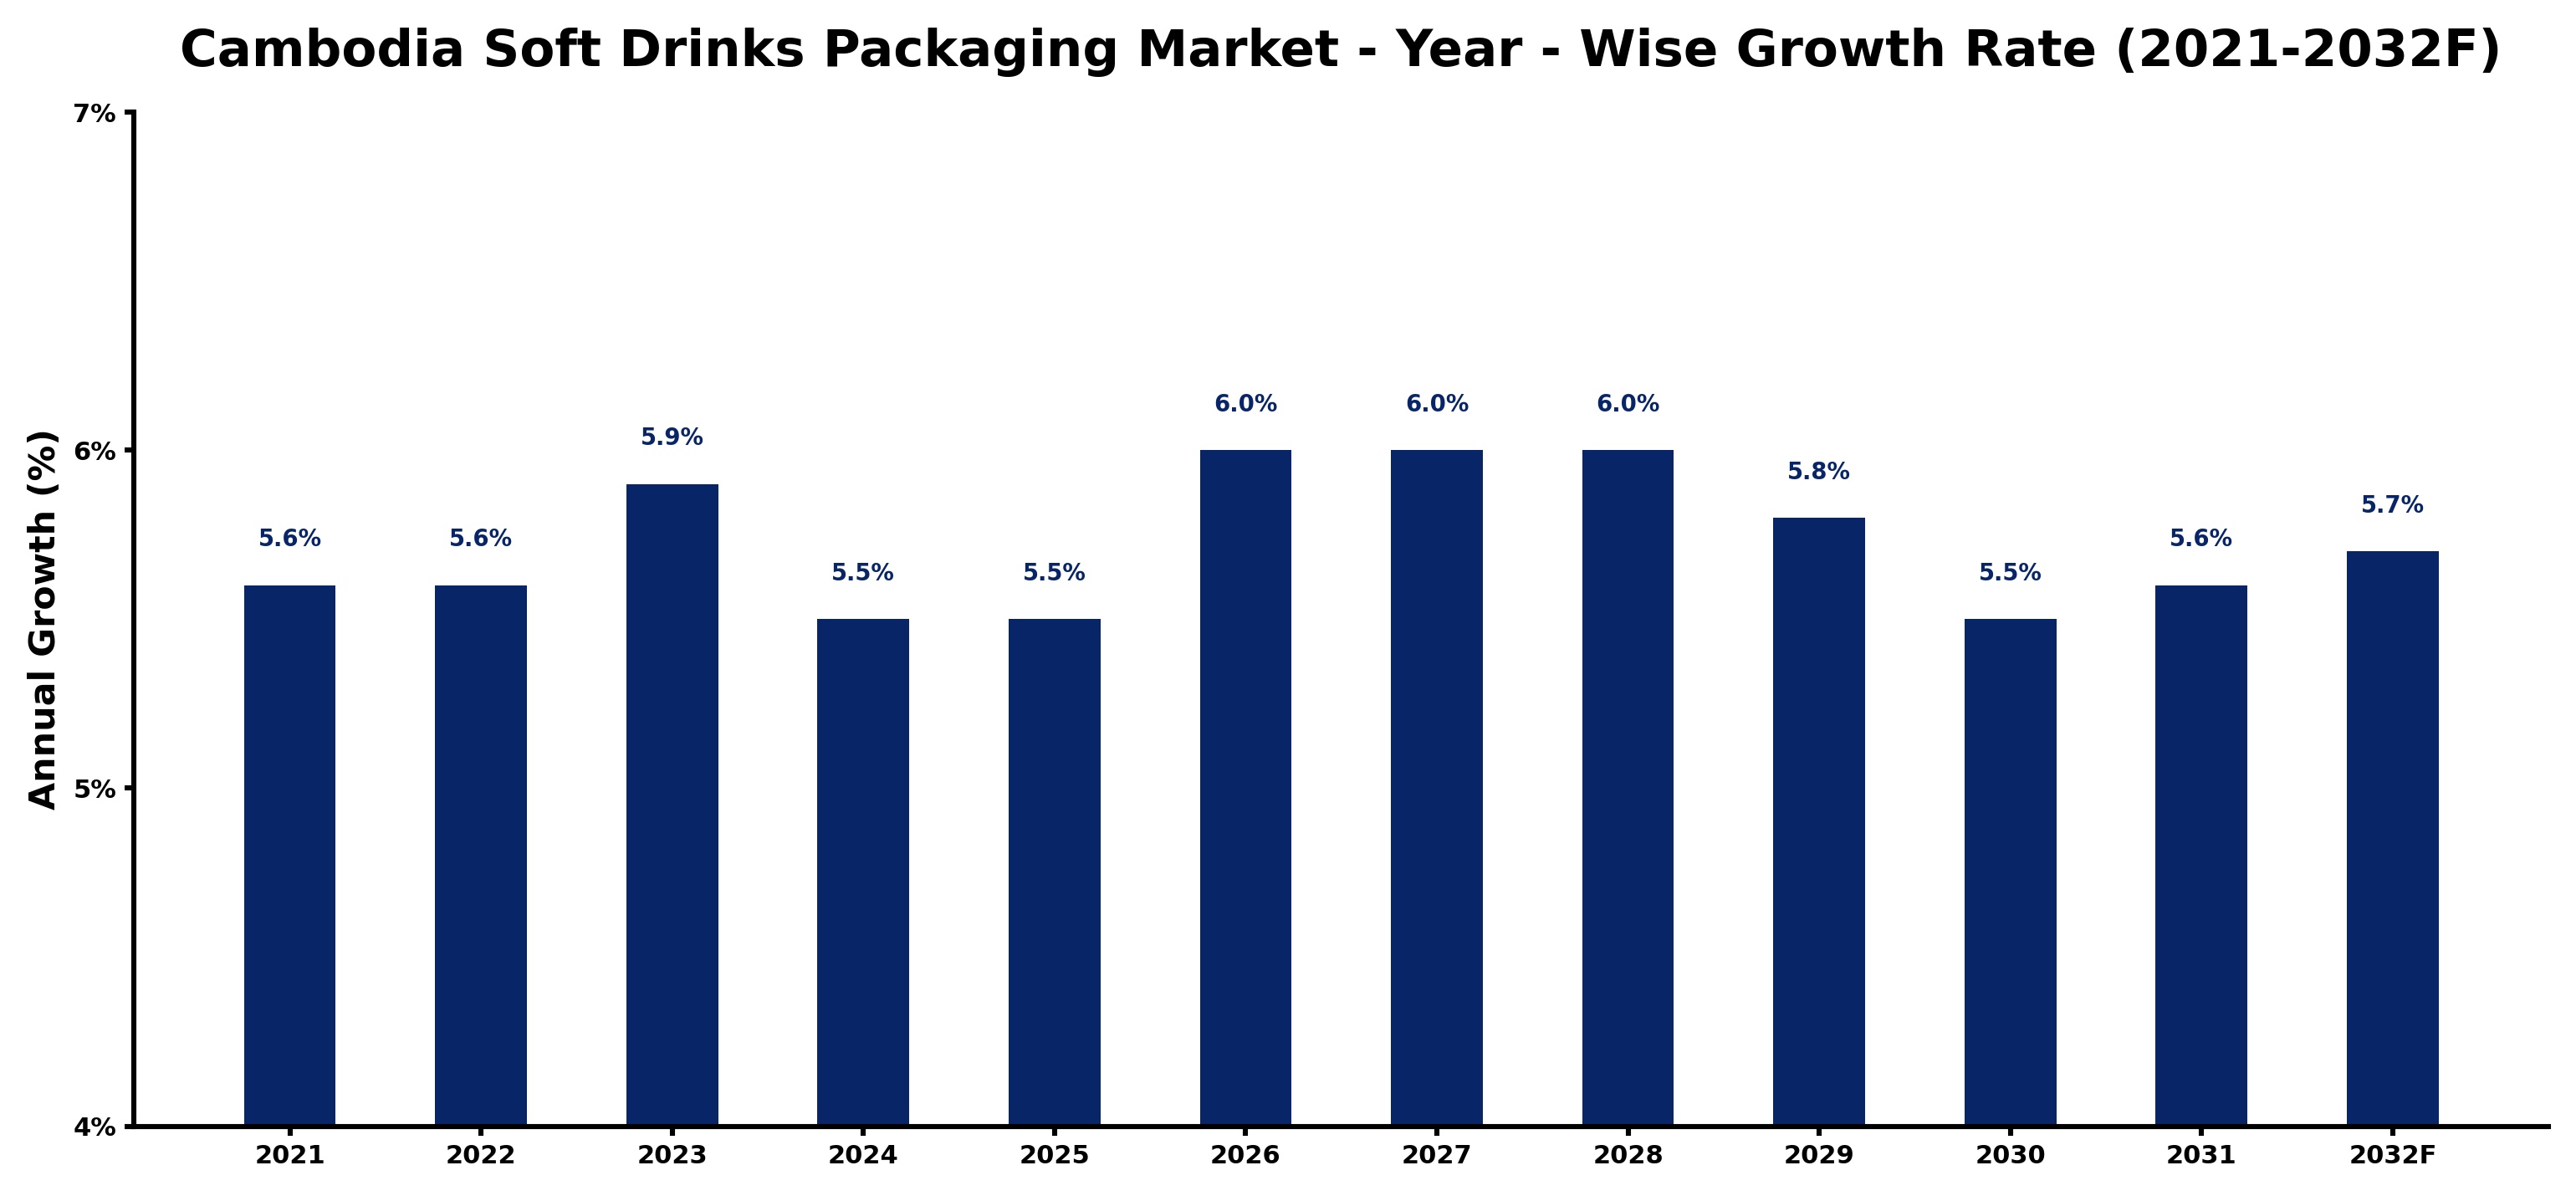
The table below presents the year‑wise growth rates along with the key drivers influencing the market
| Year | Growth Rate | Major Drivers |
| 2021 | 5.6% | Rising urbanization increased demand |
| 2022 | 5.6% | Health consciousness drove product innovation |
| 2023 | 5.9% | E-commerce growth expanded market reach |
| 2024 | 5.5% | Sustainable packaging gained popularity |
| 2025 | 5.5% | Local brand emergence strengthened competition |
| 2026 | 6.0% | Increased disposable income fueled consumption |
| 2027 | 6.0% | Youth demographic influenced beverage choices |
| 2028 | 6.0% | Tourism recovery boosted sales channels |
| 2029 | 5.8% | Flavor diversification attracted new consumers |
| 2030 | 5.5% | Retail partnerships enhanced distribution networks |
| 2031 | 5.6% | Social media marketing increased visibility |
| 2032 | 5.7% | Product quality improvements drove loyalty |
Note - Market size estimations and growth projections presented in this report are based on 6Wresearch’s advanced forecasting approach, validated with industry datasets as of June 2026.
Cambodia Soft Drinks Packaging Market Synopsis
In Cambodia, the packaging landscape for soft drinks is rapidly changing, with a noticeable preference for PET bottles due to their lightweight nature and recyclability. This preference is complemented by growing consumer awareness regarding sustainability, prompting a shift towards alternative materials such as glass and aluminum.
The market is characterized by vibrant innovations in packaging design, where brands are increasingly adopting eye-catching labels and distinctive shapes. This creative approach not only captures consumer interest but also addresses the competitive dynamics of a burgeoning beverage sector.
Cambodia Soft Drinks Packaging Market Key Takeaways
- Growing consumer demand for convenience is driving the shift towards smaller packaging formats.
- Innovations in eco-friendly materials are shaping the future of the packaging industry.
- Competitive landscape features both local and international players, creating diverse market dynamics.
- Technological advancements in packaging efficiency are becoming crucial for market players.
- Government policies promoting sustainability are influencing packaging materials and practices.
Evaluation of Restraints in Cambodia Soft Drinks Packaging Market
Despite its promising outlook, the Cambodia Soft Drinks Packaging Market faces several significant restraints. A notable challenge is the underdeveloped infrastructure for efficient packaging and distribution, which can hinder the supply chain. Additionally, the limited availability of high-quality, sustainable packaging materials poses obstacles for manufacturers aiming to meet rising eco-friendly consumer demands. Furthermore, the reliance on imported specialized packaging solutions can lead to high costs, making it essential for local businesses to adapt strategically in a competitive environment.
Cambodia Soft Drinks Packaging Market Trends
The market is currently witnessing a pronounced shift towards sustainability, with companies increasingly opting for biodegradable materials, paper-based cartons, and reusable packaging options. This trend reflects a growing awareness of environmental issues among consumers. Moreover, the rise of personalized packaging designs, aimed at appealing to younger demographics, is gaining momentum. Companies are also exploring smart packaging technologies that offer interactive features, further enhancing consumer engagement and providing relevant product information.
Cambodia Soft Drinks Packaging Market Opportunities
Investment opportunities in the Cambodia Soft Drinks Packaging Market are substantial, particularly in the development of innovative, sustainable packaging solutions. As consumers lean towards healthier beverage options, there is a growing need for lightweight and convenient packaging formats. Moreover, companies that invest in technologies that enhance shelf life and reduce environmental impact are well-positioned for growth. Strategic partnerships with local manufacturers can also provide a competitive edge by offering customized packaging solutions tailored to specific product needs.
Government Initiatives in the Cambodia Soft Drinks Packaging Market
The Cambodian government is actively promoting environmental sustainability within the soft drinks packaging sector. Policies aimed at reducing single-use plastics are being implemented, including regulations that encourage the adoption of biodegradable materials. Moreover, there are initiatives in place to enhance recycling efforts and proper waste disposal practices. These government-led efforts are crucial for companies in the market to align with national environmental goals and regulations.
Future Insights of the Cambodia Soft Drinks Packaging Market
Looking ahead to 2026-2032, the Cambodia Soft Drinks Packaging Market is expected to continue its steady growth, driven by rising disposable incomes and a young, increasingly health-conscious population. Demand for innovative and sustainable packaging solutions will be paramount, aligning with shifting consumer preferences. As brands strive for differentiation, an emphasis on eye-catching designs and eco-friendly materials will shape the competitive landscape, indicating a transformative phase for the market.
Cambodia Soft Drinks Packaging Market Latest Developments (May 2025 - June 2026)
In recent months, the Cambodia Soft Drinks Packaging Market has seen a surge in initiatives focusing on sustainable packaging solutions, with several companies ramping up investments in biodegradable materials. There has also been a notable increase in collaborations between packaging firms and beverage manufacturers, aimed at creating customized, eco-friendly packaging designs. As consumer demand for convenience continues to rise, manufacturers are exploring new technologies to enhance efficiency and sustainability in their packaging processes.
Cambodia Soft Drinks Packaging Market - Key Attractiveness of the Report
- 10 Years of Market Numbers
- Historical Data Starting from 2022 to 2025
- Base Year: 2025
- Forecast Data until 2032
- Key Performance Indicators Impacting the Market
- Major Upcoming Developments and Projects
Key Highlights of the Report:
- Cambodia Soft Drinks Packaging Market Outlook
- Market Size of Cambodia Soft Drinks Packaging Market, 2025
- Forecast of Cambodia Soft Drinks Packaging Market, 2032
- Historical Data and Forecast of Cambodia Soft Drinks Packaging Revenues & Volume for the Period 2022-2032F
- Cambodia Soft Drinks Packaging Market Trend Evolution
- Cambodia Soft Drinks Packaging Market Drivers and Challenges
- Cambodia Soft Drinks Packaging Price Trends
- Cambodia Soft Drinks Packaging Porter's Five Forces
- Cambodia Soft Drinks Packaging Industry Life Cycle
- Historical Data and Forecast of Cambodia Soft Drinks Packaging Market Revenues & Volume By Material for the Period 2022-2032F
- Historical Data and Forecast of Cambodia Soft Drinks Packaging Market Revenues & Volume By Paper for the Period 2022-2032F
- Historical Data and Forecast of Cambodia Soft Drinks Packaging Market Revenues & Volume By Plastic for the Period 2022-2032F
- Historical Data and Forecast of Cambodia Soft Drinks Packaging Market Revenues & Volume By Metal for the Period 2022-2032F
- Historical Data and Forecast of Cambodia Soft Drinks Packaging Market Revenues & Volume By Glass for the Period 2022-2032F
- Historical Data and Forecast of Cambodia Soft Drinks Packaging Market Revenues & Volume By for the Period 2022-2032F
- Historical Data and Forecast of Cambodia Soft Drinks Packaging Market Revenues & Volume By for the Period 2022-2032F
- Historical Data and Forecast of Cambodia Soft Drinks Packaging Market Revenues & Volume By Product Type for the Period 2022-2032F
- Historical Data and Forecast of Cambodia Soft Drinks Packaging Market Revenues & Volume By Cans for the Period 2022-2032F
- Historical Data and Forecast of Cambodia Soft Drinks Packaging Market Revenues & Volume By Boxes for the Period 2022-2032F
- Historical Data and Forecast of Cambodia Soft Drinks Packaging Market Revenues & Volume By Bottles for the Period 2022-2032F
- Historical Data and Forecast of Cambodia Soft Drinks Packaging Market Revenues & Volume By Cartons for the Period 2022-2032F
- Historical Data and Forecast of Cambodia Soft Drinks Packaging Market Revenues & Volume By for the Period 2022-2032F
- Historical Data and Forecast of Cambodia Soft Drinks Packaging Market Revenues & Volume By for the Period 2022-2032F
- Historical Data and Forecast of Cambodia Soft Drinks Packaging Market Revenues & Volume By Capacity for the Period 2022-2032F
- Historical Data and Forecast of Cambodia Soft Drinks Packaging Market Revenues & Volume By Up to 100 ml for the Period 2022-2032F
- Historical Data and Forecast of Cambodia Soft Drinks Packaging Market Revenues & Volume By 100 to 250 ml for the Period 2022-2032F
- Historical Data and Forecast of Cambodia Soft Drinks Packaging Market Revenues & Volume By 250 to 500 ml for the Period 2022-2032F
- Historical Data and Forecast of Cambodia Soft Drinks Packaging Market Revenues & Volume By 500 to 1000 ml for the Period 2022-2032F
- Historical Data and Forecast of Cambodia Soft Drinks Packaging Market Revenues & Volume By 1000 to 2000 ml for the Period 2022-2032F
- Historical Data and Forecast of Cambodia Soft Drinks Packaging Market Revenues & Volume By Above 2000 ml for the Period 2022-2032F
- Historical Data and Forecast of Cambodia Soft Drinks Packaging Market Revenues & Volume By Application for the Period 2022-2032F
- Historical Data and Forecast of Cambodia Soft Drinks Packaging Market Revenues & Volume By Carbonated soft drinks for the Period 2022-2032F
- Historical Data and Forecast of Cambodia Soft Drinks Packaging Market Revenues & Volume By Functional Drinks for the Period 2022-2032F
- Historical Data and Forecast of Cambodia Soft Drinks Packaging Market Revenues & Volume By Sport Drinks for the Period 2022-2032F
- Historical Data and Forecast of Cambodia Soft Drinks Packaging Market Revenues & Volume By Energy Drinks for the Period 2022-2032F
- Historical Data and Forecast of Cambodia Soft Drinks Packaging Market Revenues & Volume By Others for the Period 2022-2032F
- Historical Data and Forecast of Cambodia Soft Drinks Packaging Market Revenues & Volume By Juices for the Period 2022-2032F
- Cambodia Soft Drinks Packaging Import Export Trade Statistics
- Market Opportunity Assessment By Material
- Market Opportunity Assessment By Product Type
- Market Opportunity Assessment By Capacity
- Market Opportunity Assessment By Application
- Cambodia Soft Drinks Packaging Top Companies Market Share
- Cambodia Soft Drinks Packaging Competitive Benchmarking By Technical and Operational Parameters
- Cambodia Soft Drinks Packaging Company Profiles
- Cambodia Soft Drinks Packaging Key Strategic Recommendations
Cambodia Soft Drinks Packaging Market - Frequently Asked Questions
The market is projected to reach USD 444 Million by 2032, indicating a robust growth potential.
The shift toward sustainable practices is pushing manufacturers to adopt biodegradable materials and eco-friendly alternatives, responding to increasing consumer demand for environmentally responsible options.
Companies are increasingly focusing on eye-catching labels and distinctive packaging shapes to capture consumer attention, alongside the integration of smart packaging technologies.
Government initiatives aimed at reducing single-use plastics and promoting recycling are driving companies to adopt more sustainable packaging practices to comply with regulations.
Heightened consumer awareness regarding environmental issues and health has led to increased demand for convenient, sustainable packaging options and healthier beverage choices.
6Wresearch actively monitors the Cambodia Soft Drinks Packaging Market and publishes its comprehensive annual report, highlighting emerging trends, growth drivers, revenue analysis, and forecast outlook. Our insights help businesses to make data-backed strategic decisions with ongoing market dynamics. Our analysts track relevent industries related to the Cambodia Soft Drinks Packaging Market, allowing our clients with actionable intelligence and reliable forecasts tailored to emerging regional needs.
Yes, we provide customisation as per your requirements. To learn more, feel free to contact us on sales@6wresearch.com
1 Executive Summary |
2 Introduction |
2.1 Key Highlights of the Report |
2.2 Report Description |
2.3 Market Scope & Segmentation |
2.4 Research Methodology |
2.5 Assumptions |
3 Cambodia Soft Drinks Packaging Market Overview |
3.1 Cambodia Country Macro Economic Indicators |
3.2 Cambodia Soft Drinks Packaging Market Revenues & Volume, 2022 & 2032F |
3.3 Cambodia Soft Drinks Packaging Market - Industry Life Cycle |
3.4 Cambodia Soft Drinks Packaging Market - Porter's Five Forces |
3.5 Cambodia Soft Drinks Packaging Market Revenues & Volume Share, By Material, 2022 & 2032F |
3.6 Cambodia Soft Drinks Packaging Market Revenues & Volume Share, By Product Type, 2022 & 2032F |
3.7 Cambodia Soft Drinks Packaging Market Revenues & Volume Share, By Capacity, 2022 & 2032F |
3.8 Cambodia Soft Drinks Packaging Market Revenues & Volume Share, By Application, 2022 & 2032F |
4 Cambodia Soft Drinks Packaging Market Dynamics |
4.1 Impact Analysis |
4.2 Market Drivers |
4.2.1 Growing demand for soft drinks in Cambodia due to changing consumer preferences and lifestyles. |
4.2.2 Increasing disposable income and urbanization leading to higher consumption of soft drinks. |
4.2.3 Rise in tourism industry in Cambodia driving demand for packaged soft drinks. |
4.3 Market Restraints |
4.3.1 Concerns regarding environmental impact leading to a shift towards sustainable packaging solutions. |
4.3.2 Fluctuating raw material prices affecting production costs for soft drinks packaging manufacturers. |
5 Cambodia Soft Drinks Packaging Market Trends |
6 Cambodia Soft Drinks Packaging Market, By Types |
6.1 Cambodia Soft Drinks Packaging Market, By Material |
6.1.1 Overview and Analysis |
6.1.2 Cambodia Soft Drinks Packaging Market Revenues & Volume, By Material, 2022-2032F |
6.1.3 Cambodia Soft Drinks Packaging Market Revenues & Volume, By Paper, 2022-2032F |
6.1.4 Cambodia Soft Drinks Packaging Market Revenues & Volume, By Plastic, 2022-2032F |
6.1.5 Cambodia Soft Drinks Packaging Market Revenues & Volume, By Metal, 2022-2032F |
6.1.6 Cambodia Soft Drinks Packaging Market Revenues & Volume, By Glass, 2022-2032F |
6.1.7 Cambodia Soft Drinks Packaging Market Revenues & Volume, By , 2022-2032F |
6.1.8 Cambodia Soft Drinks Packaging Market Revenues & Volume, By , 2022-2032F |
6.2 Cambodia Soft Drinks Packaging Market, By Product Type |
6.2.1 Overview and Analysis |
6.2.2 Cambodia Soft Drinks Packaging Market Revenues & Volume, By Cans, 2022-2032F |
6.2.3 Cambodia Soft Drinks Packaging Market Revenues & Volume, By Boxes, 2022-2032F |
6.2.4 Cambodia Soft Drinks Packaging Market Revenues & Volume, By Bottles, 2022-2032F |
6.2.5 Cambodia Soft Drinks Packaging Market Revenues & Volume, By Cartons, 2022-2032F |
6.2.6 Cambodia Soft Drinks Packaging Market Revenues & Volume, By , 2022-2032F |
6.2.7 Cambodia Soft Drinks Packaging Market Revenues & Volume, By , 2022-2032F |
6.3 Cambodia Soft Drinks Packaging Market, By Capacity |
6.3.1 Overview and Analysis |
6.3.2 Cambodia Soft Drinks Packaging Market Revenues & Volume, By Up to 100 ml, 2022-2032F |
6.3.3 Cambodia Soft Drinks Packaging Market Revenues & Volume, By 100 to 250 ml, 2022-2032F |
6.3.4 Cambodia Soft Drinks Packaging Market Revenues & Volume, By 250 to 500 ml, 2022-2032F |
6.3.5 Cambodia Soft Drinks Packaging Market Revenues & Volume, By 500 to 1000 ml, 2022-2032F |
6.3.6 Cambodia Soft Drinks Packaging Market Revenues & Volume, By 1000 to 2000 ml, 2022-2032F |
6.3.7 Cambodia Soft Drinks Packaging Market Revenues & Volume, By Above 2000 ml, 2022-2032F |
6.4 Cambodia Soft Drinks Packaging Market, By Application |
6.4.1 Overview and Analysis |
6.4.2 Cambodia Soft Drinks Packaging Market Revenues & Volume, By Carbonated soft drinks, 2022-2032F |
6.4.3 Cambodia Soft Drinks Packaging Market Revenues & Volume, By Functional Drinks, 2022-2032F |
6.4.4 Cambodia Soft Drinks Packaging Market Revenues & Volume, By Sport Drinks, 2022-2032F |
6.4.5 Cambodia Soft Drinks Packaging Market Revenues & Volume, By Energy Drinks, 2022-2032F |
6.4.6 Cambodia Soft Drinks Packaging Market Revenues & Volume, By Others, 2022-2032F |
6.4.7 Cambodia Soft Drinks Packaging Market Revenues & Volume, By Juices, 2022-2032F |
7 Cambodia Soft Drinks Packaging Market Import-Export Trade Statistics |
7.1 Cambodia Soft Drinks Packaging Market Export to Major Countries |
7.2 Cambodia Soft Drinks Packaging Market Imports from Major Countries |
8 Cambodia Soft Drinks Packaging Market Key Performance Indicators |
8.1 Percentage of soft drinks consumed in packaged form in Cambodia. |
8.2 Adoption rate of eco-friendly packaging solutions by soft drinks companies in Cambodia. |
8.3 Investment in research and development for innovative packaging technologies in the soft drinks industry in Cambodia. |
9 Cambodia Soft Drinks Packaging Market - Opportunity Assessment |
9.1 Cambodia Soft Drinks Packaging Market Opportunity Assessment, By Material, 2022 & 2032F |
9.2 Cambodia Soft Drinks Packaging Market Opportunity Assessment, By Product Type, 2022 & 2032F |
9.3 Cambodia Soft Drinks Packaging Market Opportunity Assessment, By Capacity, 2022 & 2032F |
9.4 Cambodia Soft Drinks Packaging Market Opportunity Assessment, By Application, 2022 & 2032F |
10 Cambodia Soft Drinks Packaging Market - Competitive Landscape |
10.1 Cambodia Soft Drinks Packaging Market Revenue Share, By Companies, 2025 |
10.2 Cambodia Soft Drinks Packaging Market Competitive Benchmarking, By Operating and Technical Parameters |
11 Company Profiles |
12 Recommendations |
13 Disclaimer |
Global Go To Market Strategy - 2030
Export potential enables firms to identify high-growth global markets with greater confidence by combining advanced trade intelligence with a structured quantitative methodology. The framework analyzes emerging demand trends and country-level import patterns while integrating macroeconomic and trade datasets such as GDP and population forecasts, bilateral import–export flows, tariff structures, elasticity differentials between developed and developing economies, geographic distance, and import demand projections. Using weighted trade values from 2020–2024 as the base period to project country-to-country export potential for 2030, these inputs are operationalized through calculated drivers such as gravity model parameters, tariff impact factors, and projected GDP per-capita growth. Through an analysis of hidden potentials, demand hotspots, and market conditions that are most favorable to success, this method enables firms to focus on target countries, maximize returns, and global expansion with data, backed by accuracy.
By factoring in the projected importer demand gap that is currently unmet and could be potential opportunity, it identifies the potential for the Exporter (Country) among 190 countries, against the general trade analysis, which identifies the biggest importer or exporter.
To discover high-growth global markets and optimize your business strategy:
Click Here
Pricing
- Single User License$ 1,995
- Department License$ 2,400
- Site License$ 3,120
- Global License$ 3,795

Leadership Perspectives from Industry Events
Search
Thought Leadership and Analyst Meet


Our Clients
6WResearch In News
- India Air Conditioner Market Set for Strong Rebound in 2026 After Weather-Led Correction and GST-Driven Recovery: 6Wresearch
- ADAS in India: How Automatic Emergency Braking, Blind Spot Detection & Driver Monitoring are Transforming Road Safety
- Doha a strategic location for EV manufacturing hub: IPA Qatar
- Demand for luxury TVs surging in the GCC, says Samsung
- Empowering Growth: The Thriving Journey of Bangladesh’s Cable Industry
- Demand for luxury TVs surging in the GCC, says Samsung
Latest Reports
- Nicaragua RPG Gaming Market (2026-2032)
- New Zealand RPG Gaming Market (2026-2032)
- Netherlands RPG Gaming Market (2026-2032)
- Nauru RPG Gaming Market (2026-2032)
- Namibia RPG Gaming Market (2026-2032)
- Mozambique RPG Gaming Market (2026-2032)
- Montenegro RPG Gaming Market (2026-2032)
- Mongolia RPG Gaming Market (2026-2032)
- Monaco RPG Gaming Market (2026-2032)
- Micronesia RPG Gaming Market (2026-2032)
Industry Events and Analyst Meet

EV India Expo 2026

HIMTEX 2026

India Refining Summit 2026

India EV Show 2026

EV tech India Expo 2026
Whitepaper
- Middle East & Africa Commercial Security Market Click here to view more.
- Middle East & Africa Fire Safety Systems & Equipment Market Click here to view more.
- GCC Drone Market Click here to view more.
- Middle East Lighting Fixture Market Click here to view more.
- GCC Physical & Perimeter Security Market Click here to view more.