Cape Verde Critical Power , Cooling Market (2026-2032) | Size, Outlook, Trends, Analysis, Revenue, Industry, Value, Forecast, Share, Growth, Companies & Segmentation
Market Forecast By Type (UPS, Genset), By End Use (Industrial, Commercial, IT & Telecom, Transportation), By Cooling Solution Type (Air Conditioning, Chiller, Cooling Tower, Liquid Cooling System) And Competitive Landscape
| Product Code: ETC5783635 | Publication Date: Nov 2023 | Updated Date: Mar 2026 | Product Type: Market Research Report | |
| Publisher: 6Wresearch | Author: Ravi Bhandari | No. of Pages: 60 | No. of Figures: 30 | No. of Tables: 5 |
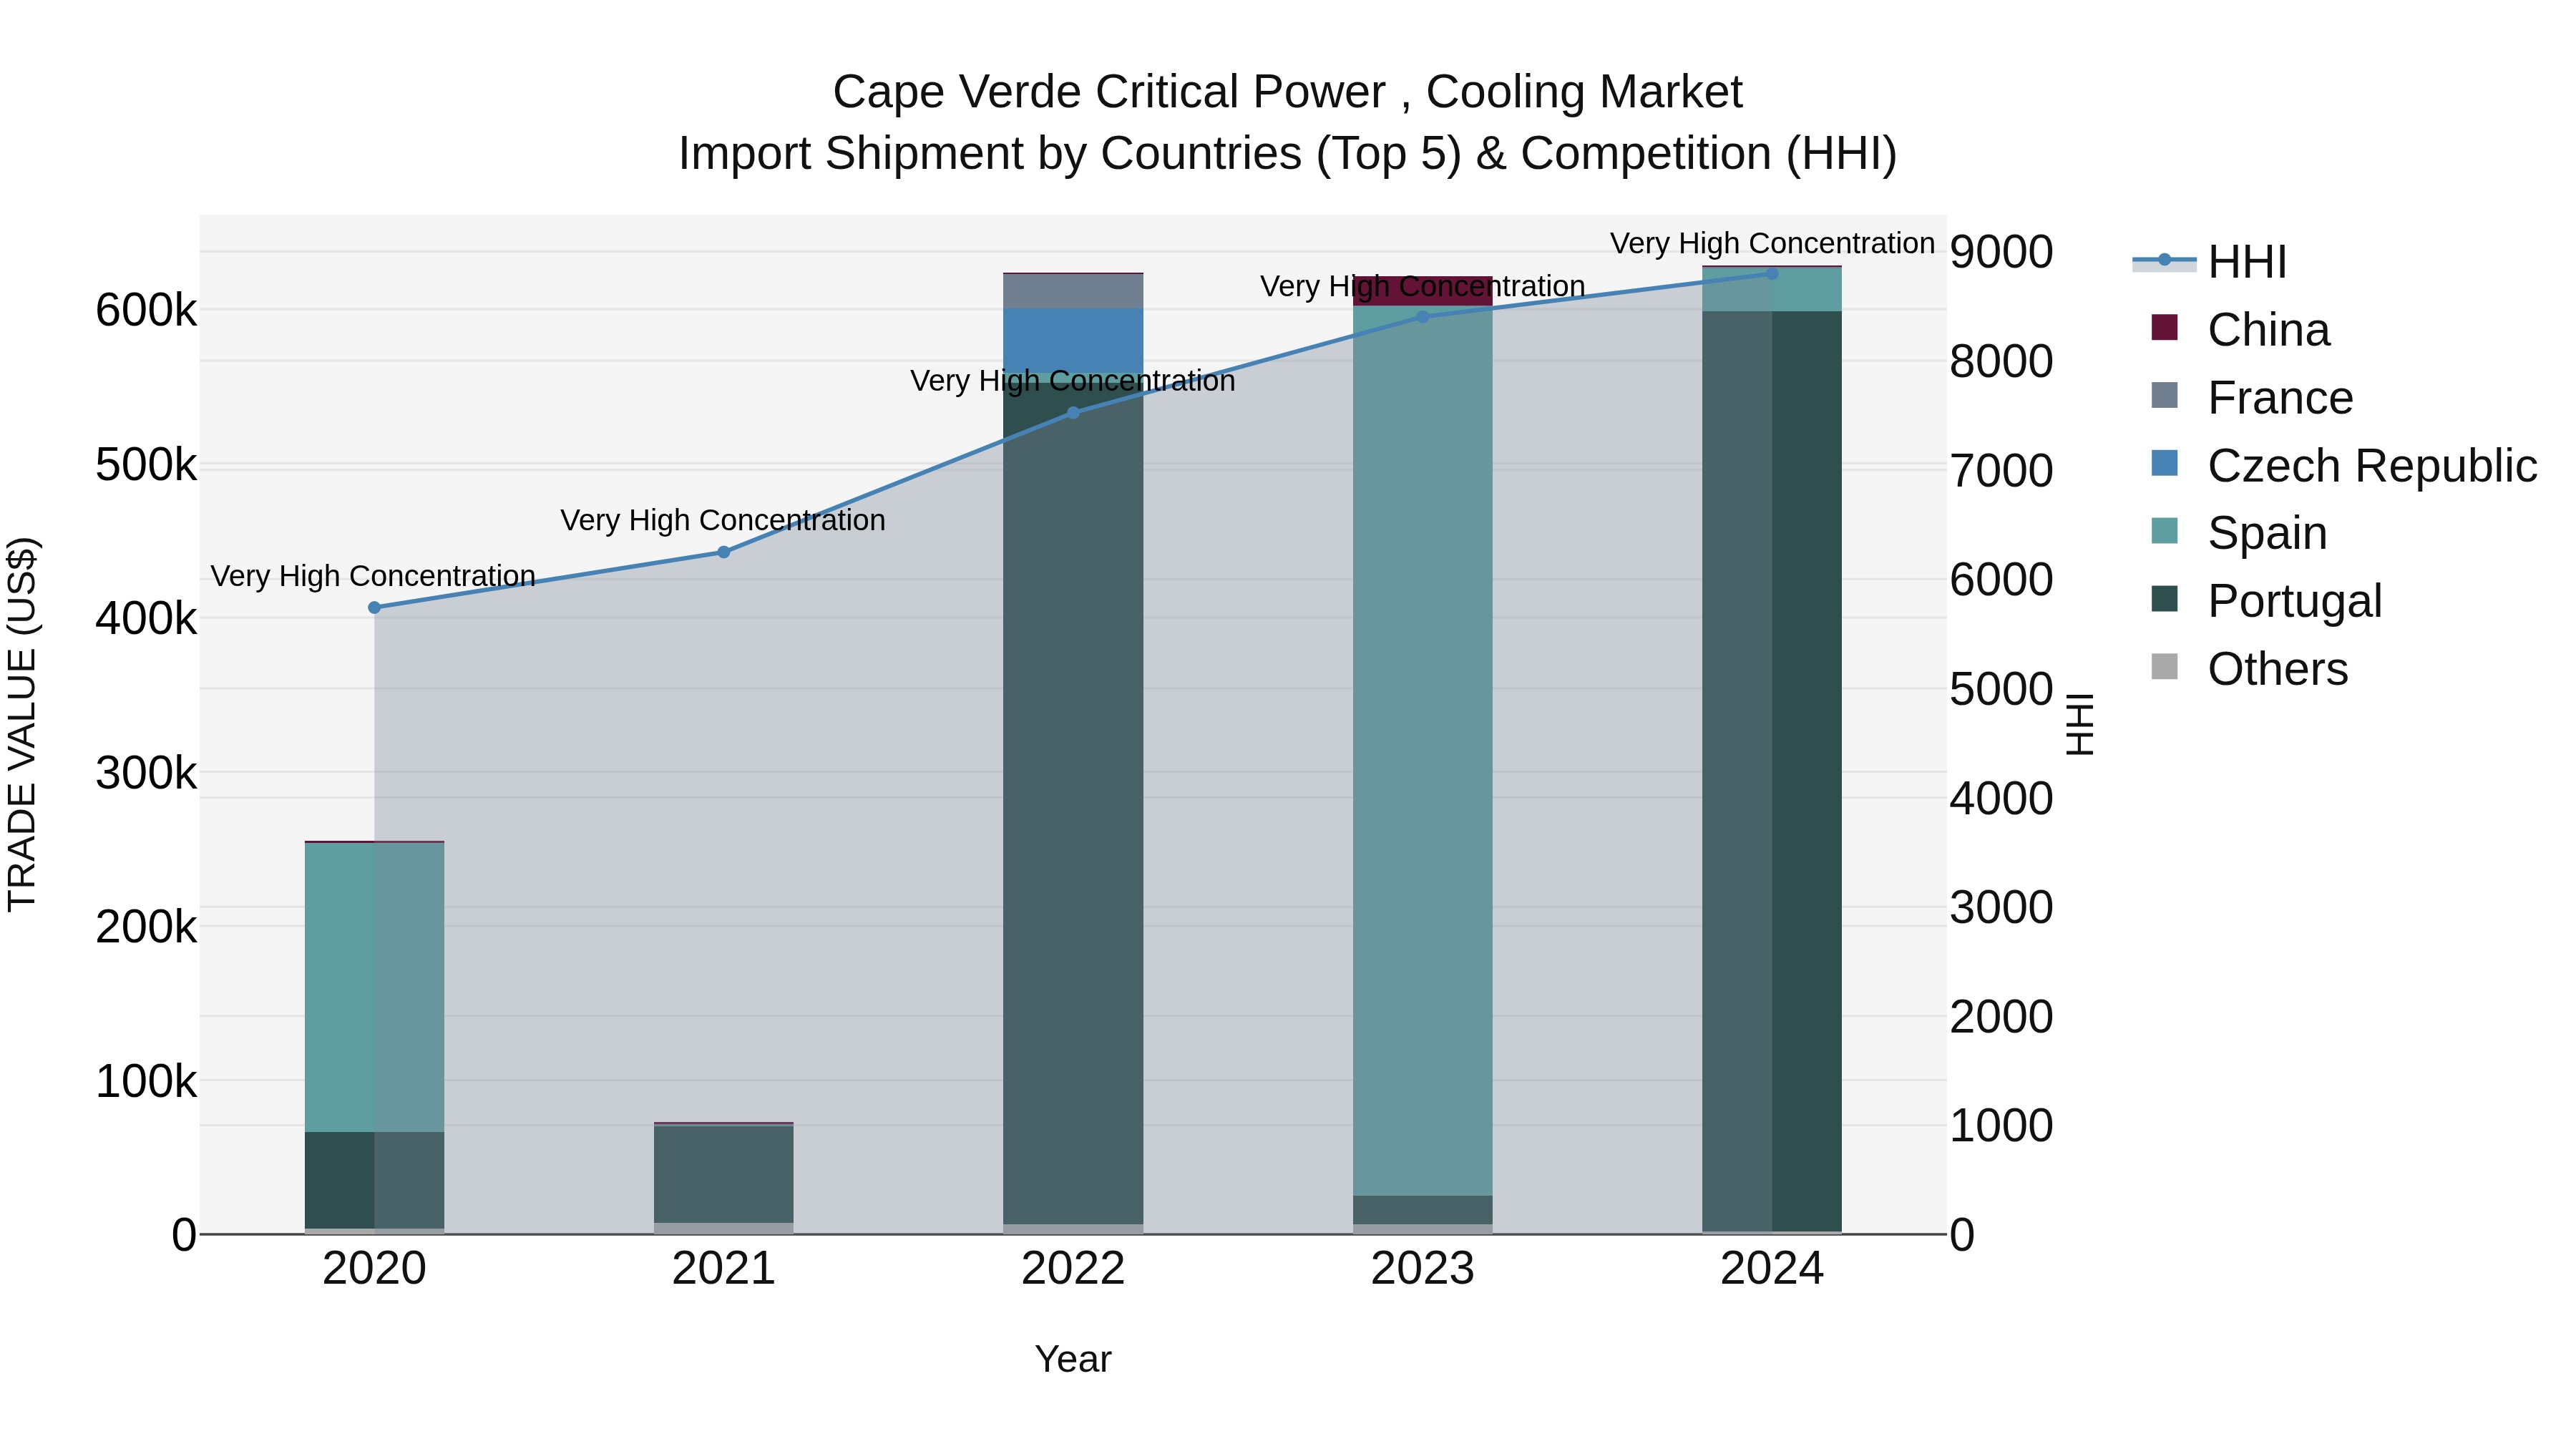
Cape Verde Critical Power , Cooling Market: Top 5 Importing Countries and Market Competition (HHI) Analysis
Cape Verde`s critical power and cooling import shipments are dominated by top exporters such as Portugal, Spain, France, China, and the United States of America in 2024. The high Herfindahl-Hirschman Index (HHI) indicates a concentrated market, while the impressive compound annual growth rate (CAGR) of 25.28% from 2020 to 2024 reflects strong demand. Although the growth rate slightly decreased from 2023 to 2024 at 1.07%, the market continues to show resilience and potential for further expansion in the future.
Key Highlights of the Report:
- Cape Verde Critical Power , Cooling Market Outlook
- Market Size of Cape Verde Critical Power , Cooling Market, 2025
- Forecast of Cape Verde Critical Power , Cooling Market, 2032
- Historical Data and Forecast of Cape Verde Critical Power , Cooling Revenues & Volume for the Period 2022 - 2032F
- Cape Verde Critical Power , Cooling Market Trend Evolution
- Cape Verde Critical Power , Cooling Market Drivers and Challenges
- Cape Verde Critical Power , Cooling Price Trends
- Cape Verde Critical Power , Cooling Porter`s Five Forces
- Cape Verde Critical Power , Cooling Industry Life Cycle
- Historical Data and Forecast of Cape Verde Critical Power , Cooling Market Revenues & Volume By Type for the Period 2022 - 2032F
- Historical Data and Forecast of Cape Verde Critical Power , Cooling Market Revenues & Volume By UPS for the Period 2022 - 2032F
- Historical Data and Forecast of Cape Verde Critical Power , Cooling Market Revenues & Volume By Genset for the Period 2022 - 2032F
- Historical Data and Forecast of Cape Verde Critical Power , Cooling Market Revenues & Volume By End Use for the Period 2022 - 2032F
- Historical Data and Forecast of Cape Verde Critical Power , Cooling Market Revenues & Volume By Industrial for the Period 2022 - 2032F
- Historical Data and Forecast of Cape Verde Critical Power , Cooling Market Revenues & Volume By Commercial for the Period 2022 - 2032F
- Historical Data and Forecast of Cape Verde Critical Power , Cooling Market Revenues & Volume By IT & Telecom for the Period 2022 - 2032F
- Historical Data and Forecast of Cape Verde Critical Power , Cooling Market Revenues & Volume By Transportation for the Period 2022 - 2032F
- Historical Data and Forecast of Cape Verde Critical Power , Cooling Market Revenues & Volume By Cooling Solution Type for the Period 2022 - 2032F
- Historical Data and Forecast of Cape Verde Critical Power , Cooling Market Revenues & Volume By Air Conditioning for the Period 2022 - 2032F
- Historical Data and Forecast of Cape Verde Critical Power , Cooling Market Revenues & Volume By Chiller for the Period 2022 - 2032F
- Historical Data and Forecast of Cape Verde Critical Power , Cooling Market Revenues & Volume By Cooling Tower for the Period 2022 - 2032F
- Historical Data and Forecast of Cape Verde Critical Power , Cooling Market Revenues & Volume By Liquid Cooling System for the Period 2022 - 2032F
- Cape Verde Critical Power , Cooling Import Export Trade Statistics
- Market Opportunity Assessment By Type
- Market Opportunity Assessment By End Use
- Market Opportunity Assessment By Cooling Solution Type
- Cape Verde Critical Power , Cooling Top Companies Market Share
- Cape Verde Critical Power , Cooling Competitive Benchmarking By Technical and Operational Parameters
- Cape Verde Critical Power , Cooling Company Profiles
- Cape Verde Critical Power , Cooling Key Strategic Recommendations
Frequently Asked Questions About the Market Study (FAQs):
6Wresearch actively monitors the Cape Verde Critical Power , Cooling Market and publishes its comprehensive annual report, highlighting emerging trends, growth drivers, revenue analysis, and forecast outlook. Our insights help businesses to make data-backed strategic decisions with ongoing market dynamics. Our analysts track relevent industries related to the Cape Verde Critical Power , Cooling Market, allowing our clients with actionable intelligence and reliable forecasts tailored to emerging regional needs.
Yes, we provide customisation as per your requirements. To learn more, feel free to contact us on sales@6wresearch.com
1 Executive Summary |
2 Introduction |
2.1 Key Highlights of the Report |
2.2 Report Description |
2.3 Market Scope & Segmentation |
2.4 Research Methodology |
2.5 Assumptions |
3 Cape Verde Critical Power , Cooling Market Overview |
3.1 Cape Verde Country Macro Economic Indicators |
3.2 Cape Verde Critical Power , Cooling Market Revenues & Volume, 2022 & 2032F |
3.3 Cape Verde Critical Power , Cooling Market - Industry Life Cycle |
3.4 Cape Verde Critical Power , Cooling Market - Porter's Five Forces |
3.5 Cape Verde Critical Power , Cooling Market Revenues & Volume Share, By Type, 2022 & 2032F |
3.6 Cape Verde Critical Power , Cooling Market Revenues & Volume Share, By End Use, 2022 & 2032F |
3.7 Cape Verde Critical Power , Cooling Market Revenues & Volume Share, By Cooling Solution Type, 2022 & 2032F |
4 Cape Verde Critical Power , Cooling Market Dynamics |
4.1 Impact Analysis |
4.2 Market Drivers |
4.2.1 Increasing demand for reliable power and cooling solutions in Cape Verde due to frequent power outages and rising temperatures. |
4.2.2 Growing investments in infrastructure development and construction projects in Cape Verde, driving the need for critical power and cooling systems. |
4.2.3 Adoption of advanced technologies and digitalization in various industries, leading to higher demand for efficient power and cooling solutions. |
4.3 Market Restraints |
4.3.1 High initial costs associated with implementing critical power and cooling systems, which may deter some potential customers. |
4.3.2 Limited availability of skilled technicians and engineers for installation, maintenance, and repair of complex power and cooling systems in Cape Verde. |
4.3.3 Environmental concerns and regulations regarding energy consumption and carbon emissions, impacting the adoption of power and cooling solutions. |
5 Cape Verde Critical Power , Cooling Market Trends |
6 Cape Verde Critical Power , Cooling Market Segmentations |
6.1 Cape Verde Critical Power , Cooling Market, By Type |
6.1.1 Overview and Analysis |
6.1.2 Cape Verde Critical Power , Cooling Market Revenues & Volume, By UPS, 2022 - 2032F |
6.1.3 Cape Verde Critical Power , Cooling Market Revenues & Volume, By Genset, 2022 - 2032F |
6.2 Cape Verde Critical Power , Cooling Market, By End Use |
6.2.1 Overview and Analysis |
6.2.2 Cape Verde Critical Power , Cooling Market Revenues & Volume, By Industrial, 2022 - 2032F |
6.2.3 Cape Verde Critical Power , Cooling Market Revenues & Volume, By Commercial, 2022 - 2032F |
6.2.4 Cape Verde Critical Power , Cooling Market Revenues & Volume, By IT & Telecom, 2022 - 2032F |
6.2.5 Cape Verde Critical Power , Cooling Market Revenues & Volume, By Transportation, 2022 - 2032F |
6.3 Cape Verde Critical Power , Cooling Market, By Cooling Solution Type |
6.3.1 Overview and Analysis |
6.3.2 Cape Verde Critical Power , Cooling Market Revenues & Volume, By Air Conditioning, 2022 - 2032F |
6.3.3 Cape Verde Critical Power , Cooling Market Revenues & Volume, By Chiller, 2022 - 2032F |
6.3.4 Cape Verde Critical Power , Cooling Market Revenues & Volume, By Cooling Tower, 2022 - 2032F |
6.3.5 Cape Verde Critical Power , Cooling Market Revenues & Volume, By Liquid Cooling System, 2022 - 2032F |
7 Cape Verde Critical Power , Cooling Market Import-Export Trade Statistics |
7.1 Cape Verde Critical Power , Cooling Market Export to Major Countries |
7.2 Cape Verde Critical Power , Cooling Market Imports from Major Countries |
8 Cape Verde Critical Power , Cooling Market Key Performance Indicators |
8.1 Energy efficiency improvement rate of critical power and cooling systems in Cape Verde. |
8.2 Percentage increase in the adoption of renewable energy sources for powering critical systems. |
8.3 Average downtime reduction achieved by businesses using critical power and cooling solutions. |
8.4 Number of new infrastructure projects in Cape Verde incorporating advanced power and cooling technologies. |
8.5 Customer satisfaction ratings related to the reliability and performance of critical power and cooling systems. |
9 Cape Verde Critical Power , Cooling Market - Opportunity Assessment |
9.1 Cape Verde Critical Power , Cooling Market Opportunity Assessment, By Type, 2022 & 2032F |
9.2 Cape Verde Critical Power , Cooling Market Opportunity Assessment, By End Use, 2022 & 2032F |
9.3 Cape Verde Critical Power , Cooling Market Opportunity Assessment, By Cooling Solution Type, 2022 & 2032F |
10 Cape Verde Critical Power , Cooling Market - Competitive Landscape |
10.1 Cape Verde Critical Power , Cooling Market Revenue Share, By Companies, 2025 |
10.2 Cape Verde Critical Power , Cooling Market Competitive Benchmarking, By Operating and Technical Parameters |
11 Company Profiles |
12 Recommendations | 13 Disclaimer |
Export potential assessment - trade Analytics for 2030
Export potential enables firms to identify high-growth global markets with greater confidence by combining advanced trade intelligence with a structured quantitative methodology. The framework analyzes emerging demand trends and country-level import patterns while integrating macroeconomic and trade datasets such as GDP and population forecasts, bilateral import–export flows, tariff structures, elasticity differentials between developed and developing economies, geographic distance, and import demand projections. Using weighted trade values from 2020–2024 as the base period to project country-to-country export potential for 2030, these inputs are operationalized through calculated drivers such as gravity model parameters, tariff impact factors, and projected GDP per-capita growth. Through an analysis of hidden potentials, demand hotspots, and market conditions that are most favorable to success, this method enables firms to focus on target countries, maximize returns, and global expansion with data, backed by accuracy.
By factoring in the projected importer demand gap that is currently unmet and could be potential opportunity, it identifies the potential for the Exporter (Country) among 190 countries, against the general trade analysis, which identifies the biggest importer or exporter.
To discover high-growth global markets and optimize your business strategy:
Click Here
Pricing
- Single User License$ 1,995
- Department License$ 2,400
- Site License$ 3,120
- Global License$ 3,795

Search
Thought Leadership and Analyst Meet


Our Clients
Latest Reports
- France Thermally Conductive Filler Dispersants Market (2026-2032) | Challenges, Restraints, Value, Share, Size, segmentation, Analysis, Trends, Investment Opportunities, Outlook, Pricing, Demand, Forecast, Revenue, Companies, Growth, Drivers, Strategy, Insights, Competition
- Egypt Thermally Conductive Filler Dispersants Market (2026-2032) | Competition, Forecast, Strategy, Value, Insights, Outlook, Investment Opportunities, Pricing, Demand, Share, segmentation, Drivers, Size, Companies, Restraints, Growth, Trends, Revenue, Challenges, Analysis
- Czech Republic Thermally Conductive Filler Dispersants Market (2026-2032) | Forecast, Pricing, Analysis, Drivers, Insights, Size, Demand, Growth, Challenges, segmentation, Competition, Outlook, Trends, Investment Opportunities, Companies, Strategy, Revenue, Share, Value, Restraints
- Colombia Thermally Conductive Filler Dispersants Market (2026-2032) | segmentation, Trends, Share, Drivers, Strategy, Companies, Demand, Insights, Size, Challenges, Value, Competition, Analysis, Growth, Revenue, Restraints, Forecast, Pricing, Outlook, Investment Opportunities
- China Thermally Conductive Filler Dispersants Market (2026-2032) | Restraints, Investment Opportunities, Pricing, Companies, Share, Size, Challenges, Trends, Outlook, Value, Analysis, Competition, Revenue, Drivers, Forecast, Demand, Insights, Growth, Strategy, segmentation
- Chile Thermally Conductive Filler Dispersants Market (2026-2032) | Investment Opportunities, Trends, Value, Restraints, Share, Companies, Forecast, segmentation, Pricing, Challenges, Demand, Size, Analysis, Drivers, Outlook, Growth, Competition, Strategy, Revenue, Insights
- Cambodia Thermally Conductive Filler Dispersants Market (2026-2032) | Analysis, Share, Outlook, Strategy, Pricing, Demand, Size, Growth, segmentation, Insights, Revenue, Forecast, Challenges, Competition, Companies, Investment Opportunities, Trends, Restraints, Value, Drivers
- Brazil Thermally Conductive Filler Dispersants Market (2026-2032) | Restraints, Forecast, Competition, Size, Revenue, Value, Investment Opportunities, Trends, Insights, Outlook, Growth, Analysis, Drivers, segmentation, Pricing, Challenges, Strategy, Share, Companies, Demand
- Bangladesh Thermally Conductive Filler Dispersants Market (2026-2032) | Restraints, Trends, Analysis, Competition, Insights, Forecast, Value, Investment Opportunities, Pricing, Share, Demand, Outlook, Revenue, segmentation, Companies, Drivers, Growth, Size, Challenges, Strategy
- Bahrain Thermally Conductive Filler Dispersants Market (2026-2032) | Trends, Outlook, Pricing, Demand, Value, Competition, Forecast, Growth, segmentation, Revenue, Companies, Analysis, Insights, Size, Drivers, Challenges, Strategy, Investment Opportunities, Share, Restraints
Industry Events and Analyst Meet

HIMTEX 2026

India Refining Summit 2026

India EV Show 2026

EV tech India Expo 2026

Auto Tech Asia 2026
Whitepaper
- Middle East & Africa Commercial Security Market Click here to view more.
- Middle East & Africa Fire Safety Systems & Equipment Market Click here to view more.
- GCC Drone Market Click here to view more.
- Middle East Lighting Fixture Market Click here to view more.
- GCC Physical & Perimeter Security Market Click here to view more.
6WResearch In News
- Doha a strategic location for EV manufacturing hub: IPA Qatar
- Demand for luxury TVs surging in the GCC, says Samsung
- Empowering Growth: The Thriving Journey of Bangladesh’s Cable Industry
- Demand for luxury TVs surging in the GCC, says Samsung
- Video call with a traditional healer? Once unthinkable, it’s now common in South Africa
- Intelligent Buildings To Smooth GCC’s Path To Net Zero