Cape Verde Fruit Pulp Market (2025-2031) | Trends, Segmentation, Size, Share, Analysis, Industry, Growth, Value, Companies, Outlook, Revenue & Forecast
Market Forecast By Fruit Type (Mango, Strawberry, Apple, Guava, Berries, Citrus Fruits, Others), By Form (Liquid, Powder), By Application (Food and Beverages), By Distribution (E-Commerce, Convenience Stores, Supermarkets/Hypermarkets, Specialty Stores, Others) And Competitive Landscape
| Product Code: ETC5015446 | Publication Date: Nov 2023 | Updated Date: Nov 2025 | Product Type: Market Research Report | |
| Publisher: 6Wresearch | Author: Sachin Kumar Rai | No. of Pages: 60 | No. of Figures: 30 | No. of Tables: 5 |
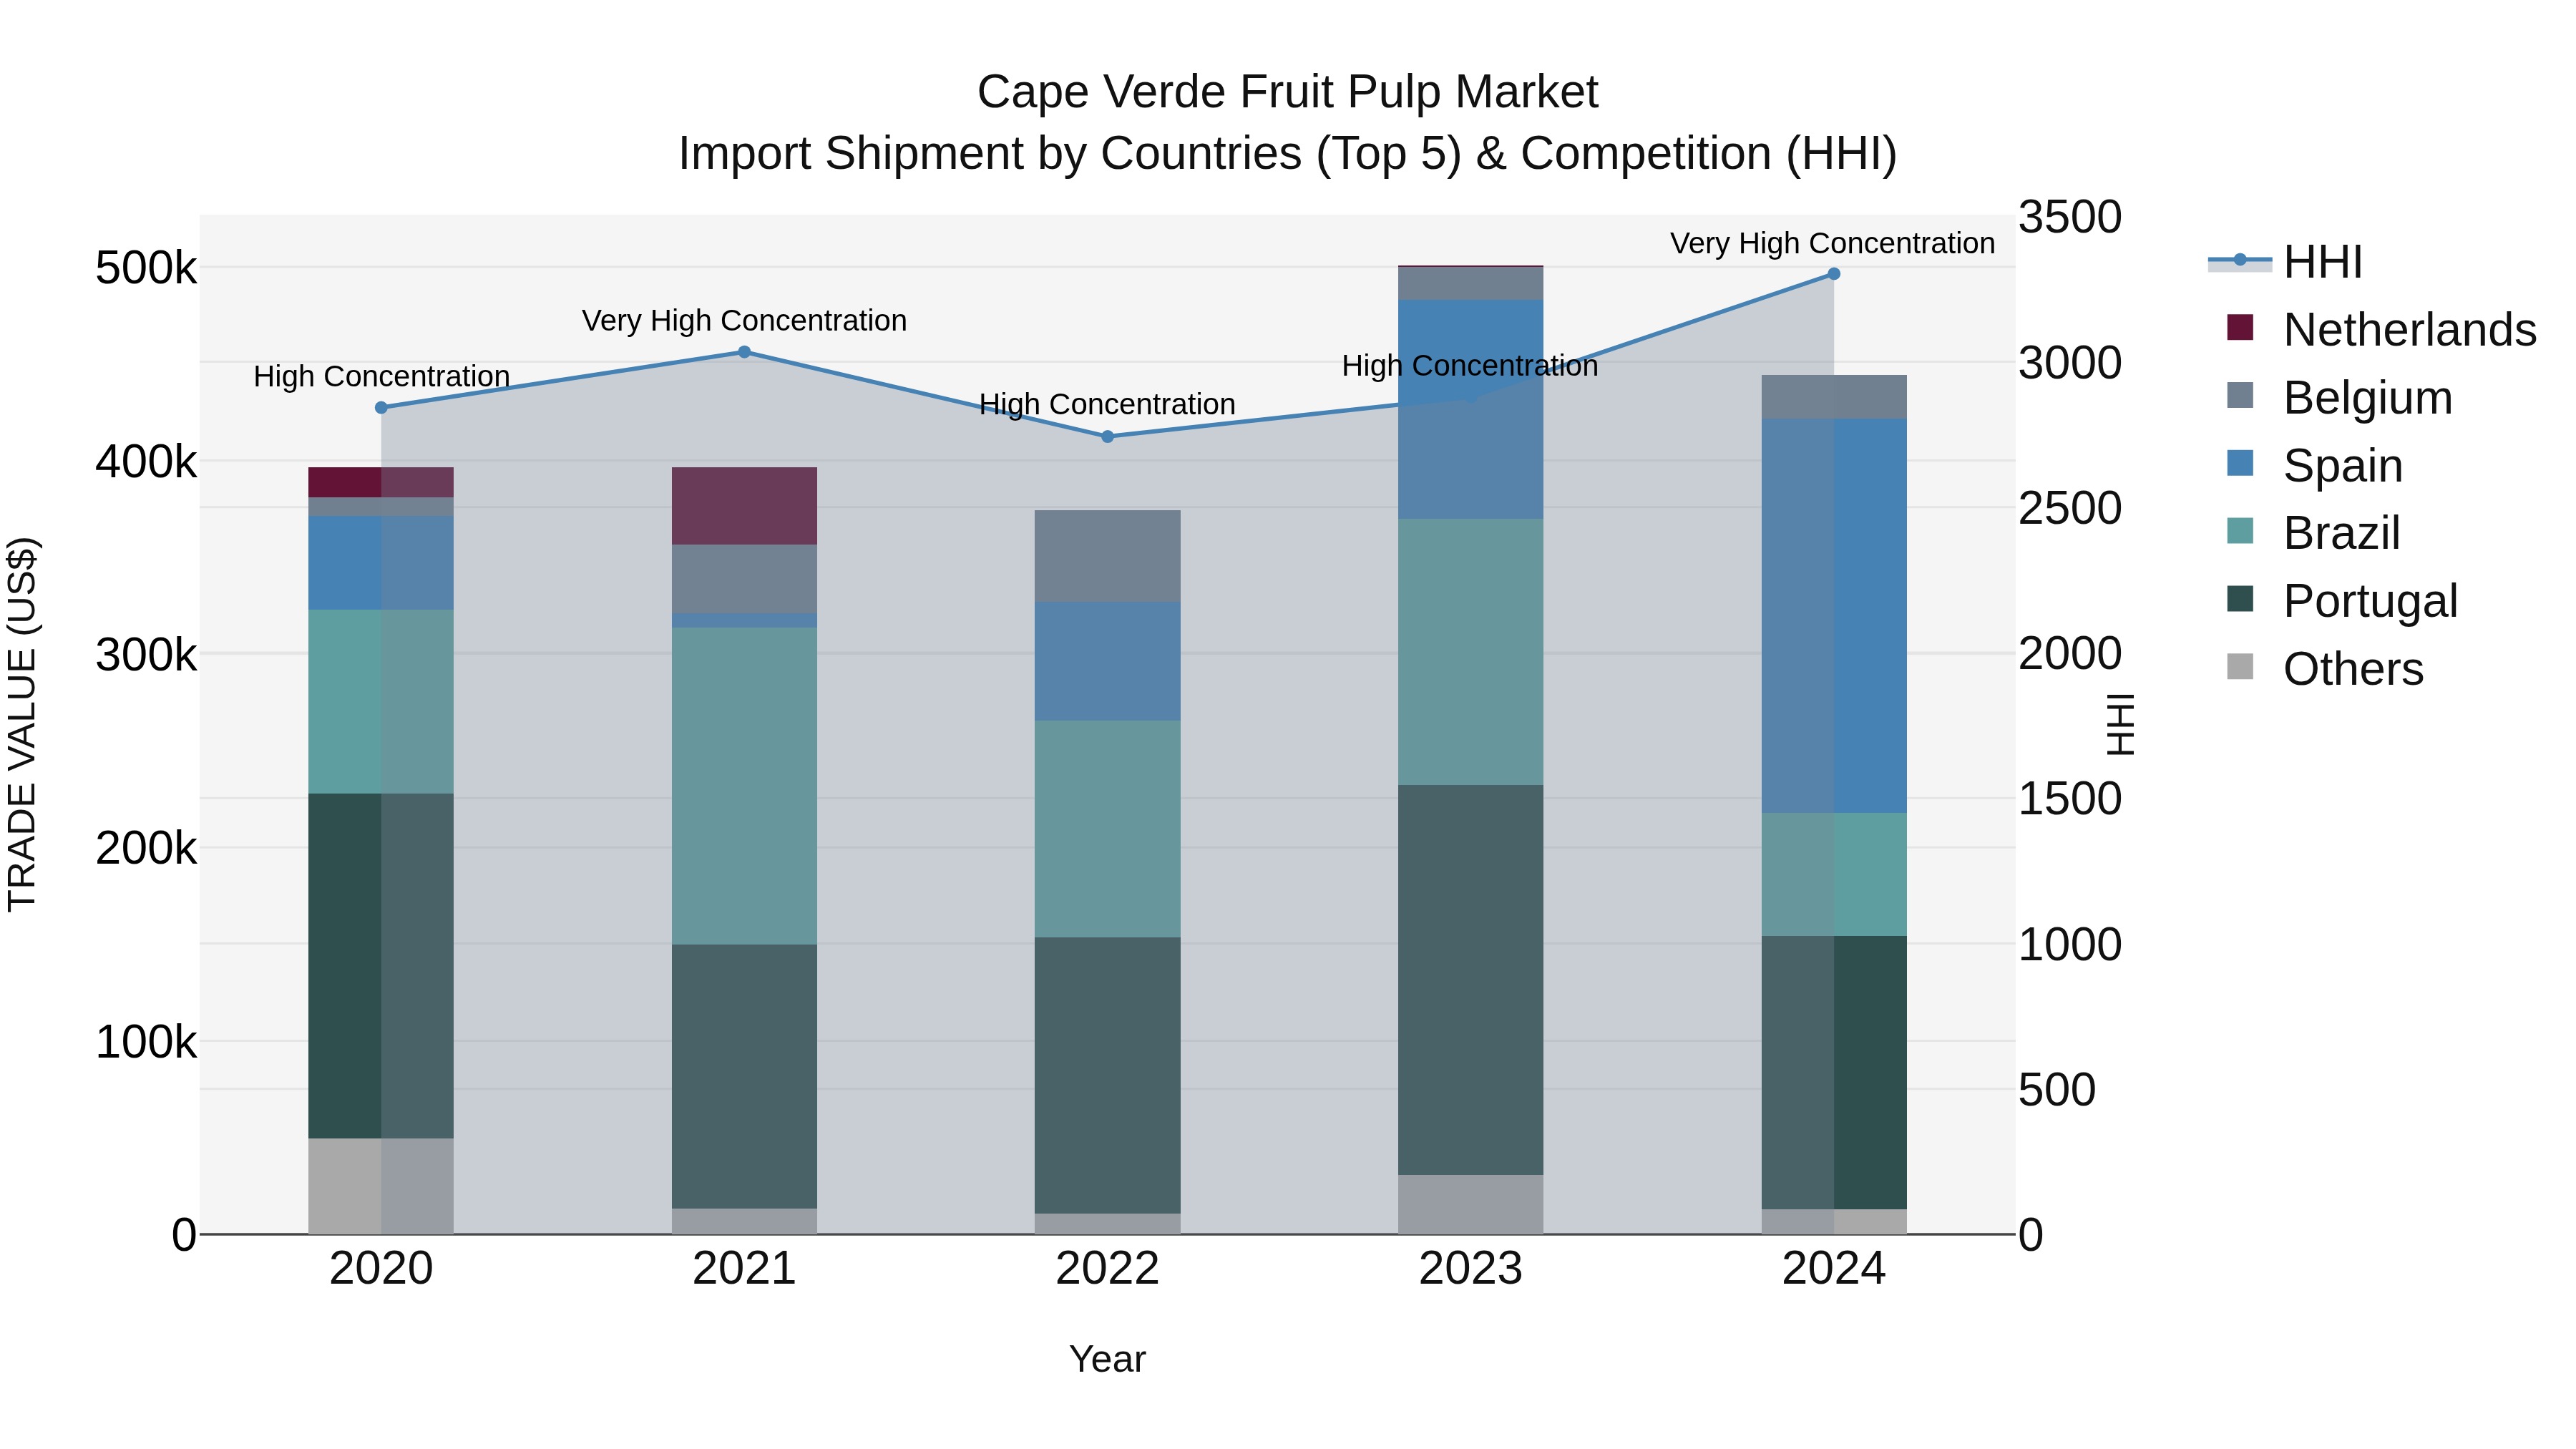
Cape Verde Fruit Pulp Market: Top 5 Importing Countries and Market Competition (HHI) Analysis
Cape Verde`s fruit pulp import market in 2024 is dominated by top exporters Spain, Portugal, Brazil, Belgium, and Italy. The market concentration, as measured by the HHI, has significantly increased from 2023 to 2024, indicating a high level of dominance by these key exporting countries. Despite a negative growth rate in 2024 compared to the previous year, the compound annual growth rate (CAGR) from 2020 to 2024 remains positive at 2.86%, showcasing steady expansion in the fruit pulp import market in Cape Verde over the past few years.
Cape Verde Fruit Pulp Market Overview
The fruit pulp market in Cape Verde is expanding as the demand for fruit-based products such as juices, sauces, and purees rises. Fruit pulp is a key ingredient in the food and beverage industry, offering convenience and flavor. The market is driven by growing consumer preference for natural and healthy products, though it faces challenges related to seasonal fruit availability and production costs.
Drivers of the market
The Cape Verde fruit pulp market benefits from the rising demand for natural and healthy food ingredients in beverages, dairy products, and baked goods. Fruit pulp is used to enhance the flavor and nutritional value of various food products. The growth of the food and beverage industry in Cape Verde, along with increasing consumer preference for natural ingredients, drives the demand for fruit pulp.
Challenges of the market
The Cape Verde Fruit Pulp market faces challenges such as limited local production and high import dependence. Cape Verde has a relatively small agricultural sector, which limits the availability of locally produced fruit pulp. This leads to a reliance on imports, increasing costs and vulnerability to supply chain disruptions. Additionally, the market may experience challenges related to quality control and maintaining consistency in fruit pulp products.
Government Policy of the market
There are no specific policies for the fruit pulp market in Cape Verde. However, general food safety regulations apply to fruit pulp production and distribution. The government ensures that fruit pulp products meet safety standards, are properly labeled, and comply with hygiene regulations to protect consumers.
Key Highlights of the Report:
- Cape Verde Fruit Pulp Market Outlook
- Market Size of Cape Verde Fruit Pulp Market, 2024
- Forecast of Cape Verde Fruit Pulp Market, 2031
- Historical Data and Forecast of Cape Verde Fruit Pulp Revenues & Volume for the Period 2021-2031
- Cape Verde Fruit Pulp Market Trend Evolution
- Cape Verde Fruit Pulp Market Drivers and Challenges
- Cape Verde Fruit Pulp Price Trends
- Cape Verde Fruit Pulp Porter`s Five Forces
- Cape Verde Fruit Pulp Industry Life Cycle
- Historical Data and Forecast of Cape Verde Fruit Pulp Market Revenues & Volume By Fruit Type for the Period 2021-2031
- Historical Data and Forecast of Cape Verde Fruit Pulp Market Revenues & Volume By Mango for the Period 2021-2031
- Historical Data and Forecast of Cape Verde Fruit Pulp Market Revenues & Volume By Strawberry for the Period 2021-2031
- Historical Data and Forecast of Cape Verde Fruit Pulp Market Revenues & Volume By Apple for the Period 2021-2031
- Historical Data and Forecast of Cape Verde Fruit Pulp Market Revenues & Volume By Guava for the Period 2021-2031
- Historical Data and Forecast of Cape Verde Fruit Pulp Market Revenues & Volume By Berries for the Period 2021-2031
- Historical Data and Forecast of Cape Verde Fruit Pulp Market Revenues & Volume By Citrus Fruits for the Period 2021-2031
- Historical Data and Forecast of Cape Verde Fruit Pulp Market Revenues & Volume By Others for the Period 2021-2031
- Historical Data and Forecast of Cape Verde Fruit Pulp Market Revenues & Volume By Form for the Period 2021-2031
- Historical Data and Forecast of Cape Verde Fruit Pulp Market Revenues & Volume By Liquid for the Period 2021-2031
- Historical Data and Forecast of Cape Verde Fruit Pulp Market Revenues & Volume By Powder for the Period 2021-2031
- Historical Data and Forecast of Cape Verde Fruit Pulp Market Revenues & Volume By Application for the Period 2021-2031
- Historical Data and Forecast of Cape Verde Fruit Pulp Market Revenues & Volume By Food and Beverages for the Period 2021-2031
- Historical Data and Forecast of Cape Verde Fruit Pulp Market Revenues & Volume By Distribution for the Period 2021-2031
- Historical Data and Forecast of Cape Verde Fruit Pulp Market Revenues & Volume By E-Commerce for the Period 2021-2031
- Historical Data and Forecast of Cape Verde Fruit Pulp Market Revenues & Volume By Convenience Stores for the Period 2021-2031
- Historical Data and Forecast of Cape Verde Fruit Pulp Market Revenues & Volume By Supermarkets/Hypermarkets for the Period 2021-2031
- Historical Data and Forecast of Cape Verde Fruit Pulp Market Revenues & Volume By Specialty Stores for the Period 2021-2031
- Historical Data and Forecast of Cape Verde Fruit Pulp Market Revenues & Volume By Others for the Period 2021-2031
- Cape Verde Fruit Pulp Import Export Trade Statistics
- Market Opportunity Assessment By Fruit Type
- Market Opportunity Assessment By Form
- Market Opportunity Assessment By Application
- Market Opportunity Assessment By Distribution
- Cape Verde Fruit Pulp Top Companies Market Share
- Cape Verde Fruit Pulp Competitive Benchmarking By Technical and Operational Parameters
- Cape Verde Fruit Pulp Company Profiles
- Cape Verde Fruit Pulp Key Strategic Recommendations
Frequently Asked Questions About the Market Study (FAQs):
6Wresearch actively monitors the Cape Verde Fruit Pulp Market and publishes its comprehensive annual report, highlighting emerging trends, growth drivers, revenue analysis, and forecast outlook. Our insights help businesses to make data-backed strategic decisions with ongoing market dynamics. Our analysts track relevent industries related to the Cape Verde Fruit Pulp Market, allowing our clients with actionable intelligence and reliable forecasts tailored to emerging regional needs.
Yes, we provide customisation as per your requirements. To learn more, feel free to contact us on sales@6wresearch.com
1 Executive Summary |
2 Introduction |
2.1 Key Highlights of the Report |
2.2 Report Description |
2.3 Market Scope & Segmentation |
2.4 Research Methodology |
2.5 Assumptions |
3 Cape Verde Fruit Pulp Market Overview |
3.1 Cape Verde Country Macro Economic Indicators |
3.2 Cape Verde Fruit Pulp Market Revenues & Volume, 2021 & 2031F |
3.3 Cape Verde Fruit Pulp Market - Industry Life Cycle |
3.4 Cape Verde Fruit Pulp Market - Porter's Five Forces |
3.5 Cape Verde Fruit Pulp Market Revenues & Volume Share, By Fruit Type, 2021 & 2031F |
3.6 Cape Verde Fruit Pulp Market Revenues & Volume Share, By Form, 2021 & 2031F |
3.7 Cape Verde Fruit Pulp Market Revenues & Volume Share, By Application, 2021 & 2031F |
3.8 Cape Verde Fruit Pulp Market Revenues & Volume Share, By Distribution, 2021 & 2031F |
4 Cape Verde Fruit Pulp Market Dynamics |
4.1 Impact Analysis |
4.2 Market Drivers |
4.3 Market Restraints |
5 Cape Verde Fruit Pulp Market Trends |
6 Cape Verde Fruit Pulp Market Segmentations |
6.1 Cape Verde Fruit Pulp Market, By Fruit Type |
6.1.1 Overview and Analysis |
6.1.2 Cape Verde Fruit Pulp Market Revenues & Volume, By Mango, 2021-2031F |
6.1.3 Cape Verde Fruit Pulp Market Revenues & Volume, By Strawberry, 2021-2031F |
6.1.4 Cape Verde Fruit Pulp Market Revenues & Volume, By Apple, 2021-2031F |
6.1.5 Cape Verde Fruit Pulp Market Revenues & Volume, By Guava, 2021-2031F |
6.1.6 Cape Verde Fruit Pulp Market Revenues & Volume, By Berries, 2021-2031F |
6.1.7 Cape Verde Fruit Pulp Market Revenues & Volume, By Citrus Fruits, 2021-2031F |
6.2 Cape Verde Fruit Pulp Market, By Form |
6.2.1 Overview and Analysis |
6.2.2 Cape Verde Fruit Pulp Market Revenues & Volume, By Liquid, 2021-2031F |
6.2.3 Cape Verde Fruit Pulp Market Revenues & Volume, By Powder, 2021-2031F |
6.3 Cape Verde Fruit Pulp Market, By Application |
6.3.1 Overview and Analysis |
6.3.2 Cape Verde Fruit Pulp Market Revenues & Volume, By Food and Beverages, 2021-2031F |
6.4 Cape Verde Fruit Pulp Market, By Distribution |
6.4.1 Overview and Analysis |
6.4.2 Cape Verde Fruit Pulp Market Revenues & Volume, By E-Commerce, 2021-2031F |
6.4.3 Cape Verde Fruit Pulp Market Revenues & Volume, By Convenience Stores, 2021-2031F |
6.4.4 Cape Verde Fruit Pulp Market Revenues & Volume, By Supermarkets/Hypermarkets, 2021-2031F |
6.4.5 Cape Verde Fruit Pulp Market Revenues & Volume, By Specialty Stores, 2021-2031F |
6.4.6 Cape Verde Fruit Pulp Market Revenues & Volume, By Others, 2021-2031F |
7 Cape Verde Fruit Pulp Market Import-Export Trade Statistics |
7.1 Cape Verde Fruit Pulp Market Export to Major Countries |
7.2 Cape Verde Fruit Pulp Market Imports from Major Countries |
8 Cape Verde Fruit Pulp Market Key Performance Indicators |
9 Cape Verde Fruit Pulp Market - Opportunity Assessment |
9.1 Cape Verde Fruit Pulp Market Opportunity Assessment, By Fruit Type, 2021 & 2031F |
9.2 Cape Verde Fruit Pulp Market Opportunity Assessment, By Form, 2021 & 2031F |
9.3 Cape Verde Fruit Pulp Market Opportunity Assessment, By Application, 2021 & 2031F |
9.4 Cape Verde Fruit Pulp Market Opportunity Assessment, By Distribution, 2021 & 2031F |
10 Cape Verde Fruit Pulp Market - Competitive Landscape |
10.1 Cape Verde Fruit Pulp Market Revenue Share, By Companies, 2024 |
10.2 Cape Verde Fruit Pulp Market Competitive Benchmarking, By Operating and Technical Parameters |
11 Company Profiles |
12 Recommendations | 13 Disclaimer |
Export potential assessment - trade Analytics for 2030
Export potential enables firms to identify high-growth global markets with greater confidence by combining advanced trade intelligence with a structured quantitative methodology. The framework analyzes emerging demand trends and country-level import patterns while integrating macroeconomic and trade datasets such as GDP and population forecasts, bilateral import–export flows, tariff structures, elasticity differentials between developed and developing economies, geographic distance, and import demand projections. Using weighted trade values from 2020–2024 as the base period to project country-to-country export potential for 2030, these inputs are operationalized through calculated drivers such as gravity model parameters, tariff impact factors, and projected GDP per-capita growth. Through an analysis of hidden potentials, demand hotspots, and market conditions that are most favorable to success, this method enables firms to focus on target countries, maximize returns, and global expansion with data, backed by accuracy.
By factoring in the projected importer demand gap that is currently unmet and could be potential opportunity, it identifies the potential for the Exporter (Country) among 190 countries, against the general trade analysis, which identifies the biggest importer or exporter.
To discover high-growth global markets and optimize your business strategy:
Click Here
Pricing
- Single User License$ 1,995
- Department License$ 2,400
- Site License$ 3,120
- Global License$ 3,795

Search
Thought Leadership and Analyst Meet


Our Clients
Latest Reports
- Philippines Polyhydroxybutyrate-co-Hydroxyvalerate Market (2026-2032) | Trends, Insights, Challenges, Restraints, Competition, Size, Value, Forecast, Pricing, Share, Outlook, Revenue, Investment Opportunities, Strategy, Drivers, Demand, Growth, segmentation, Analysis, Companies
- Peru Polyhydroxybutyrate-co-Hydroxyvalerate Market (2026-2032) | Growth, Demand, Challenges, Share, Trends, Analysis, Pricing, Investment Opportunities, Drivers, Value, Forecast, Competition, Size, Companies, Insights, Outlook, Restraints, segmentation, Revenue, Strategy
- Pakistan Polyhydroxybutyrate-co-Hydroxyvalerate Market (2026-2032) | Restraints, segmentation, Pricing, Forecast, Share, Strategy, Competition, Trends, Insights, Drivers, Challenges, Growth, Revenue, Outlook, Value, Investment Opportunities, Companies, Size, Analysis, Demand
- Oman Polyhydroxybutyrate-co-Hydroxyvalerate Market (2026-2032) | Drivers, segmentation, Insights, Competition, Pricing, Outlook, Size, Revenue, Challenges, Forecast, Analysis, Growth, Value, Share, Trends, Investment Opportunities, Strategy, Restraints, Companies, Demand
- Nigeria Polyhydroxybutyrate-co-Hydroxyvalerate Market (2026-2032) | Value, Investment Opportunities, Analysis, Revenue, Restraints, Pricing, Outlook, Competition, Demand, Growth, Forecast, Companies, Trends, Challenges, segmentation, Drivers, Insights, Share, Size, Strategy
- Nepal Polyhydroxybutyrate-co-Hydroxyvalerate Market (2026-2032) | Insights, Analysis, Drivers, Share, Revenue, Demand, segmentation, Investment Opportunities, Competition, Forecast, Growth, Pricing, Companies, Strategy, Trends, Restraints, Challenges, Outlook, Size, Value
- Myanmar Polyhydroxybutyrate-co-Hydroxyvalerate Market (2026-2032) | Outlook, Revenue, Strategy, Restraints, Drivers, segmentation, Share, Forecast, Competition, Insights, Growth, Pricing, Size, Demand, Value, Companies, Trends, Challenges, Investment Opportunities, Analysis
- Morocco Polyhydroxybutyrate-co-Hydroxyvalerate Market (2026-2032) | Outlook, Investment Opportunities, Restraints, Strategy, Forecast, Challenges, Drivers, Growth, Companies, segmentation, Trends, Size, Competition, Revenue, Demand, Insights, Share, Analysis, Value, Pricing
- Mexico Polyhydroxybutyrate-co-Hydroxyvalerate Market (2026-2032) | Size, Drivers, Outlook, Share, Strategy, Growth, Pricing, Challenges, Companies, Demand, Value, Investment Opportunities, Restraints, Trends, Forecast, segmentation, Analysis, Insights, Competition, Revenue
- Malaysia Polyhydroxybutyrate-co-Hydroxyvalerate Market (2026-2032) | Share, segmentation, Size, Companies, Analysis, Insights, Forecast, Value, Revenue, Drivers, Restraints, Challenges, Investment Opportunities, Trends, Competition, Strategy, Demand, Growth, Outlook, Pricing
Industry Events and Analyst Meet

HIMTEX 2026

India Refining Summit 2026

India EV Show 2026

EV tech India Expo 2026

Auto Tech Asia 2026
Whitepaper
- Middle East & Africa Commercial Security Market Click here to view more.
- Middle East & Africa Fire Safety Systems & Equipment Market Click here to view more.
- GCC Drone Market Click here to view more.
- Middle East Lighting Fixture Market Click here to view more.
- GCC Physical & Perimeter Security Market Click here to view more.
6WResearch In News
- Doha a strategic location for EV manufacturing hub: IPA Qatar
- Demand for luxury TVs surging in the GCC, says Samsung
- Empowering Growth: The Thriving Journey of Bangladesh’s Cable Industry
- Demand for luxury TVs surging in the GCC, says Samsung
- Video call with a traditional healer? Once unthinkable, it’s now common in South Africa
- Intelligent Buildings To Smooth GCC’s Path To Net Zero