Cape Verde Gin Market (2025-2031) | Outlook, Companies, Revenue, Industry, Forecast, Share, Growth, Segmentation, Trends, Value, Analysis & Size
Market Forecast By Product Type (London Dry Gin, Plymouth Gin, Genever/Dutch Gin, Old Tim Gin, New American Gin), By Production Method (Pot Distilled Gin, Column Distilled Gin, Compound Gin), By Distribution Channel (Hypermarkets and Supermarkets, Specialty Stores, Drug Stores, Online Channel, HoReCa, Others) And Competitive Landscape
| Product Code: ETC4673237 | Publication Date: Nov 2023 | Updated Date: Nov 2025 | Product Type: Market Research Report | |
| Publisher: 6Wresearch | Author: Shubham Deep | No. of Pages: 60 | No. of Figures: 30 | No. of Tables: 5 |
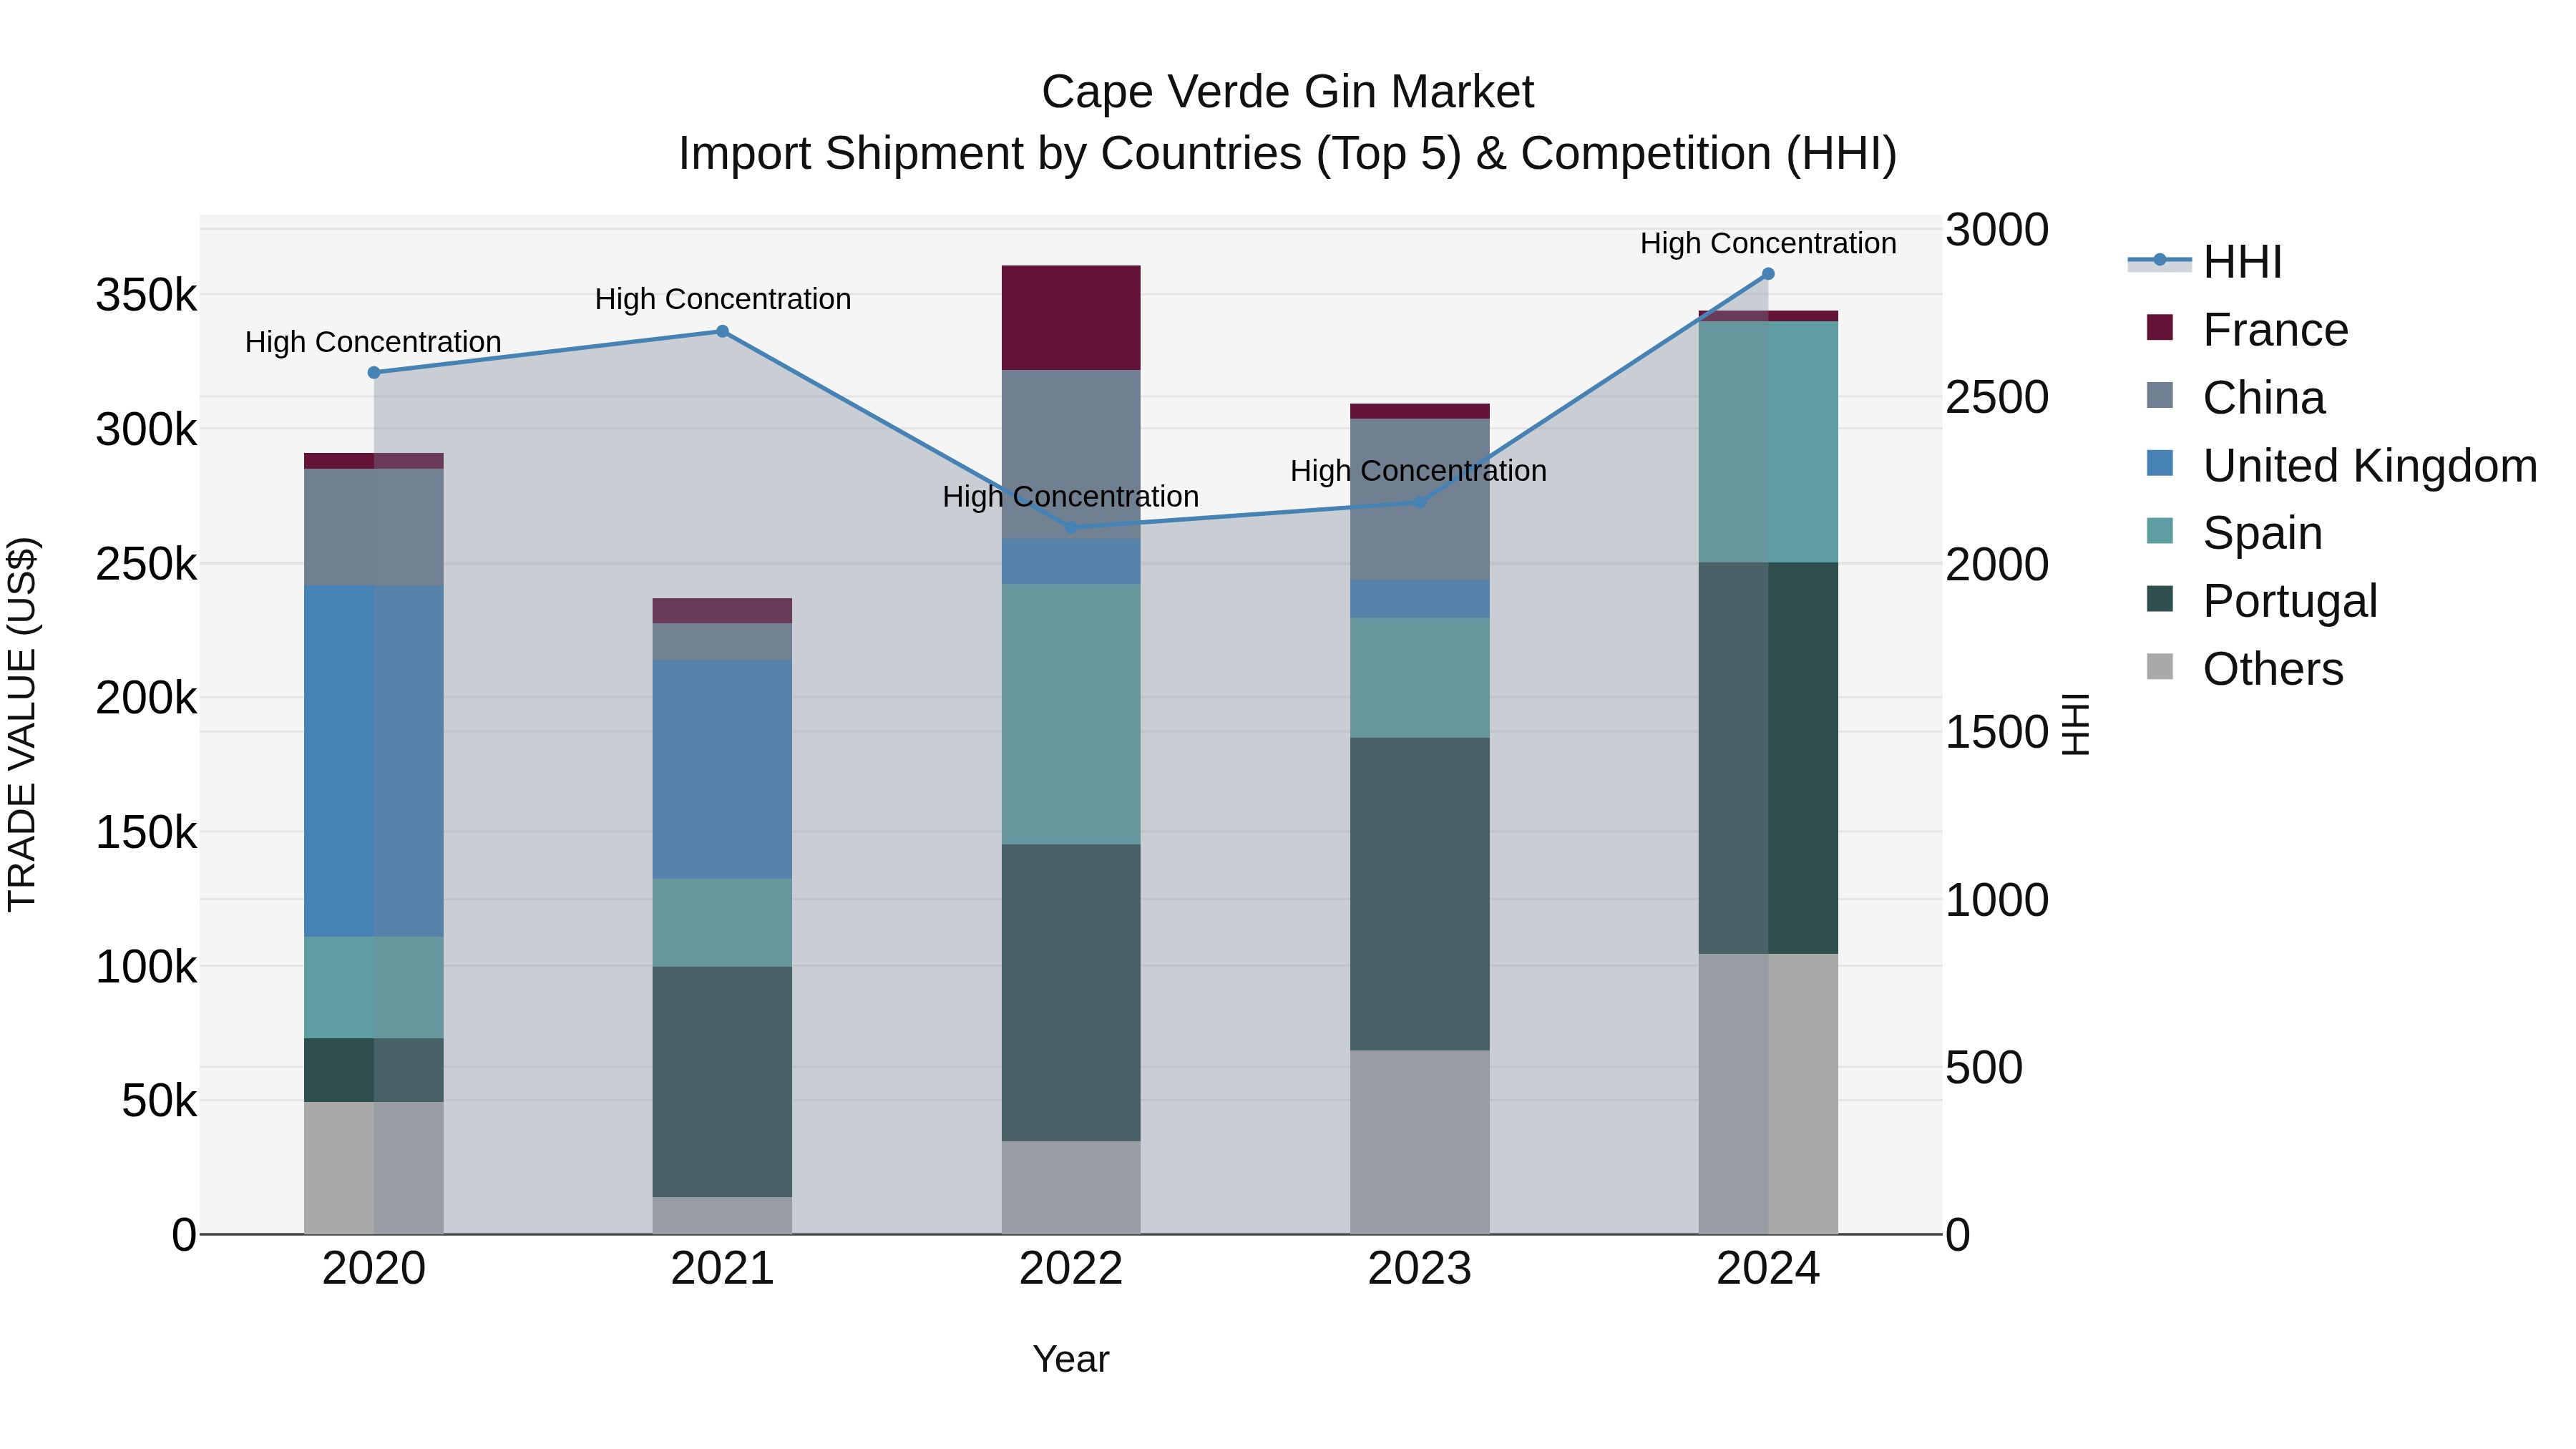
Cape Verde Gin Market: Top 5 Importing Countries and Market Competition (HHI) Analysis
In 2024, Cape Verde saw a steady increase in gin import shipments, with top exporting countries including Portugal, Spain, Senegal, Angola, and France. The high Herfindahl-Hirschman Index (HHI) reflects a concentrated market, while the Compound Annual Growth Rate (CAGR) from 2020 to 2024 stood at 4.26%, indicating sustained growth. Notably, the growth rate spiked in 2024 by 11.12%, showcasing a burgeoning demand for gin in Cape Verde. This data suggests a promising market for gin imports in the country, with key players from various countries contributing to its growth.
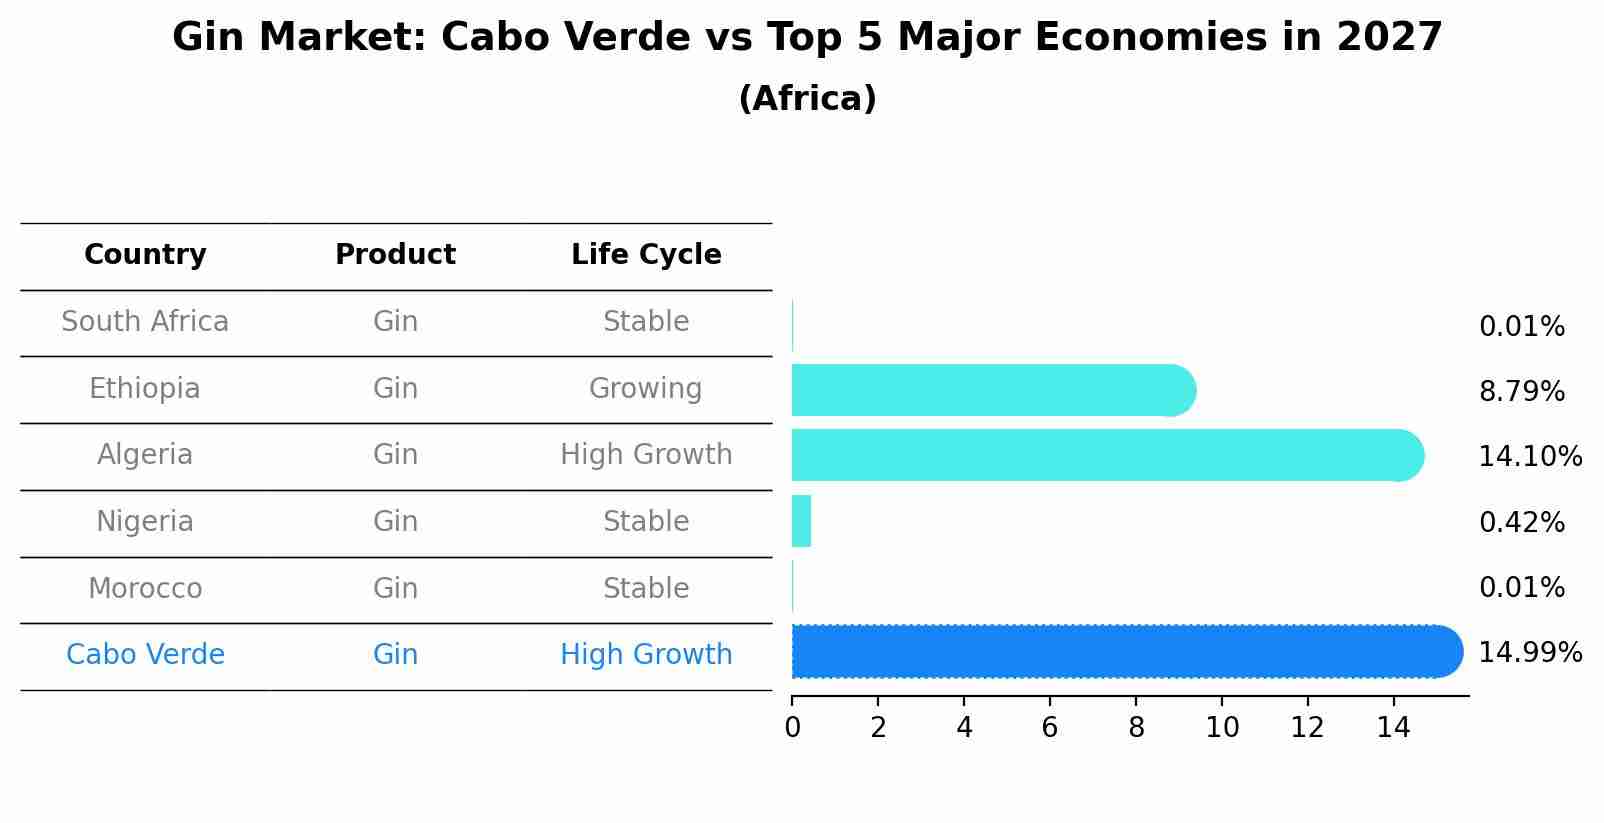
Gin Market: Cabo Verde vs Top 5 Major Economies in 2027 (Africa)
The Gin market in Cabo Verde is projected to grow at a high growth rate of 14.99% by 2027, within the Africa region led by South Africa, along with other countries like Ethiopia, Algeria, Nigeria and Morocco, collectively shaping a dynamic and evolving market environment driven by innovation and increasing adoption of emerging technologies.
Cape Verde Gin Market Overview
The gin market in Cape Verde is experiencing growth as the countrys beverage industry diversifies. Gin, with its distinctive flavors and versatility, is gaining popularity among consumers seeking premium and craft spirits. The market is driven by changing consumer preferences and a growing bar and restaurant culture. Challenges include competition from other alcoholic beverages and the need for effective distribution channels.
Drivers of the market
The Cape Verde gin market benefits from the growing trend of premium and craft spirits. Gin, with its diverse flavor profiles and versatility in cocktails, is gaining popularity among consumers. The increase in disposable incomes and the rise in social and leisure activities contribute to the demand for gin. Additionally, the expansion of the nightlife and hospitality sectors in Cape Verde supports market growth.
Challenges of the market
The Cape Verde gin market encounters challenges related to import regulations and high costs. The importation of gin involves navigating complex regulations and incurring high transportation costs. Additionally, local production of gin is limited, which further exacerbates the market`s reliance on imported products.
Government Policy of the market
Government policies affecting the gin market in Cape Verde include regulations on alcoholic beverage production and distribution. The government enforces standards for quality and labeling, ensuring consumer safety. Additionally, there are policies that support the growth of the local spirits industry through tax incentives and grants for distilleries. These measures are designed to boost the local gin market while ensuring compliance with national and international standards.
Key Highlights of the Report:
- Cape Verde Gin Market Outlook
- Market Size of Cape Verde Gin Market, 2024
- Forecast of Cape Verde Gin Market, 2031
- Historical Data and Forecast of Cape Verde Gin Revenues & Volume for the Period 2021-2031
- Cape Verde Gin Market Trend Evolution
- Cape Verde Gin Market Drivers and Challenges
- Cape Verde Gin Price Trends
- Cape Verde Gin Porter`s Five Forces
- Cape Verde Gin Industry Life Cycle
- Historical Data and Forecast of Cape Verde Gin Market Revenues & Volume By Product Type for the Period 2021-2031
- Historical Data and Forecast of Cape Verde Gin Market Revenues & Volume By London Dry Gin for the Period 2021-2031
- Historical Data and Forecast of Cape Verde Gin Market Revenues & Volume By Plymouth Gin for the Period 2021-2031
- Historical Data and Forecast of Cape Verde Gin Market Revenues & Volume By Genever/Dutch Gin for the Period 2021-2031
- Historical Data and Forecast of Cape Verde Gin Market Revenues & Volume By Old Tim Gin for the Period 2021-2031
- Historical Data and Forecast of Cape Verde Gin Market Revenues & Volume By New American Gin for the Period 2021-2031
- Historical Data and Forecast of Cape Verde Gin Market Revenues & Volume By Production Method for the Period 2021-2031
- Historical Data and Forecast of Cape Verde Gin Market Revenues & Volume By Pot Distilled Gin for the Period 2021-2031
- Historical Data and Forecast of Cape Verde Gin Market Revenues & Volume By Column Distilled Gin for the Period 2021-2031
- Historical Data and Forecast of Cape Verde Gin Market Revenues & Volume By Compound Gin for the Period 2021-2031
- Historical Data and Forecast of Cape Verde Gin Market Revenues & Volume By Distribution Channel for the Period 2021-2031
- Historical Data and Forecast of Cape Verde Gin Market Revenues & Volume By Hypermarkets and Supermarkets for the Period 2021-2031
- Historical Data and Forecast of Cape Verde Gin Market Revenues & Volume By Specialty Stores for the Period 2021-2031
- Historical Data and Forecast of Cape Verde Gin Market Revenues & Volume By Drug Stores for the Period 2021-2031
- Historical Data and Forecast of Cape Verde Gin Market Revenues & Volume By Online Channel for the Period 2021-2031
- Historical Data and Forecast of Cape Verde Gin Market Revenues & Volume By HoReCa for the Period 2021-2031
- Historical Data and Forecast of Cape Verde Gin Market Revenues & Volume By Others for the Period 2021-2031
- Cape Verde Gin Import Export Trade Statistics
- Market Opportunity Assessment By Product Type
- Market Opportunity Assessment By Production Method
- Market Opportunity Assessment By Distribution Channel
- Cape Verde Gin Top Companies Market Share
- Cape Verde Gin Competitive Benchmarking By Technical and Operational Parameters
- Cape Verde Gin Company Profiles
- Cape Verde Gin Key Strategic Recommendations
Frequently Asked Questions About the Market Study (FAQs):
6Wresearch actively monitors the Cape Verde Gin Market and publishes its comprehensive annual report, highlighting emerging trends, growth drivers, revenue analysis, and forecast outlook. Our insights help businesses to make data-backed strategic decisions with ongoing market dynamics. Our analysts track relevent industries related to the Cape Verde Gin Market, allowing our clients with actionable intelligence and reliable forecasts tailored to emerging regional needs.
Yes, we provide customisation as per your requirements. To learn more, feel free to contact us on sales@6wresearch.com
1 Executive Summary |
2 Introduction |
2.1 Key Highlights of the Report |
2.2 Report Description |
2.3 Market Scope & Segmentation |
2.4 Research Methodology |
2.5 Assumptions |
3 Cape Verde Gin Market Overview |
3.1 Cape Verde Country Macro Economic Indicators |
3.2 Cape Verde Gin Market Revenues & Volume, 2021 & 2031F |
3.3 Cape Verde Gin Market - Industry Life Cycle |
3.4 Cape Verde Gin Market - Porter's Five Forces |
3.5 Cape Verde Gin Market Revenues & Volume Share, By Product Type, 2021 & 2031F |
3.6 Cape Verde Gin Market Revenues & Volume Share, By Production Method, 2021 & 2031F |
3.7 Cape Verde Gin Market Revenues & Volume Share, By Distribution Channel, 2021 & 2031F |
4 Cape Verde Gin Market Dynamics |
4.1 Impact Analysis |
4.2 Market Drivers |
4.3 Market Restraints |
5 Cape Verde Gin Market Trends |
6 Cape Verde Gin Market Segmentations |
6.1 Cape Verde Gin Market, By Product Type |
6.1.1 Overview and Analysis |
6.1.2 Cape Verde Gin Market Revenues & Volume, By London Dry Gin, 2021-2031F |
6.1.3 Cape Verde Gin Market Revenues & Volume, By Plymouth Gin, 2021-2031F |
6.1.4 Cape Verde Gin Market Revenues & Volume, By Genever/Dutch Gin, 2021-2031F |
6.1.5 Cape Verde Gin Market Revenues & Volume, By Old Tim Gin, 2021-2031F |
6.1.6 Cape Verde Gin Market Revenues & Volume, By New American Gin, 2021-2031F |
6.2 Cape Verde Gin Market, By Production Method |
6.2.1 Overview and Analysis |
6.2.2 Cape Verde Gin Market Revenues & Volume, By Pot Distilled Gin, 2021-2031F |
6.2.3 Cape Verde Gin Market Revenues & Volume, By Column Distilled Gin, 2021-2031F |
6.2.4 Cape Verde Gin Market Revenues & Volume, By Compound Gin, 2021-2031F |
6.3 Cape Verde Gin Market, By Distribution Channel |
6.3.1 Overview and Analysis |
6.3.2 Cape Verde Gin Market Revenues & Volume, By Hypermarkets and Supermarkets, 2021-2031F |
6.3.3 Cape Verde Gin Market Revenues & Volume, By Specialty Stores, 2021-2031F |
6.3.4 Cape Verde Gin Market Revenues & Volume, By Drug Stores, 2021-2031F |
6.3.5 Cape Verde Gin Market Revenues & Volume, By Online Channel, 2021-2031F |
6.3.6 Cape Verde Gin Market Revenues & Volume, By HoReCa, 2021-2031F |
6.3.7 Cape Verde Gin Market Revenues & Volume, By Others, 2021-2031F |
7 Cape Verde Gin Market Import-Export Trade Statistics |
7.1 Cape Verde Gin Market Export to Major Countries |
7.2 Cape Verde Gin Market Imports from Major Countries |
8 Cape Verde Gin Market Key Performance Indicators |
9 Cape Verde Gin Market - Opportunity Assessment |
9.1 Cape Verde Gin Market Opportunity Assessment, By Product Type, 2021 & 2031F |
9.2 Cape Verde Gin Market Opportunity Assessment, By Production Method, 2021 & 2031F |
9.3 Cape Verde Gin Market Opportunity Assessment, By Distribution Channel, 2021 & 2031F |
10 Cape Verde Gin Market - Competitive Landscape |
10.1 Cape Verde Gin Market Revenue Share, By Companies, 2024 |
10.2 Cape Verde Gin Market Competitive Benchmarking, By Operating and Technical Parameters |
11 Company Profiles |
12 Recommendations | 13 Disclaimer |
Export potential assessment - trade Analytics for 2030
Export potential enables firms to identify high-growth global markets with greater confidence by combining advanced trade intelligence with a structured quantitative methodology. The framework analyzes emerging demand trends and country-level import patterns while integrating macroeconomic and trade datasets such as GDP and population forecasts, bilateral import–export flows, tariff structures, elasticity differentials between developed and developing economies, geographic distance, and import demand projections. Using weighted trade values from 2020–2024 as the base period to project country-to-country export potential for 2030, these inputs are operationalized through calculated drivers such as gravity model parameters, tariff impact factors, and projected GDP per-capita growth. Through an analysis of hidden potentials, demand hotspots, and market conditions that are most favorable to success, this method enables firms to focus on target countries, maximize returns, and global expansion with data, backed by accuracy.
By factoring in the projected importer demand gap that is currently unmet and could be potential opportunity, it identifies the potential for the Exporter (Country) among 190 countries, against the general trade analysis, which identifies the biggest importer or exporter.
To discover high-growth global markets and optimize your business strategy:
Click Here
Pricing
- Single User License$ 1,995
- Department License$ 2,400
- Site License$ 3,120
- Global License$ 3,795

Search
Thought Leadership and Analyst Meet


Our Clients
Related Reports
- Sri Lanka Packaging Market (2026-2032) | Outlook, Competition, Drivers, Trends, Demand, Pricing Analysis, Competitive, Strategic Insights, Companies, Challenges, Strategy, Consumer Insights, Analysis, Investment Trends, Opportunities, Growth, Size, Share, Industry, Revenue, Segments, Value, Segmentation, Supply, Forecast, Restraints
- India Kids Watches Market (2026-2032) | Strategy, Consumer Insights, Analysis, Investment Trends, Opportunities, Growth, Size, Share, Industry, Revenue, Segments, Value, Segmentation, Supply, Forecast, Restraints, Outlook, Competition, Drivers, Trends, Demand, Pricing Analysis, Competitive, Strategic Insights, Companies, Challenges
- Saudi Arabia Core Assurance Service Market (2025-2031) | Strategy, Consumer Insights, Analysis, Investment Trends, Opportunities, Growth, Size, Share, Industry, Revenue, Segments, Value, Segmentation, Supply, Forecast, Restraints, Outlook, Competition, Drivers, Trends, Demand, Pricing Analysis, Competitive, Strategic Insights, Companies, Challenges
- Romania Uninterruptible Power Supply (UPS) Market (2026-2032) | Industry, Analysis, Revenue, Size, Forecast, Outlook, Value, Trends, Share, Growth & Companies
- Saudi Arabia Car Window Tinting Film, Paint Protection Film (PPF), and Ceramic Coating Market (2025-2031) | Strategy, Consumer Insights, Analysis, Investment Trends, Opportunities, Growth, Size, Share, Industry, Revenue, Segments, Value, Segmentation, Supply, Forecast, Restraints, Outlook, Competition, Drivers, Trends, Demand, Pricing Analysis, Competitive, Strategic Insights, Companies, Challenges
- South Africa Stationery Market (2025-2031) | Share, Size, Industry, Value, Growth, Revenue, Analysis, Trends, Segmentation & Outlook
- Afghanistan Rocking Chairs And Adirondack Chairs Market (2026-2032) | Size & Revenue, Competitive Landscape, Share, Segmentation, Industry, Value, Outlook, Analysis, Trends, Growth, Forecast, Companies
- Afghanistan Apparel Market (2026-2032) | Growth, Outlook, Industry, Segmentation, Forecast, Size, Companies, Trends, Value, Share, Analysis & Revenue
- Canada Oil and Gas Market (2026-2032) | Share, Segmentation, Value, Industry, Trends, Forecast, Analysis, Size & Revenue, Growth, Competitive Landscape, Outlook, Companies
- Germany Breakfast Food Market (2026-2032) | Industry, Share, Growth, Size, Companies, Value, Analysis, Revenue, Trends, Forecast & Outlook
Industry Events and Analyst Meet

Smart Production Solutions Guangzhou 2026

Stationery & Paper Expo Saudi Arabia 2026

Kids & Toys Expo Saudi Arabia 2026

Gifts & Homeware Expo Saudi Arabia 2026

Smart Home Expo 2026
Whitepaper
- Middle East & Africa Commercial Security Market Click here to view more.
- Middle East & Africa Fire Safety Systems & Equipment Market Click here to view more.
- GCC Drone Market Click here to view more.
- Middle East Lighting Fixture Market Click here to view more.
- GCC Physical & Perimeter Security Market Click here to view more.
6WResearch In News
- Doha a strategic location for EV manufacturing hub: IPA Qatar
- Demand for luxury TVs surging in the GCC, says Samsung
- Empowering Growth: The Thriving Journey of Bangladesh’s Cable Industry
- Demand for luxury TVs surging in the GCC, says Samsung
- Video call with a traditional healer? Once unthinkable, it’s now common in South Africa
- Intelligent Buildings To Smooth GCC’s Path To Net Zero