Cape Verde Ink Market (2025-2031) | Segmentation, Industry, Analysis, Revenue, Share, Trends, Companies, Forecast, Value, Outlook, Size & Growth
Market Forecast By Technology (Lithographic , Flexographic , Gravure, Digital, Letterpress, Others), By Ink Type (Oil Based, Solvent Based, Water Based), By Applications (Label And Packaging, Commercial Printing, Publications, Others) And Competitive Landscape
| Product Code: ETC5098970 | Publication Date: Nov 2023 | Updated Date: Oct 2025 | Product Type: Market Research Report | |
| Publisher: 6Wresearch | Author: Sachin Kumar Rai | No. of Pages: 60 | No. of Figures: 30 | No. of Tables: 5 |
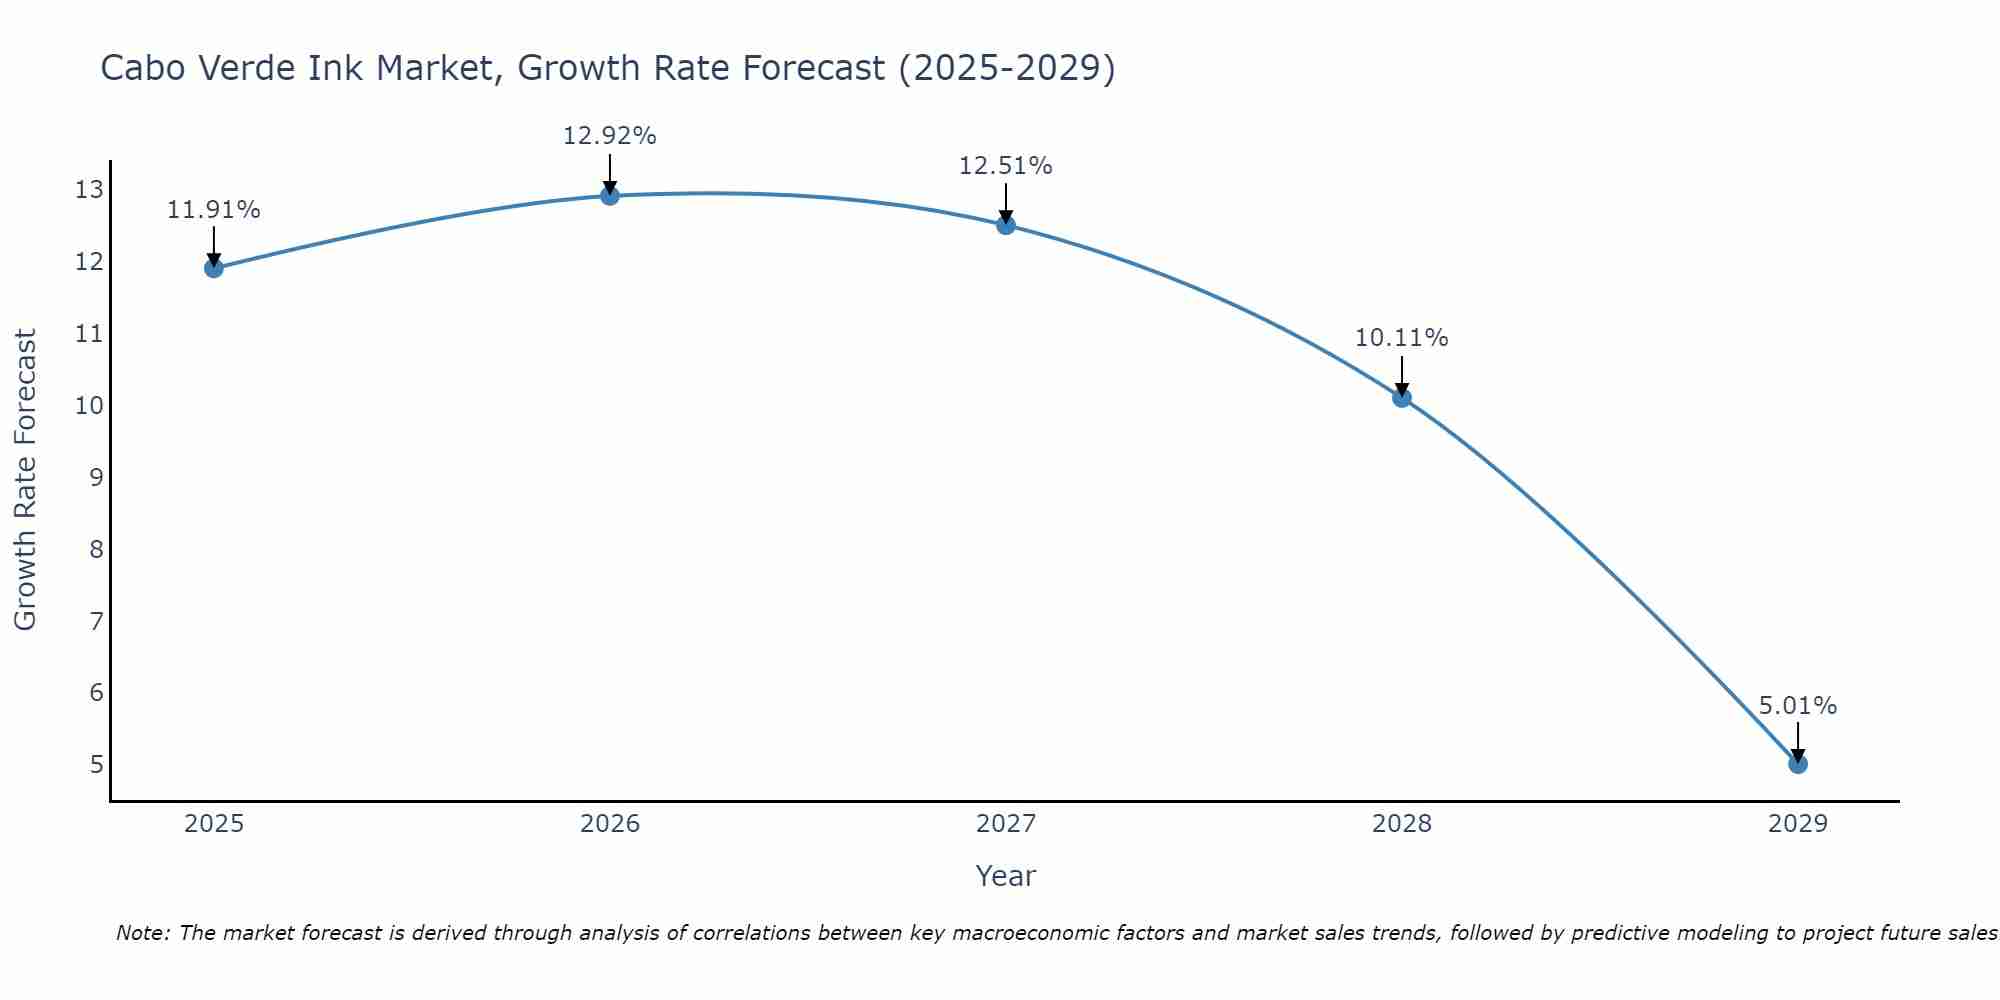
Cabo Verde Ink Market Size Growth Rate
The Cabo Verde Ink Market is projected to witness mixed growth rate patterns during 2025 to 2029. The growth rate begins at 11.91% in 2025, climbs to a high of 12.92% in 2026, and moderates to 5.01% by 2029.
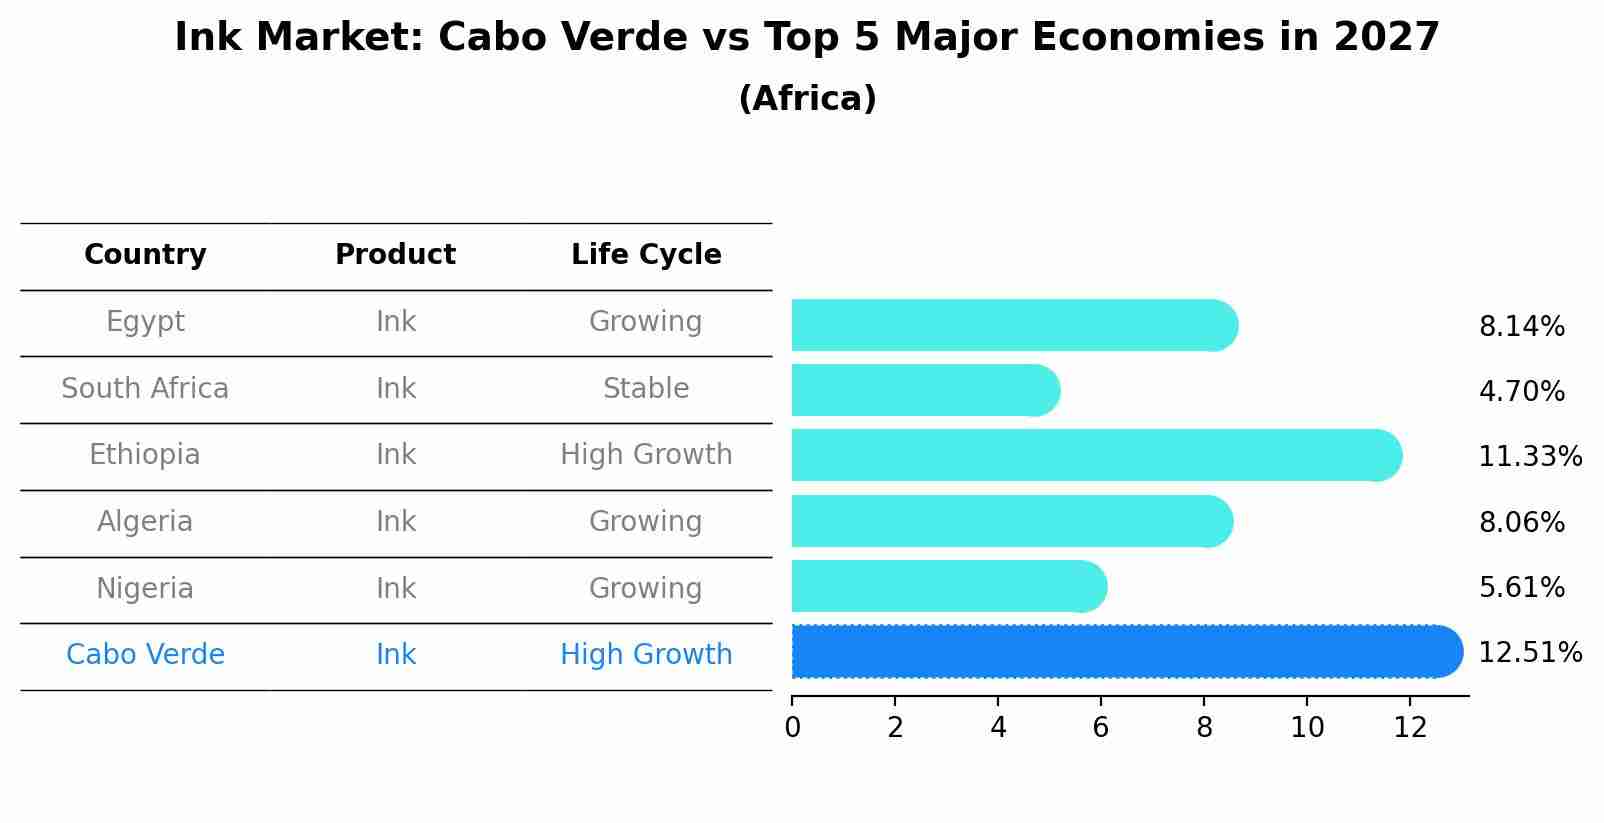
Ink Market: Cabo Verde vs Top 5 Major Economies in 2027 (Africa)
By 2027, Cabo Verde's Ink market is forecasted to achieve a high growth rate of 12.51%, with Egypt leading the Africa region, followed by South Africa, Ethiopia, Algeria and Nigeria.
Cape Verde Ink Market Overview
The Cape Verde Ink Market is characterized by steady growth, driven by the printing and packaging industries. The market includes a variety of inks, such as water-based, solvent-based, and UV-cured inks, catering to different printing needs. Increasing demand for sustainable and eco-friendly inks is also shaping the market landscape, as businesses and consumers become more environmentally conscious.
Drivers of the market
The Cape Verde ink market is driven by the expanding printing and packaging industries. The growing need for high-quality printing in sectors such as advertising, publishing, and packaging fuels the demand for various inks. Technological advancements in printing methods, including digital and 3D printing, along with increased consumption of packaged goods and promotional materials, are boosting the market.
Challenges of the market
The Cape Verde Ink Market is challenged by a limited local production capacity, leading to a heavy reliance on imported inks. This dependency increases costs and can result in supply chain vulnerabilities. Environmental regulations are becoming stricter, requiring manufacturers to invest in sustainable practices, which can be costly. Furthermore, there is a lack of awareness and demand for eco-friendly inks, limiting market growth potential.
Government Policy of the market
Cape Verde`s government policies on the ink market focus on reducing the environmental impact of printing inks. This includes regulations limiting the use of toxic chemicals in ink production and promoting the use of eco-friendly and biodegradable inks. The government also supports research and development initiatives aimed at producing sustainable ink solutions.
Key Highlights of the Report:
- Cape Verde Ink Market Outlook
- Market Size of Cape Verde Ink Market, 2024
- Forecast of Cape Verde Ink Market, 2031
- Historical Data and Forecast of Cape Verde Ink Revenues & Volume for the Period 2021-2031
- Cape Verde Ink Market Trend Evolution
- Cape Verde Ink Market Drivers and Challenges
- Cape Verde Ink Price Trends
- Cape Verde Ink Porter`s Five Forces
- Cape Verde Ink Industry Life Cycle
- Historical Data and Forecast of Cape Verde Ink Market Revenues & Volume By Technology for the Period 2021-2031
- Historical Data and Forecast of Cape Verde Ink Market Revenues & Volume By Lithographic for the Period 2021-2031
- Historical Data and Forecast of Cape Verde Ink Market Revenues & Volume By Flexographic for the Period 2021-2031
- Historical Data and Forecast of Cape Verde Ink Market Revenues & Volume By Gravure for the Period 2021-2031
- Historical Data and Forecast of Cape Verde Ink Market Revenues & Volume By Digital for the Period 2021-2031
- Historical Data and Forecast of Cape Verde Ink Market Revenues & Volume By Letterpress for the Period 2021-2031
- Historical Data and Forecast of Cape Verde Ink Market Revenues & Volume By Others for the Period 2021-2031
- Historical Data and Forecast of Cape Verde Ink Market Revenues & Volume By Ink Type for the Period 2021-2031
- Historical Data and Forecast of Cape Verde Ink Market Revenues & Volume By Oil Based for the Period 2021-2031
- Historical Data and Forecast of Cape Verde Ink Market Revenues & Volume By Solvent Based for the Period 2021-2031
- Historical Data and Forecast of Cape Verde Ink Market Revenues & Volume By Water Based for the Period 2021-2031
- Historical Data and Forecast of Cape Verde Ink Market Revenues & Volume By Applications for the Period 2021-2031
- Historical Data and Forecast of Cape Verde Ink Market Revenues & Volume By Label And Packaging for the Period 2021-2031
- Historical Data and Forecast of Cape Verde Ink Market Revenues & Volume By Commercial Printing for the Period 2021-2031
- Historical Data and Forecast of Cape Verde Ink Market Revenues & Volume By Publications for the Period 2021-2031
- Historical Data and Forecast of Cape Verde Ink Market Revenues & Volume By Others for the Period 2021-2031
- Cape Verde Ink Import Export Trade Statistics
- Market Opportunity Assessment By Technology
- Market Opportunity Assessment By Ink Type
- Market Opportunity Assessment By Applications
- Cape Verde Ink Top Companies Market Share
- Cape Verde Ink Competitive Benchmarking By Technical and Operational Parameters
- Cape Verde Ink Company Profiles
- Cape Verde Ink Key Strategic Recommendations
Frequently Asked Questions About the Market Study (FAQs):
6Wresearch actively monitors the Cape Verde Ink Market and publishes its comprehensive annual report, highlighting emerging trends, growth drivers, revenue analysis, and forecast outlook. Our insights help businesses to make data-backed strategic decisions with ongoing market dynamics. Our analysts track relevent industries related to the Cape Verde Ink Market, allowing our clients with actionable intelligence and reliable forecasts tailored to emerging regional needs.
Yes, we provide customisation as per your requirements. To learn more, feel free to contact us on sales@6wresearch.com
1 Executive Summary |
2 Introduction |
2.1 Key Highlights of the Report |
2.2 Report Description |
2.3 Market Scope & Segmentation |
2.4 Research Methodology |
2.5 Assumptions |
3 Cape Verde Ink Market Overview |
3.1 Cape Verde Country Macro Economic Indicators |
3.2 Cape Verde Ink Market Revenues & Volume, 2021 & 2031F |
3.3 Cape Verde Ink Market - Industry Life Cycle |
3.4 Cape Verde Ink Market - Porter's Five Forces |
3.5 Cape Verde Ink Market Revenues & Volume Share, By Technology, 2021 & 2031F |
3.6 Cape Verde Ink Market Revenues & Volume Share, By Ink Type, 2021 & 2031F |
3.7 Cape Verde Ink Market Revenues & Volume Share, By Applications, 2021 & 2031F |
4 Cape Verde Ink Market Dynamics |
4.1 Impact Analysis |
4.2 Market Drivers |
4.2.1 Growth in the packaging industry in Cape Verde, leading to increased demand for inks. |
4.2.2 Technological advancements in ink formulations, enhancing product quality and performance. |
4.2.3 Increasing focus on sustainable and eco-friendly inks, aligning with environmental regulations and consumer preferences. |
4.3 Market Restraints |
4.3.1 Fluctuating raw material prices impacting production costs and profitability. |
4.3.2 Intense competition from imported inks, especially from established international brands. |
4.3.3 Limited availability of skilled labor and resources for ink manufacturing in Cape Verde. |
5 Cape Verde Ink Market Trends |
6 Cape Verde Ink Market Segmentations |
6.1 Cape Verde Ink Market, By Technology |
6.1.1 Overview and Analysis |
6.1.2 Cape Verde Ink Market Revenues & Volume, By Lithographic , 2021-2031F |
6.1.3 Cape Verde Ink Market Revenues & Volume, By Flexographic , 2021-2031F |
6.1.4 Cape Verde Ink Market Revenues & Volume, By Gravure, 2021-2031F |
6.1.5 Cape Verde Ink Market Revenues & Volume, By Digital, 2021-2031F |
6.1.6 Cape Verde Ink Market Revenues & Volume, By Letterpress, 2021-2031F |
6.1.7 Cape Verde Ink Market Revenues & Volume, By Others, 2021-2031F |
6.2 Cape Verde Ink Market, By Ink Type |
6.2.1 Overview and Analysis |
6.2.2 Cape Verde Ink Market Revenues & Volume, By Oil Based, 2021-2031F |
6.2.3 Cape Verde Ink Market Revenues & Volume, By Solvent Based, 2021-2031F |
6.2.4 Cape Verde Ink Market Revenues & Volume, By Water Based, 2021-2031F |
6.3 Cape Verde Ink Market, By Applications |
6.3.1 Overview and Analysis |
6.3.2 Cape Verde Ink Market Revenues & Volume, By Label And Packaging, 2021-2031F |
6.3.3 Cape Verde Ink Market Revenues & Volume, By Commercial Printing, 2021-2031F |
6.3.4 Cape Verde Ink Market Revenues & Volume, By Publications, 2021-2031F |
6.3.5 Cape Verde Ink Market Revenues & Volume, By Others, 2021-2031F |
7 Cape Verde Ink Market Import-Export Trade Statistics |
7.1 Cape Verde Ink Market Export to Major Countries |
7.2 Cape Verde Ink Market Imports from Major Countries |
8 Cape Verde Ink Market Key Performance Indicators |
8.1 Research and development investment in new ink formulations and technologies. |
8.2 Adoption rate of sustainable practices in ink manufacturing processes. |
8.3 Number of partnerships or collaborations with local packaging companies for ink supply. |
9 Cape Verde Ink Market - Opportunity Assessment |
9.1 Cape Verde Ink Market Opportunity Assessment, By Technology, 2021 & 2031F |
9.2 Cape Verde Ink Market Opportunity Assessment, By Ink Type, 2021 & 2031F |
9.3 Cape Verde Ink Market Opportunity Assessment, By Applications, 2021 & 2031F |
10 Cape Verde Ink Market - Competitive Landscape |
10.1 Cape Verde Ink Market Revenue Share, By Companies, 2024 |
10.2 Cape Verde Ink Market Competitive Benchmarking, By Operating and Technical Parameters |
11 Company Profiles |
12 Recommendations | 13 Disclaimer |
Global Go To Market Strategy - 2030
Export potential enables firms to identify high-growth global markets with greater confidence by combining advanced trade intelligence with a structured quantitative methodology. The framework analyzes emerging demand trends and country-level import patterns while integrating macroeconomic and trade datasets such as GDP and population forecasts, bilateral import–export flows, tariff structures, elasticity differentials between developed and developing economies, geographic distance, and import demand projections. Using weighted trade values from 2020–2024 as the base period to project country-to-country export potential for 2030, these inputs are operationalized through calculated drivers such as gravity model parameters, tariff impact factors, and projected GDP per-capita growth. Through an analysis of hidden potentials, demand hotspots, and market conditions that are most favorable to success, this method enables firms to focus on target countries, maximize returns, and global expansion with data, backed by accuracy.
By factoring in the projected importer demand gap that is currently unmet and could be potential opportunity, it identifies the potential for the Exporter (Country) among 190 countries, against the general trade analysis, which identifies the biggest importer or exporter.
To discover high-growth global markets and optimize your business strategy:
Click Here
Pricing
- Single User License$ 1,995
- Department License$ 2,400
- Site License$ 3,120
- Global License$ 3,795

Leadership Perspectives from Industry Events
Search
Thought Leadership and Analyst Meet


Our Clients
6WResearch In News
- Doha a strategic location for EV manufacturing hub: IPA Qatar
- Demand for luxury TVs surging in the GCC, says Samsung
- Empowering Growth: The Thriving Journey of Bangladesh’s Cable Industry
- Demand for luxury TVs surging in the GCC, says Samsung
- Video call with a traditional healer? Once unthinkable, it’s now common in South Africa
- Intelligent Buildings To Smooth GCC’s Path To Net Zero
Latest Reports
- New Zealand Aseptic Manufacturing Market (2026-2032)
- Netherlands Aseptic Manufacturing Market (2026-2032)
- Nauru Aseptic Manufacturing Market (2026-2032)
- Namibia Aseptic Manufacturing Market (2026-2032)
- Mozambique Aseptic Manufacturing Market (2026-2032)
- Montenegro Aseptic Manufacturing Market (2026-2032)
- Mongolia Aseptic Manufacturing Market (2026-2032)
- Monaco Aseptic Manufacturing Market (2026-2032)
- Micronesia Aseptic Manufacturing Market (2026-2032)
- Mauritius Aseptic Manufacturing Market (2026-2032)
Industry Events and Analyst Meet

HIMTEX 2026

India Refining Summit 2026

India EV Show 2026

EV tech India Expo 2026

Auto Tech Asia 2026
Whitepaper
- Middle East & Africa Commercial Security Market Click here to view more.
- Middle East & Africa Fire Safety Systems & Equipment Market Click here to view more.
- GCC Drone Market Click here to view more.
- Middle East Lighting Fixture Market Click here to view more.
- GCC Physical & Perimeter Security Market Click here to view more.