Cape Verde Laser Projection Market (2026-2032) | Growth, Segmentation, Industry, Analysis, Forecast, Trends, Size, Revenue, Value, Companies, Share & Outlook
Market Forecast By Product Type (Laser Projector , CAD Laser Projection System), By Illumination Type (Laser Phosphor, Hybrid, RGB Laser, Laser Diode), By Vertical (Enterprise, Public Places, Cinema, Education, Retail, Medical, Industrial), By Resolution (WUXGA, WQXGA, and 2K, 4K, WXGA and XGA, HD and Full HD, Others) And Competitive Landscape
| Product Code: ETC5600760 | Publication Date: Nov 2023 | Updated Date: Mar 2026 | Product Type: Market Research Report | |
| Publisher: 6Wresearch | Author: Ravi Bhandari | No. of Pages: 60 | No. of Figures: 30 | No. of Tables: 5 |
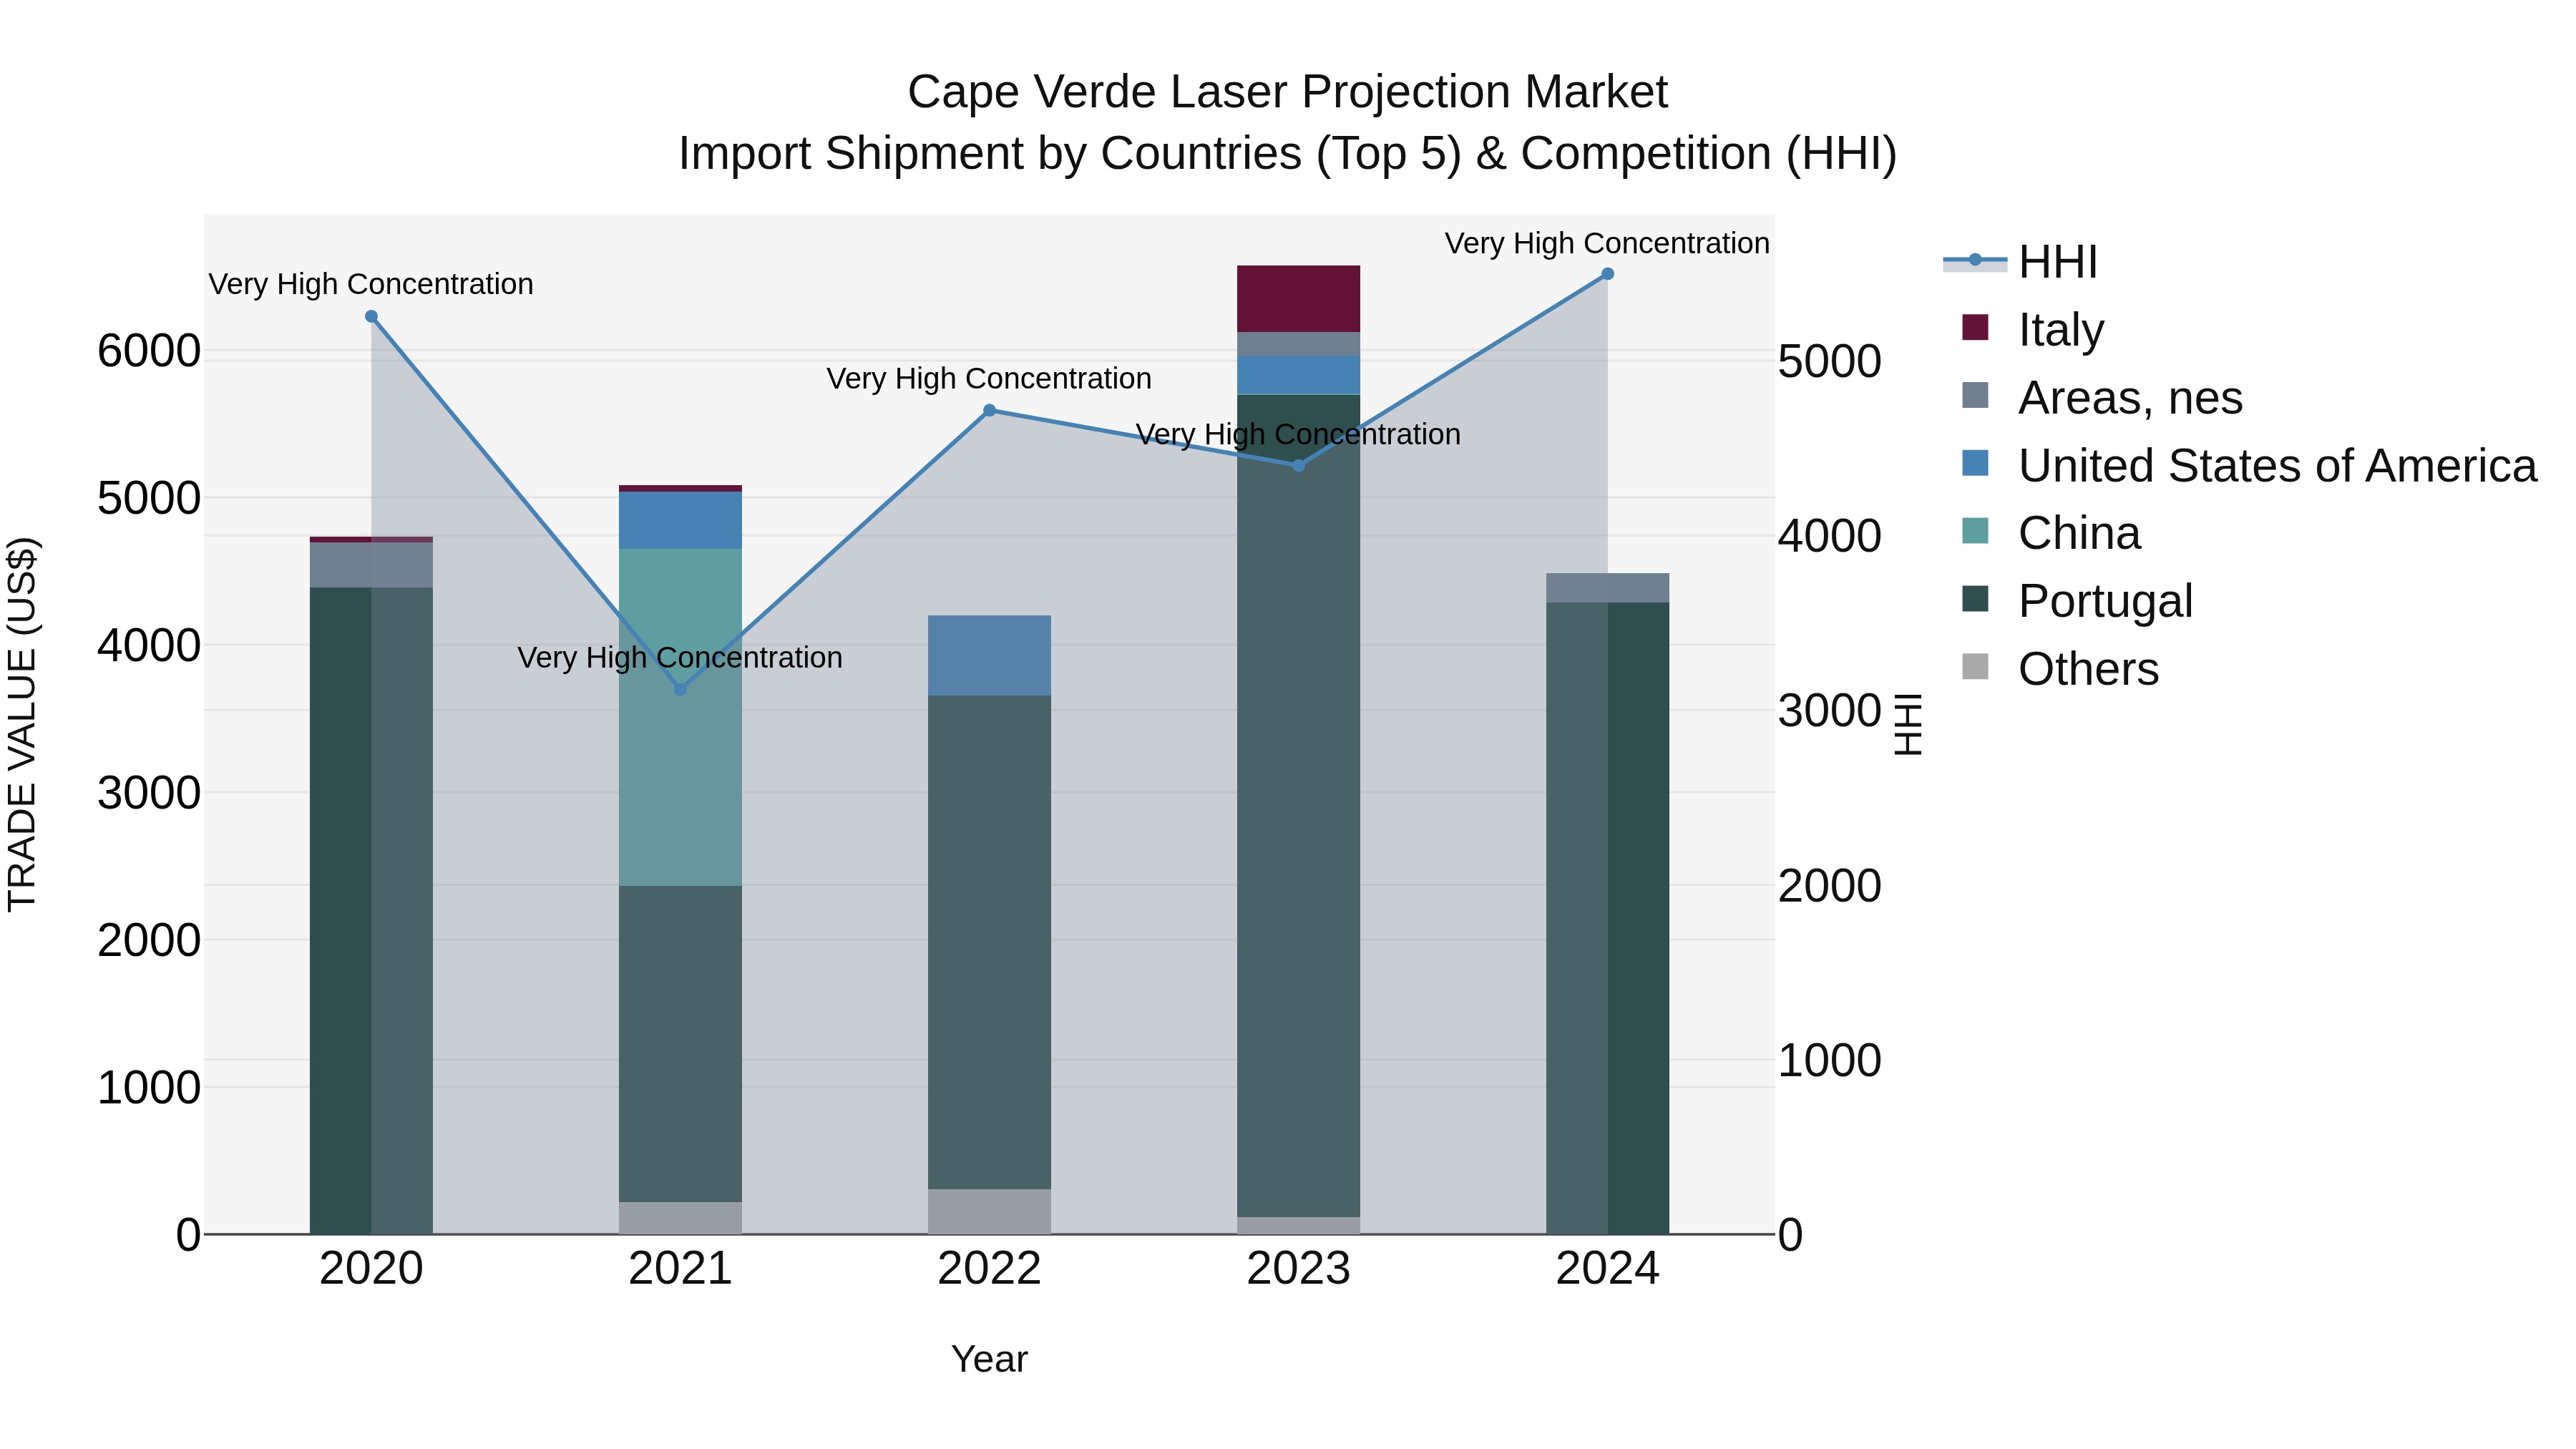
Cape Verde Laser Projection Market: Top 5 Importing Countries and Market Competition (HHI) Analysis
Cape Verde`s import market for laser projection equipment in 2024 continued to see a high concentration of shipments from top exporting countries such as Portugal, Areas, nes, China, Japan, and Italy. Despite a negative compound annual growth rate (CAGR) of -1.34% from 2020 to 2024, the import market experienced a significant decline in growth rate from 2023 to 2024, dropping by -31.76%. The high concentration of imports from key countries indicates a strong market presence and potential opportunities for market players to capitalize on in Cape Verde`s laser projection sector.
Key Highlights of the Report:
- Cape Verde Laser Projection Market Outlook
- Market Size of Cape Verde Laser Projection Market, 2025
- Forecast of Cape Verde Laser Projection Market, 2032
- Historical Data and Forecast of Cape Verde Laser Projection Revenues & Volume for the Period 2022 - 2032F
- Cape Verde Laser Projection Market Trend Evolution
- Cape Verde Laser Projection Market Drivers and Challenges
- Cape Verde Laser Projection Price Trends
- Cape Verde Laser Projection Porter`s Five Forces
- Cape Verde Laser Projection Industry Life Cycle
- Historical Data and Forecast of Cape Verde Laser Projection Market Revenues & Volume By Product Type for the Period 2022 - 2032F
- Historical Data and Forecast of Cape Verde Laser Projection Market Revenues & Volume By Laser Projector for the Period 2022 - 2032F
- Historical Data and Forecast of Cape Verde Laser Projection Market Revenues & Volume By CAD Laser Projection System for the Period 2022 - 2032F
- Historical Data and Forecast of Cape Verde Laser Projection Market Revenues & Volume By Illumination Type for the Period 2022 - 2032F
- Historical Data and Forecast of Cape Verde Laser Projection Market Revenues & Volume By Laser Phosphor for the Period 2022 - 2032F
- Historical Data and Forecast of Cape Verde Laser Projection Market Revenues & Volume By Hybrid for the Period 2022 - 2032F
- Historical Data and Forecast of Cape Verde Laser Projection Market Revenues & Volume By RGB Laser for the Period 2022 - 2032F
- Historical Data and Forecast of Cape Verde Laser Projection Market Revenues & Volume By Laser Diode for the Period 2022 - 2032F
- Historical Data and Forecast of Cape Verde Laser Projection Market Revenues & Volume By Vertical for the Period 2022 - 2032F
- Historical Data and Forecast of Cape Verde Laser Projection Market Revenues & Volume By Enterprise for the Period 2022 - 2032F
- Historical Data and Forecast of Cape Verde Laser Projection Market Revenues & Volume By Public Places for the Period 2022 - 2032F
- Historical Data and Forecast of Cape Verde Laser Projection Market Revenues & Volume By Cinema for the Period 2022 - 2032F
- Historical Data and Forecast of Cape Verde Laser Projection Market Revenues & Volume By Education for the Period 2022 - 2032F
- Historical Data and Forecast of Cape Verde Laser Projection Market Revenues & Volume By Retail for the Period 2022 - 2032F
- Historical Data and Forecast of Cape Verde Laser Projection Market Revenues & Volume By Medical for the Period 2022 - 2032F
- Historical Data and Forecast of Cape Verde Laser Projection Market Revenues & Volume By Industrial for the Period 2022 - 2032F
- Historical Data and Forecast of Cape Verde Laser Projection Market Revenues & Volume By Resolution for the Period 2022 - 2032F
- Historical Data and Forecast of Cape Verde Laser Projection Market Revenues & Volume By WUXGA, WQXGA, and 2K for the Period 2022 - 2032F
- Historical Data and Forecast of Cape Verde Laser Projection Market Revenues & Volume By 4K for the Period 2022 - 2032F
- Historical Data and Forecast of Cape Verde Laser Projection Market Revenues & Volume By WXGA and XGA for the Period 2022 - 2032F
- Historical Data and Forecast of Cape Verde Laser Projection Market Revenues & Volume By HD and Full HD for the Period 2022 - 2032F
- Historical Data and Forecast of Cape Verde Laser Projection Market Revenues & Volume By Others for the Period 2022 - 2032F
- Cape Verde Laser Projection Import Export Trade Statistics
- Market Opportunity Assessment By Product Type
- Market Opportunity Assessment By Illumination Type
- Market Opportunity Assessment By Vertical
- Market Opportunity Assessment By Resolution
- Cape Verde Laser Projection Top Companies Market Share
- Cape Verde Laser Projection Competitive Benchmarking By Technical and Operational Parameters
- Cape Verde Laser Projection Company Profiles
- Cape Verde Laser Projection Key Strategic Recommendations
Frequently Asked Questions About the Market Study (FAQs):
6Wresearch actively monitors the Cape Verde Laser Projection Market and publishes its comprehensive annual report, highlighting emerging trends, growth drivers, revenue analysis, and forecast outlook. Our insights help businesses to make data-backed strategic decisions with ongoing market dynamics. Our analysts track relevent industries related to the Cape Verde Laser Projection Market, allowing our clients with actionable intelligence and reliable forecasts tailored to emerging regional needs.
Yes, we provide customisation as per your requirements. To learn more, feel free to contact us on sales@6wresearch.com
1 Executive Summary |
2 Introduction |
2.1 Key Highlights of the Report |
2.2 Report Description |
2.3 Market Scope & Segmentation |
2.4 Research Methodology |
2.5 Assumptions |
3 Cape Verde Laser Projection Market Overview |
3.1 Cape Verde Country Macro Economic Indicators |
3.2 Cape Verde Laser Projection Market Revenues & Volume, 2022 & 2032F |
3.3 Cape Verde Laser Projection Market - Industry Life Cycle |
3.4 Cape Verde Laser Projection Market - Porter's Five Forces |
3.5 Cape Verde Laser Projection Market Revenues & Volume Share, By Product Type , 2022 & 2032F |
3.6 Cape Verde Laser Projection Market Revenues & Volume Share, By Illumination Type , 2022 & 2032F |
3.7 Cape Verde Laser Projection Market Revenues & Volume Share, By Vertical, 2022 & 2032F |
3.8 Cape Verde Laser Projection Market Revenues & Volume Share, By Resolution, 2022 & 2032F |
4 Cape Verde Laser Projection Market Dynamics |
4.1 Impact Analysis |
4.2 Market Drivers |
4.2.1 Increasing demand for high-quality visual displays in entertainment venues, educational institutions, and corporate settings in Cape Verde. |
4.2.2 Technological advancements leading to enhanced performance, reliability, and affordability of laser projection systems. |
4.2.3 Growth in the tourism sector in Cape Verde, driving the demand for innovative and immersive projection solutions. |
4.3 Market Restraints |
4.3.1 High initial investment costs associated with acquiring laser projection technology may hinder market penetration in Cape Verde. |
4.3.2 Limited awareness and understanding of the benefits of laser projection systems among potential end-users. |
4.3.3 Challenges related to infrastructure development and maintenance to support the installation and operation of laser projection systems in Cape Verde. |
5 Cape Verde Laser Projection Market Trends |
6 Cape Verde Laser Projection Market Segmentations |
6.1 Cape Verde Laser Projection Market, By Product Type |
6.1.1 Overview and Analysis |
6.1.2 Cape Verde Laser Projection Market Revenues & Volume, By Laser Projector , 2022 - 2032F |
6.1.3 Cape Verde Laser Projection Market Revenues & Volume, By CAD Laser Projection System, 2022 - 2032F |
6.2 Cape Verde Laser Projection Market, By Illumination Type |
6.2.1 Overview and Analysis |
6.2.2 Cape Verde Laser Projection Market Revenues & Volume, By Laser Phosphor, 2022 - 2032F |
6.2.3 Cape Verde Laser Projection Market Revenues & Volume, By Hybrid, 2022 - 2032F |
6.2.4 Cape Verde Laser Projection Market Revenues & Volume, By RGB Laser, 2022 - 2032F |
6.2.5 Cape Verde Laser Projection Market Revenues & Volume, By Laser Diode, 2022 - 2032F |
6.3 Cape Verde Laser Projection Market, By Vertical |
6.3.1 Overview and Analysis |
6.3.2 Cape Verde Laser Projection Market Revenues & Volume, By Enterprise, 2022 - 2032F |
6.3.3 Cape Verde Laser Projection Market Revenues & Volume, By Public Places, 2022 - 2032F |
6.3.4 Cape Verde Laser Projection Market Revenues & Volume, By Cinema, 2022 - 2032F |
6.3.5 Cape Verde Laser Projection Market Revenues & Volume, By Education, 2022 - 2032F |
6.3.6 Cape Verde Laser Projection Market Revenues & Volume, By Retail, 2022 - 2032F |
6.3.7 Cape Verde Laser Projection Market Revenues & Volume, By Medical, 2022 - 2032F |
6.4 Cape Verde Laser Projection Market, By Resolution |
6.4.1 Overview and Analysis |
6.4.2 Cape Verde Laser Projection Market Revenues & Volume, By WUXGA, WQXGA, and 2K, 2022 - 2032F |
6.4.3 Cape Verde Laser Projection Market Revenues & Volume, By 4K, 2022 - 2032F |
6.4.4 Cape Verde Laser Projection Market Revenues & Volume, By WXGA and XGA, 2022 - 2032F |
6.4.5 Cape Verde Laser Projection Market Revenues & Volume, By HD and Full HD, 2022 - 2032F |
6.4.6 Cape Verde Laser Projection Market Revenues & Volume, By Others, 2022 - 2032F |
7 Cape Verde Laser Projection Market Import-Export Trade Statistics |
7.1 Cape Verde Laser Projection Market Export to Major Countries |
7.2 Cape Verde Laser Projection Market Imports from Major Countries |
8 Cape Verde Laser Projection Market Key Performance Indicators |
8.1 Average utilization rate of laser projection systems in key sectors such as entertainment, education, and corporate in Cape Verde. |
8.2 Percentage increase in the adoption of laser projection technology compared to traditional projection methods. |
8.3 Rate of innovation and introduction of new features in laser projection systems tailored to the specific needs of the Cape Verde market. |
9 Cape Verde Laser Projection Market - Opportunity Assessment |
9.1 Cape Verde Laser Projection Market Opportunity Assessment, By Product Type , 2022 & 2032F |
9.2 Cape Verde Laser Projection Market Opportunity Assessment, By Illumination Type , 2022 & 2032F |
9.3 Cape Verde Laser Projection Market Opportunity Assessment, By Vertical, 2022 & 2032F |
9.4 Cape Verde Laser Projection Market Opportunity Assessment, By Resolution, 2022 & 2032F |
10 Cape Verde Laser Projection Market - Competitive Landscape |
10.1 Cape Verde Laser Projection Market Revenue Share, By Companies, 2025 |
10.2 Cape Verde Laser Projection Market Competitive Benchmarking, By Operating and Technical Parameters |
11 Company Profiles |
12 Recommendations | 13 Disclaimer |
Global Go To Market Strategy - 2030
Export potential enables firms to identify high-growth global markets with greater confidence by combining advanced trade intelligence with a structured quantitative methodology. The framework analyzes emerging demand trends and country-level import patterns while integrating macroeconomic and trade datasets such as GDP and population forecasts, bilateral import–export flows, tariff structures, elasticity differentials between developed and developing economies, geographic distance, and import demand projections. Using weighted trade values from 2020–2024 as the base period to project country-to-country export potential for 2030, these inputs are operationalized through calculated drivers such as gravity model parameters, tariff impact factors, and projected GDP per-capita growth. Through an analysis of hidden potentials, demand hotspots, and market conditions that are most favorable to success, this method enables firms to focus on target countries, maximize returns, and global expansion with data, backed by accuracy.
By factoring in the projected importer demand gap that is currently unmet and could be potential opportunity, it identifies the potential for the Exporter (Country) among 190 countries, against the general trade analysis, which identifies the biggest importer or exporter.
To discover high-growth global markets and optimize your business strategy:
Click Here
Pricing
- Single User License$ 1,995
- Department License$ 2,400
- Site License$ 3,120
- Global License$ 3,795

Leadership Perspectives from Industry Events
Search
Thought Leadership and Analyst Meet


Our Clients
6WResearch In News
- Doha a strategic location for EV manufacturing hub: IPA Qatar
- Demand for luxury TVs surging in the GCC, says Samsung
- Empowering Growth: The Thriving Journey of Bangladesh’s Cable Industry
- Demand for luxury TVs surging in the GCC, says Samsung
- Video call with a traditional healer? Once unthinkable, it’s now common in South Africa
- Intelligent Buildings To Smooth GCC’s Path To Net Zero
Latest Reports
- New Zealand Aseptic Manufacturing Market (2026-2032)
- Netherlands Aseptic Manufacturing Market (2026-2032)
- Nauru Aseptic Manufacturing Market (2026-2032)
- Namibia Aseptic Manufacturing Market (2026-2032)
- Mozambique Aseptic Manufacturing Market (2026-2032)
- Montenegro Aseptic Manufacturing Market (2026-2032)
- Mongolia Aseptic Manufacturing Market (2026-2032)
- Monaco Aseptic Manufacturing Market (2026-2032)
- Micronesia Aseptic Manufacturing Market (2026-2032)
- Mauritius Aseptic Manufacturing Market (2026-2032)
Industry Events and Analyst Meet

HIMTEX 2026

India Refining Summit 2026

India EV Show 2026

EV tech India Expo 2026

Auto Tech Asia 2026
Whitepaper
- Middle East & Africa Commercial Security Market Click here to view more.
- Middle East & Africa Fire Safety Systems & Equipment Market Click here to view more.
- GCC Drone Market Click here to view more.
- Middle East Lighting Fixture Market Click here to view more.
- GCC Physical & Perimeter Security Market Click here to view more.