Cape Verde Leather goods Market (2025-2031) | Value, Share, Trends, Industry, Growth, Segmentation, Outlook, Revenue, Size, Forecast, Companies & Analysis
Market Forecast By Product Type (Footwear, Luggage, Wallets & Purses, Clothing and Apparel, Others), By Distribution Channel (Supermarkets/Hypermarkets, Convenience Stores, Online Stores) And Competitive Landscape
| Product Code: ETC4945355 | Publication Date: Nov 2023 | Updated Date: Nov 2025 | Product Type: Market Research Report | |
| Publisher: 6Wresearch | Author: Sachin Kumar Rai | No. of Pages: 60 | No. of Figures: 30 | No. of Tables: 5 |
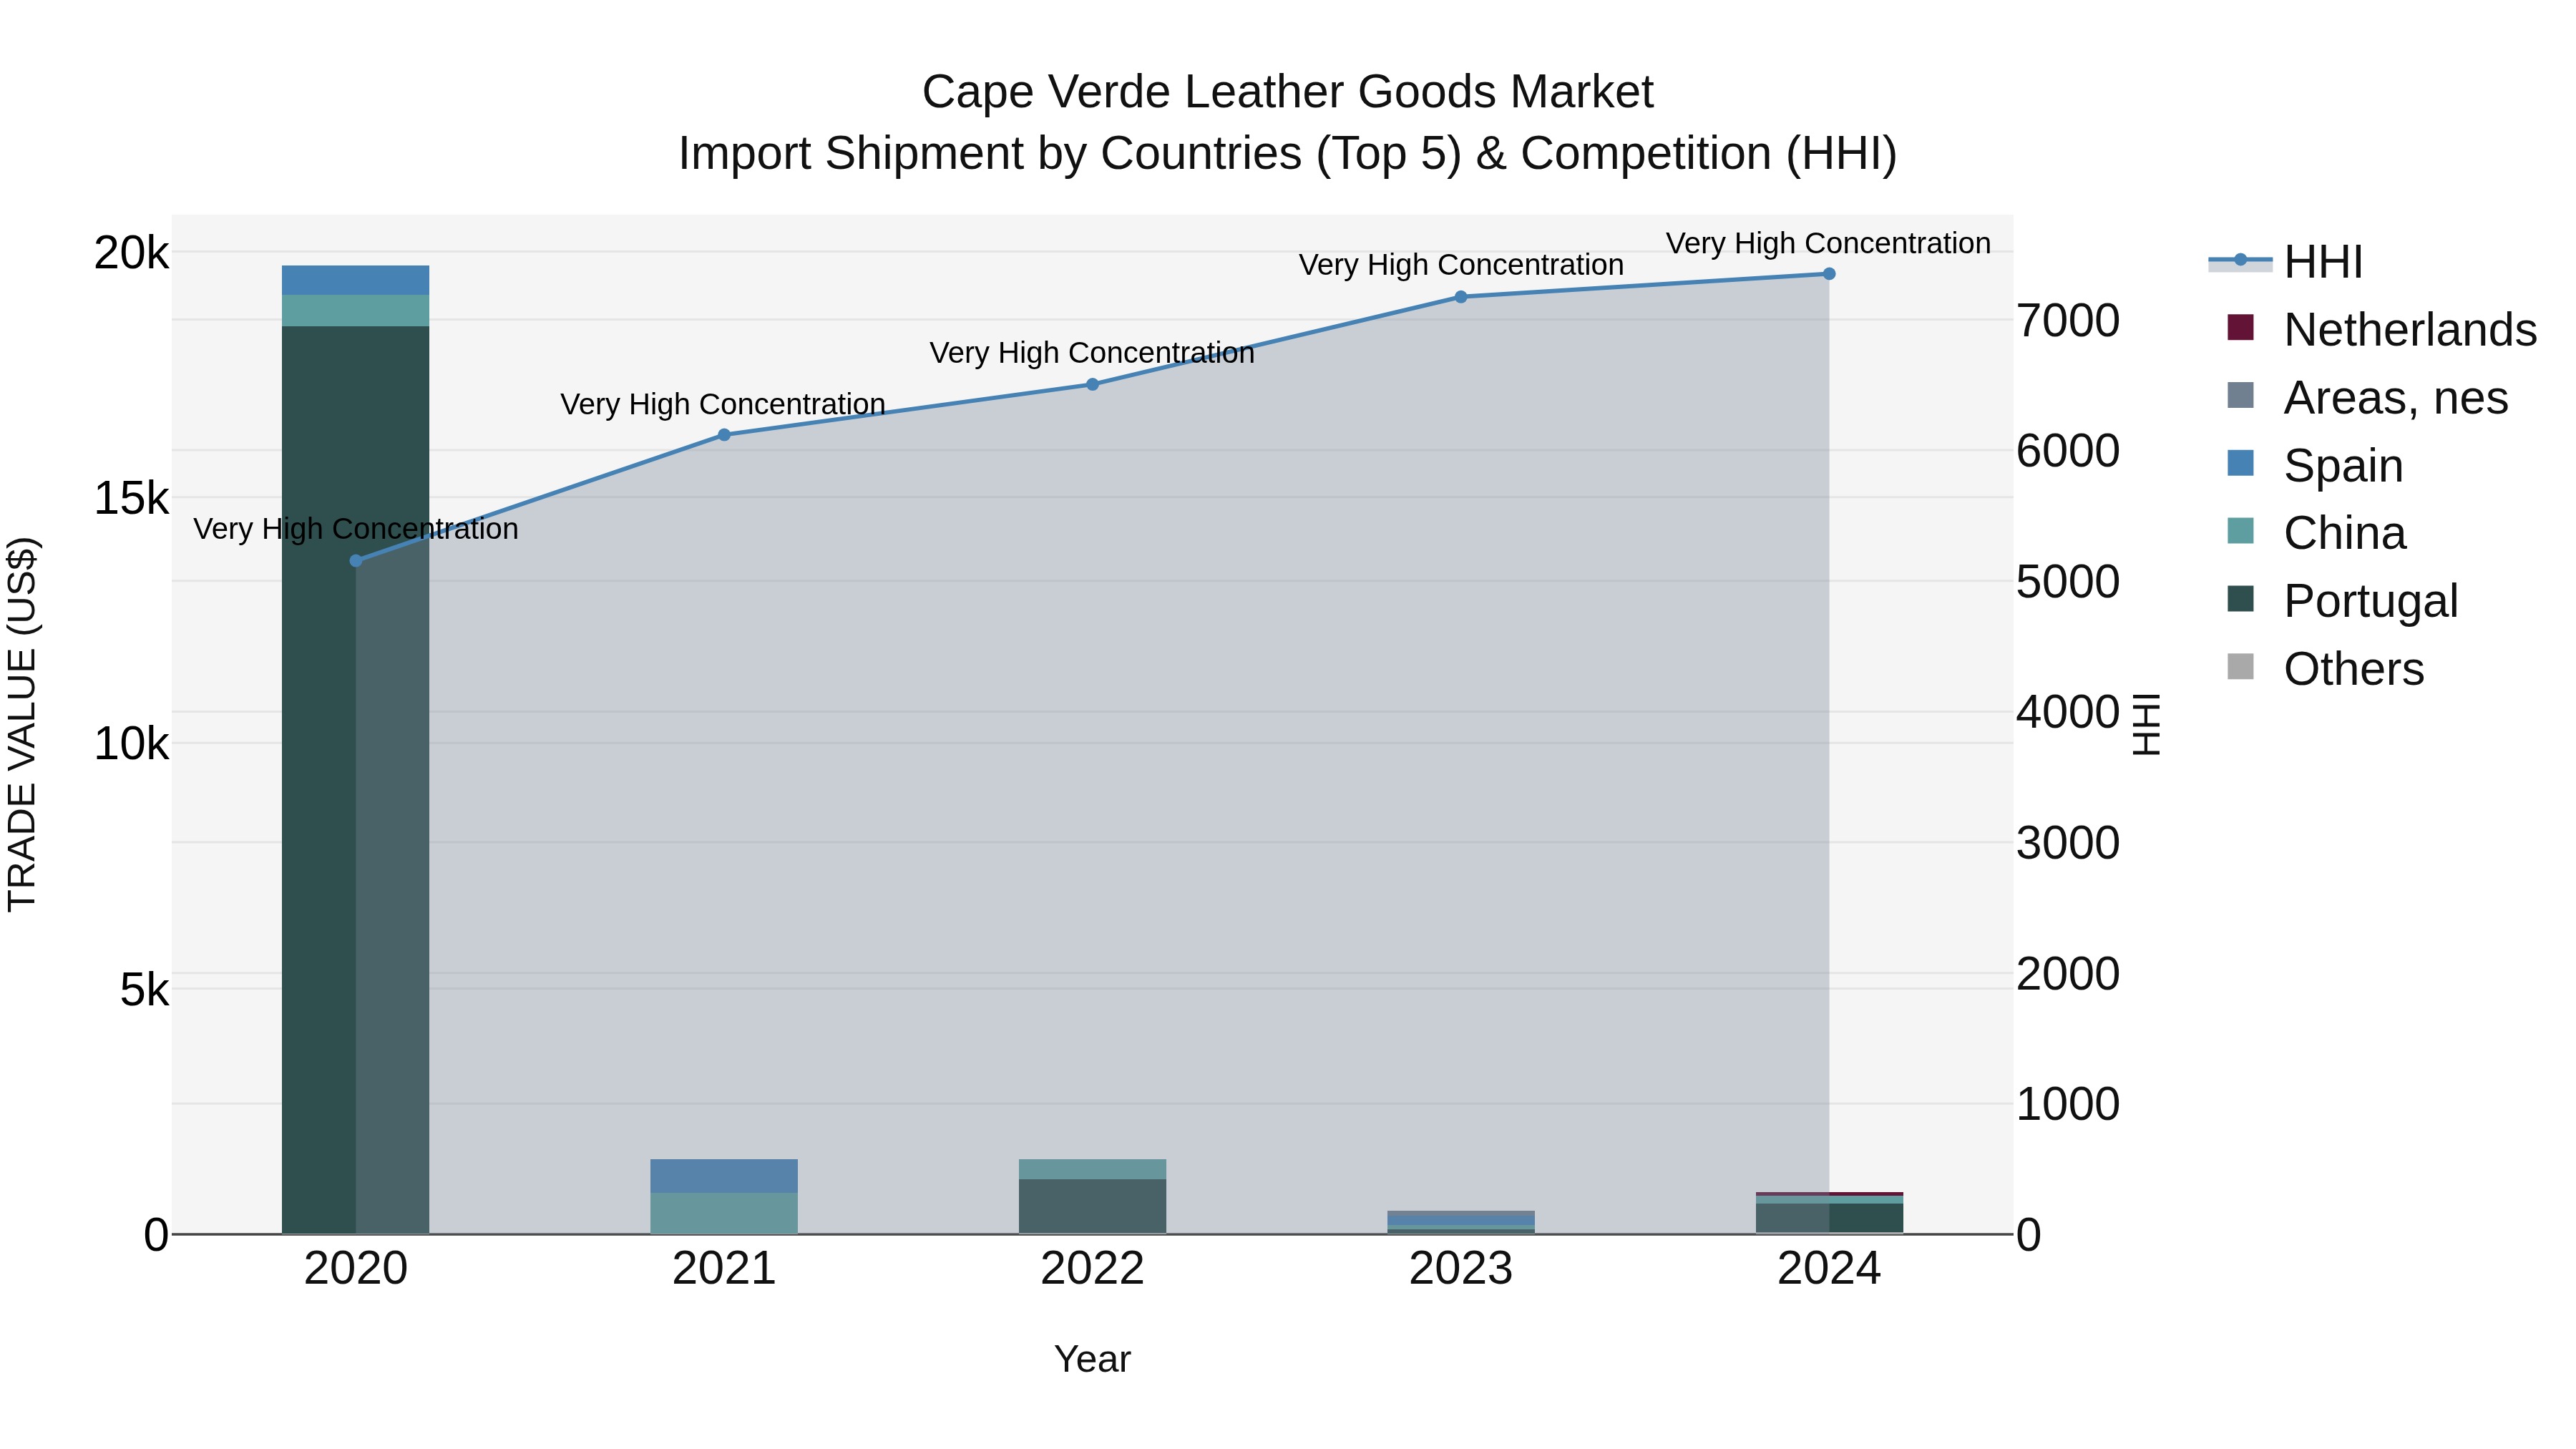
Cape Verde Leather Goods Market: Top 5 Importing Countries and Market Competition (HHI) Analysis
The import shipments of leather goods into Cape Verde saw significant growth in 2024, with top exporting countries being Portugal, China, Netherlands, Morocco, and Areas, nes. The High Herfindahl-Hirschman Index (HHI) indicates a very high concentration in the market, reflecting potential challenges for competition. Despite a negative Compound Annual Growth Rate (CAGR) from 2020-2024, there was a remarkable growth rate of 77.54% from 2023-2024. This suggests a dynamic market environment with opportunities for further expansion and diversification in the leather goods sector in Cape Verde.
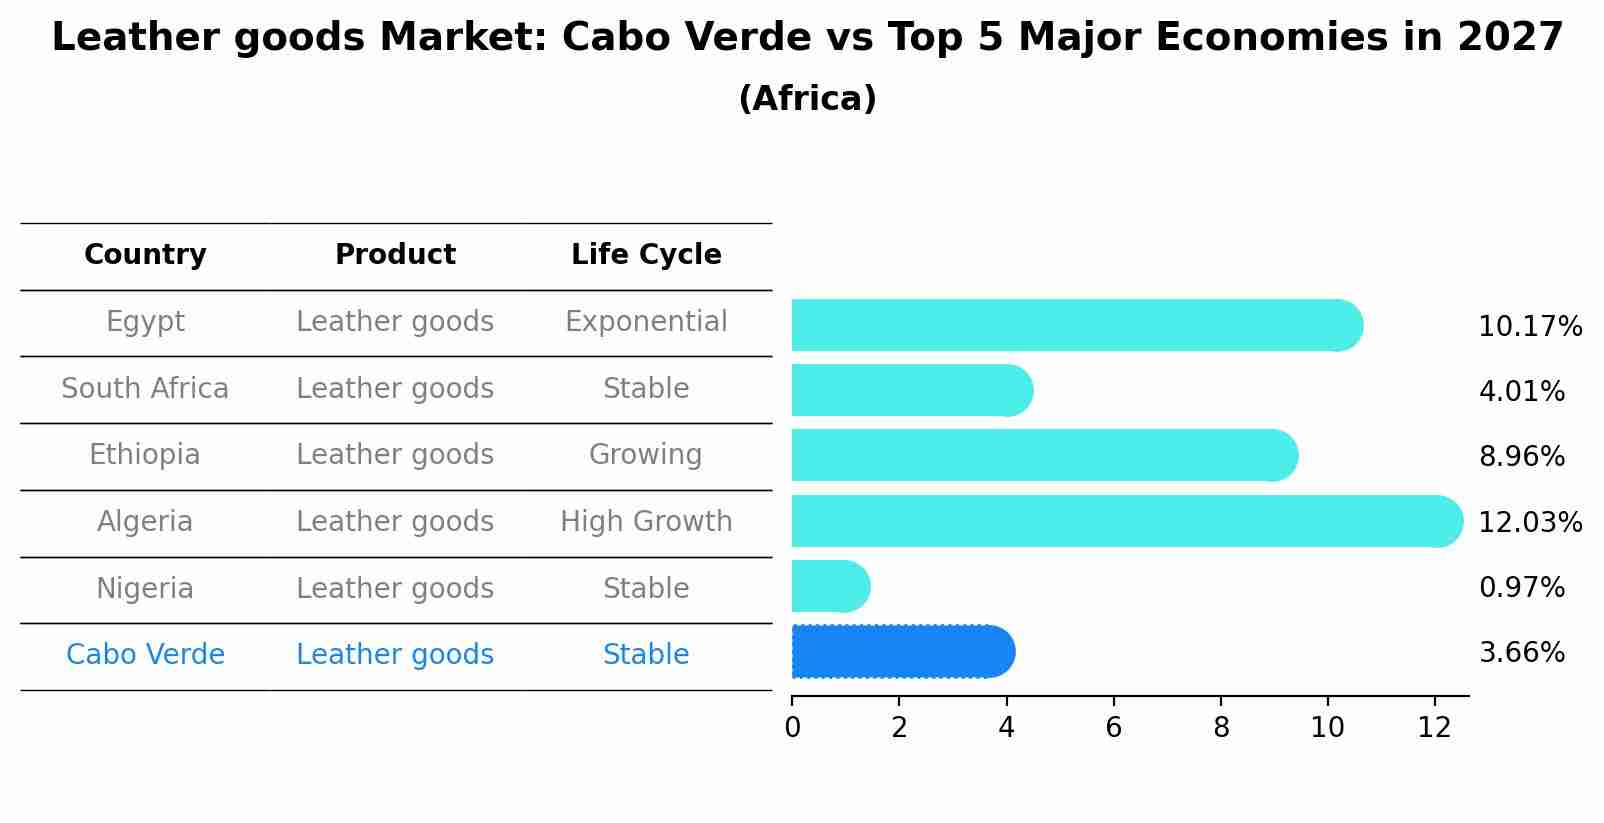
Leather goods Market: Cabo Verde vs Top 5 Major Economies in 2027 (Africa)
In the Africa region, the Leather goods market in Cabo Verde is projected to expand at a stable growth rate of 3.66% by 2027. The largest economy is Egypt, followed by South Africa, Ethiopia, Algeria and Nigeria.
Cape Verde Leather goods Market Overview
Cape Verde`s leather goods market is a developing sector, focusing on the production and sale of items such as bags, belts, shoes, and accessories. The market is influenced by local craftsmanship and the demand for high-quality, durable products. Growth in this market is tied to tourism, exports, and increasing consumer preference for artisanal and sustainable leather goods.
Drivers of the market
The Cape Verde Leather Goods Market benefits from the growing consumer preference for high-quality and durable leather products. The expansion of the fashion and accessories industry, including handbags, belts, and footwear, drives demand for leather goods. Increasing disposable incomes and changing lifestyle trends contribute to market growth. Additionally, the rise in luxury and premium leather product segments, supported by a growing middle-class population, fuels the demand for leather goods in Cape Verde.
Challenges of the market
Challenges in the Cape Verde leather goods market include high import costs and a limited local production base. The market is also affected by fluctuations in demand and competition from cheaper, imported alternatives. Additionally, a lack of infrastructure for processing and finishing leather can constrain market growth.
Government Policy of the market
Policies in the leather goods market focus on supporting local artisans and manufacturers while ensuring quality and sustainability. The government promotes the use of traditional methods alongside modern techniques and enforces regulations to maintain product standards and fair trade practices.
Key Highlights of the Report:
- Cape Verde Leather goods Market Outlook
- Market Size of Cape Verde Leather goods Market, 2024
- Forecast of Cape Verde Leather goods Market, 2031
- Historical Data and Forecast of Cape Verde Leather goods Revenues & Volume for the Period 2021-2031
- Cape Verde Leather goods Market Trend Evolution
- Cape Verde Leather goods Market Drivers and Challenges
- Cape Verde Leather goods Price Trends
- Cape Verde Leather goods Porter`s Five Forces
- Cape Verde Leather goods Industry Life Cycle
- Historical Data and Forecast of Cape Verde Leather goods Market Revenues & Volume By Product Type for the Period 2021-2031
- Historical Data and Forecast of Cape Verde Leather goods Market Revenues & Volume By Footwear for the Period 2021-2031
- Historical Data and Forecast of Cape Verde Leather goods Market Revenues & Volume By Luggage for the Period 2021-2031
- Historical Data and Forecast of Cape Verde Leather goods Market Revenues & Volume By Wallets & Purses for the Period 2021-2031
- Historical Data and Forecast of Cape Verde Leather goods Market Revenues & Volume By Clothing and Apparel for the Period 2021-2031
- Historical Data and Forecast of Cape Verde Leather goods Market Revenues & Volume By Others for the Period 2021-2031
- Historical Data and Forecast of Cape Verde Leather goods Market Revenues & Volume By Distribution Channel for the Period 2021-2031
- Historical Data and Forecast of Cape Verde Leather goods Market Revenues & Volume By Supermarkets/Hypermarkets for the Period 2021-2031
- Historical Data and Forecast of Cape Verde Leather goods Market Revenues & Volume By Convenience Stores for the Period 2021-2031
- Historical Data and Forecast of Cape Verde Leather goods Market Revenues & Volume By Online Stores for the Period 2021-2031
- Cape Verde Leather goods Import Export Trade Statistics
- Market Opportunity Assessment By Product Type
- Market Opportunity Assessment By Distribution Channel
- Cape Verde Leather goods Top Companies Market Share
- Cape Verde Leather goods Competitive Benchmarking By Technical and Operational Parameters
- Cape Verde Leather goods Company Profiles
- Cape Verde Leather goods Key Strategic Recommendations
Frequently Asked Questions About the Market Study (FAQs):
6Wresearch actively monitors the Cape Verde Leather goods Market and publishes its comprehensive annual report, highlighting emerging trends, growth drivers, revenue analysis, and forecast outlook. Our insights help businesses to make data-backed strategic decisions with ongoing market dynamics. Our analysts track relevent industries related to the Cape Verde Leather goods Market, allowing our clients with actionable intelligence and reliable forecasts tailored to emerging regional needs.
Yes, we provide customisation as per your requirements. To learn more, feel free to contact us on sales@6wresearch.com
1 Executive Summary |
2 Introduction |
2.1 Key Highlights of the Report |
2.2 Report Description |
2.3 Market Scope & Segmentation |
2.4 Research Methodology |
2.5 Assumptions |
3 Cape Verde Leather goods Market Overview |
3.1 Cape Verde Country Macro Economic Indicators |
3.2 Cape Verde Leather goods Market Revenues & Volume, 2021 & 2031F |
3.3 Cape Verde Leather goods Market - Industry Life Cycle |
3.4 Cape Verde Leather goods Market - Porter's Five Forces |
3.5 Cape Verde Leather goods Market Revenues & Volume Share, By Product Type, 2021 & 2031F |
3.6 Cape Verde Leather goods Market Revenues & Volume Share, By ? Distribution Channel, 2021 & 2031F |
4 Cape Verde Leather goods Market Dynamics |
4.1 Impact Analysis |
4.2 Market Drivers |
4.3 Market Restraints |
5 Cape Verde Leather goods Market Trends |
6 Cape Verde Leather goods Market Segmentations |
6.1 Cape Verde Leather goods Market, By Product Type |
6.1.1 Overview and Analysis |
6.1.2 Cape Verde Leather goods Market Revenues & Volume, By Footwear, 2021-2031F |
6.1.3 Cape Verde Leather goods Market Revenues & Volume, By Luggage, 2021-2031F |
6.1.4 Cape Verde Leather goods Market Revenues & Volume, By Wallets & Purses, 2021-2031F |
6.1.5 Cape Verde Leather goods Market Revenues & Volume, By Clothing and Apparel, 2021-2031F |
6.1.6 Cape Verde Leather goods Market Revenues & Volume, By Others, 2021-2031F |
6.2 Cape Verde Leather goods Market, By ? Distribution Channel |
6.2.1 Overview and Analysis |
6.2.2 Cape Verde Leather goods Market Revenues & Volume, By Supermarkets/Hypermarkets, 2021-2031F |
6.2.3 Cape Verde Leather goods Market Revenues & Volume, By Convenience Stores, 2021-2031F |
6.2.4 Cape Verde Leather goods Market Revenues & Volume, By Online Stores, 2021-2031F |
7 Cape Verde Leather goods Market Import-Export Trade Statistics |
7.1 Cape Verde Leather goods Market Export to Major Countries |
7.2 Cape Verde Leather goods Market Imports from Major Countries |
8 Cape Verde Leather goods Market Key Performance Indicators |
9 Cape Verde Leather goods Market - Opportunity Assessment |
9.1 Cape Verde Leather goods Market Opportunity Assessment, By Product Type, 2021 & 2031F |
9.2 Cape Verde Leather goods Market Opportunity Assessment, By ? Distribution Channel, 2021 & 2031F |
10 Cape Verde Leather goods Market - Competitive Landscape |
10.1 Cape Verde Leather goods Market Revenue Share, By Companies, 2024 |
10.2 Cape Verde Leather goods Market Competitive Benchmarking, By Operating and Technical Parameters |
11 Company Profiles |
12 Recommendations | 13 Disclaimer |
Global Go To Market Strategy - 2030
Export potential enables firms to identify high-growth global markets with greater confidence by combining advanced trade intelligence with a structured quantitative methodology. The framework analyzes emerging demand trends and country-level import patterns while integrating macroeconomic and trade datasets such as GDP and population forecasts, bilateral import–export flows, tariff structures, elasticity differentials between developed and developing economies, geographic distance, and import demand projections. Using weighted trade values from 2020–2024 as the base period to project country-to-country export potential for 2030, these inputs are operationalized through calculated drivers such as gravity model parameters, tariff impact factors, and projected GDP per-capita growth. Through an analysis of hidden potentials, demand hotspots, and market conditions that are most favorable to success, this method enables firms to focus on target countries, maximize returns, and global expansion with data, backed by accuracy.
By factoring in the projected importer demand gap that is currently unmet and could be potential opportunity, it identifies the potential for the Exporter (Country) among 190 countries, against the general trade analysis, which identifies the biggest importer or exporter.
To discover high-growth global markets and optimize your business strategy:
Click Here
Pricing
- Single User License$ 1,995
- Department License$ 2,400
- Site License$ 3,120
- Global License$ 3,795

Leadership Perspectives from Industry Events
Search
Thought Leadership and Analyst Meet


Our Clients
6WResearch In News
- India Export Attractiveness Tracker 2026
- India Air Conditioner Market Set for Strong Rebound in 2026 After Weather-Led Correction and GST-Driven Recovery: 6Wresearch
- ADAS in India: How Automatic Emergency Braking, Blind Spot Detection & Driver Monitoring are Transforming Road Safety
- Doha a strategic location for EV manufacturing hub: IPA Qatar
- Demand for luxury TVs surging in the GCC, says Samsung
- Empowering Growth: The Thriving Journey of Bangladesh’s Cable Industry
Latest Reports
- Nicaragua RPG Gaming Market (2026-2032)
- New Zealand RPG Gaming Market (2026-2032)
- Netherlands RPG Gaming Market (2026-2032)
- Nauru RPG Gaming Market (2026-2032)
- Namibia RPG Gaming Market (2026-2032)
- Mozambique RPG Gaming Market (2026-2032)
- Montenegro RPG Gaming Market (2026-2032)
- Mongolia RPG Gaming Market (2026-2032)
- Monaco RPG Gaming Market (2026-2032)
- Micronesia RPG Gaming Market (2026-2032)
Industry Events and Analyst Meet

EV India Expo 2026

HIMTEX 2026

India Refining Summit 2026

India EV Show 2026

EV tech India Expo 2026
Whitepaper
- Middle East & Africa Commercial Security Market Click here to view more.
- Middle East & Africa Fire Safety Systems & Equipment Market Click here to view more.
- GCC Drone Market Click here to view more.
- Middle East Lighting Fixture Market Click here to view more.
- GCC Physical & Perimeter Security Market Click here to view more.