Cape Verde Propionic acid Market (2025-2031) | Share, Analysis, Industry, Segmentation, Forecast, Trends, Companies, Growth, Value, Revenue, Size & Outlook
Market Forecast By Application (Herbicides, Rubber Products, Plasticizers, Food Preservatives, Others), By End use Industry (Pharmaceuticals, Personal Care, Food & Beverage, Agriculture, Others) And Competitive Landscape
| Product Code: ETC4746254 | Publication Date: Nov 2023 | Updated Date: Nov 2025 | Product Type: Market Research Report | |
| Publisher: 6Wresearch | Author: Sachin Kumar Rai | No. of Pages: 60 | No. of Figures: 30 | No. of Tables: 5 |
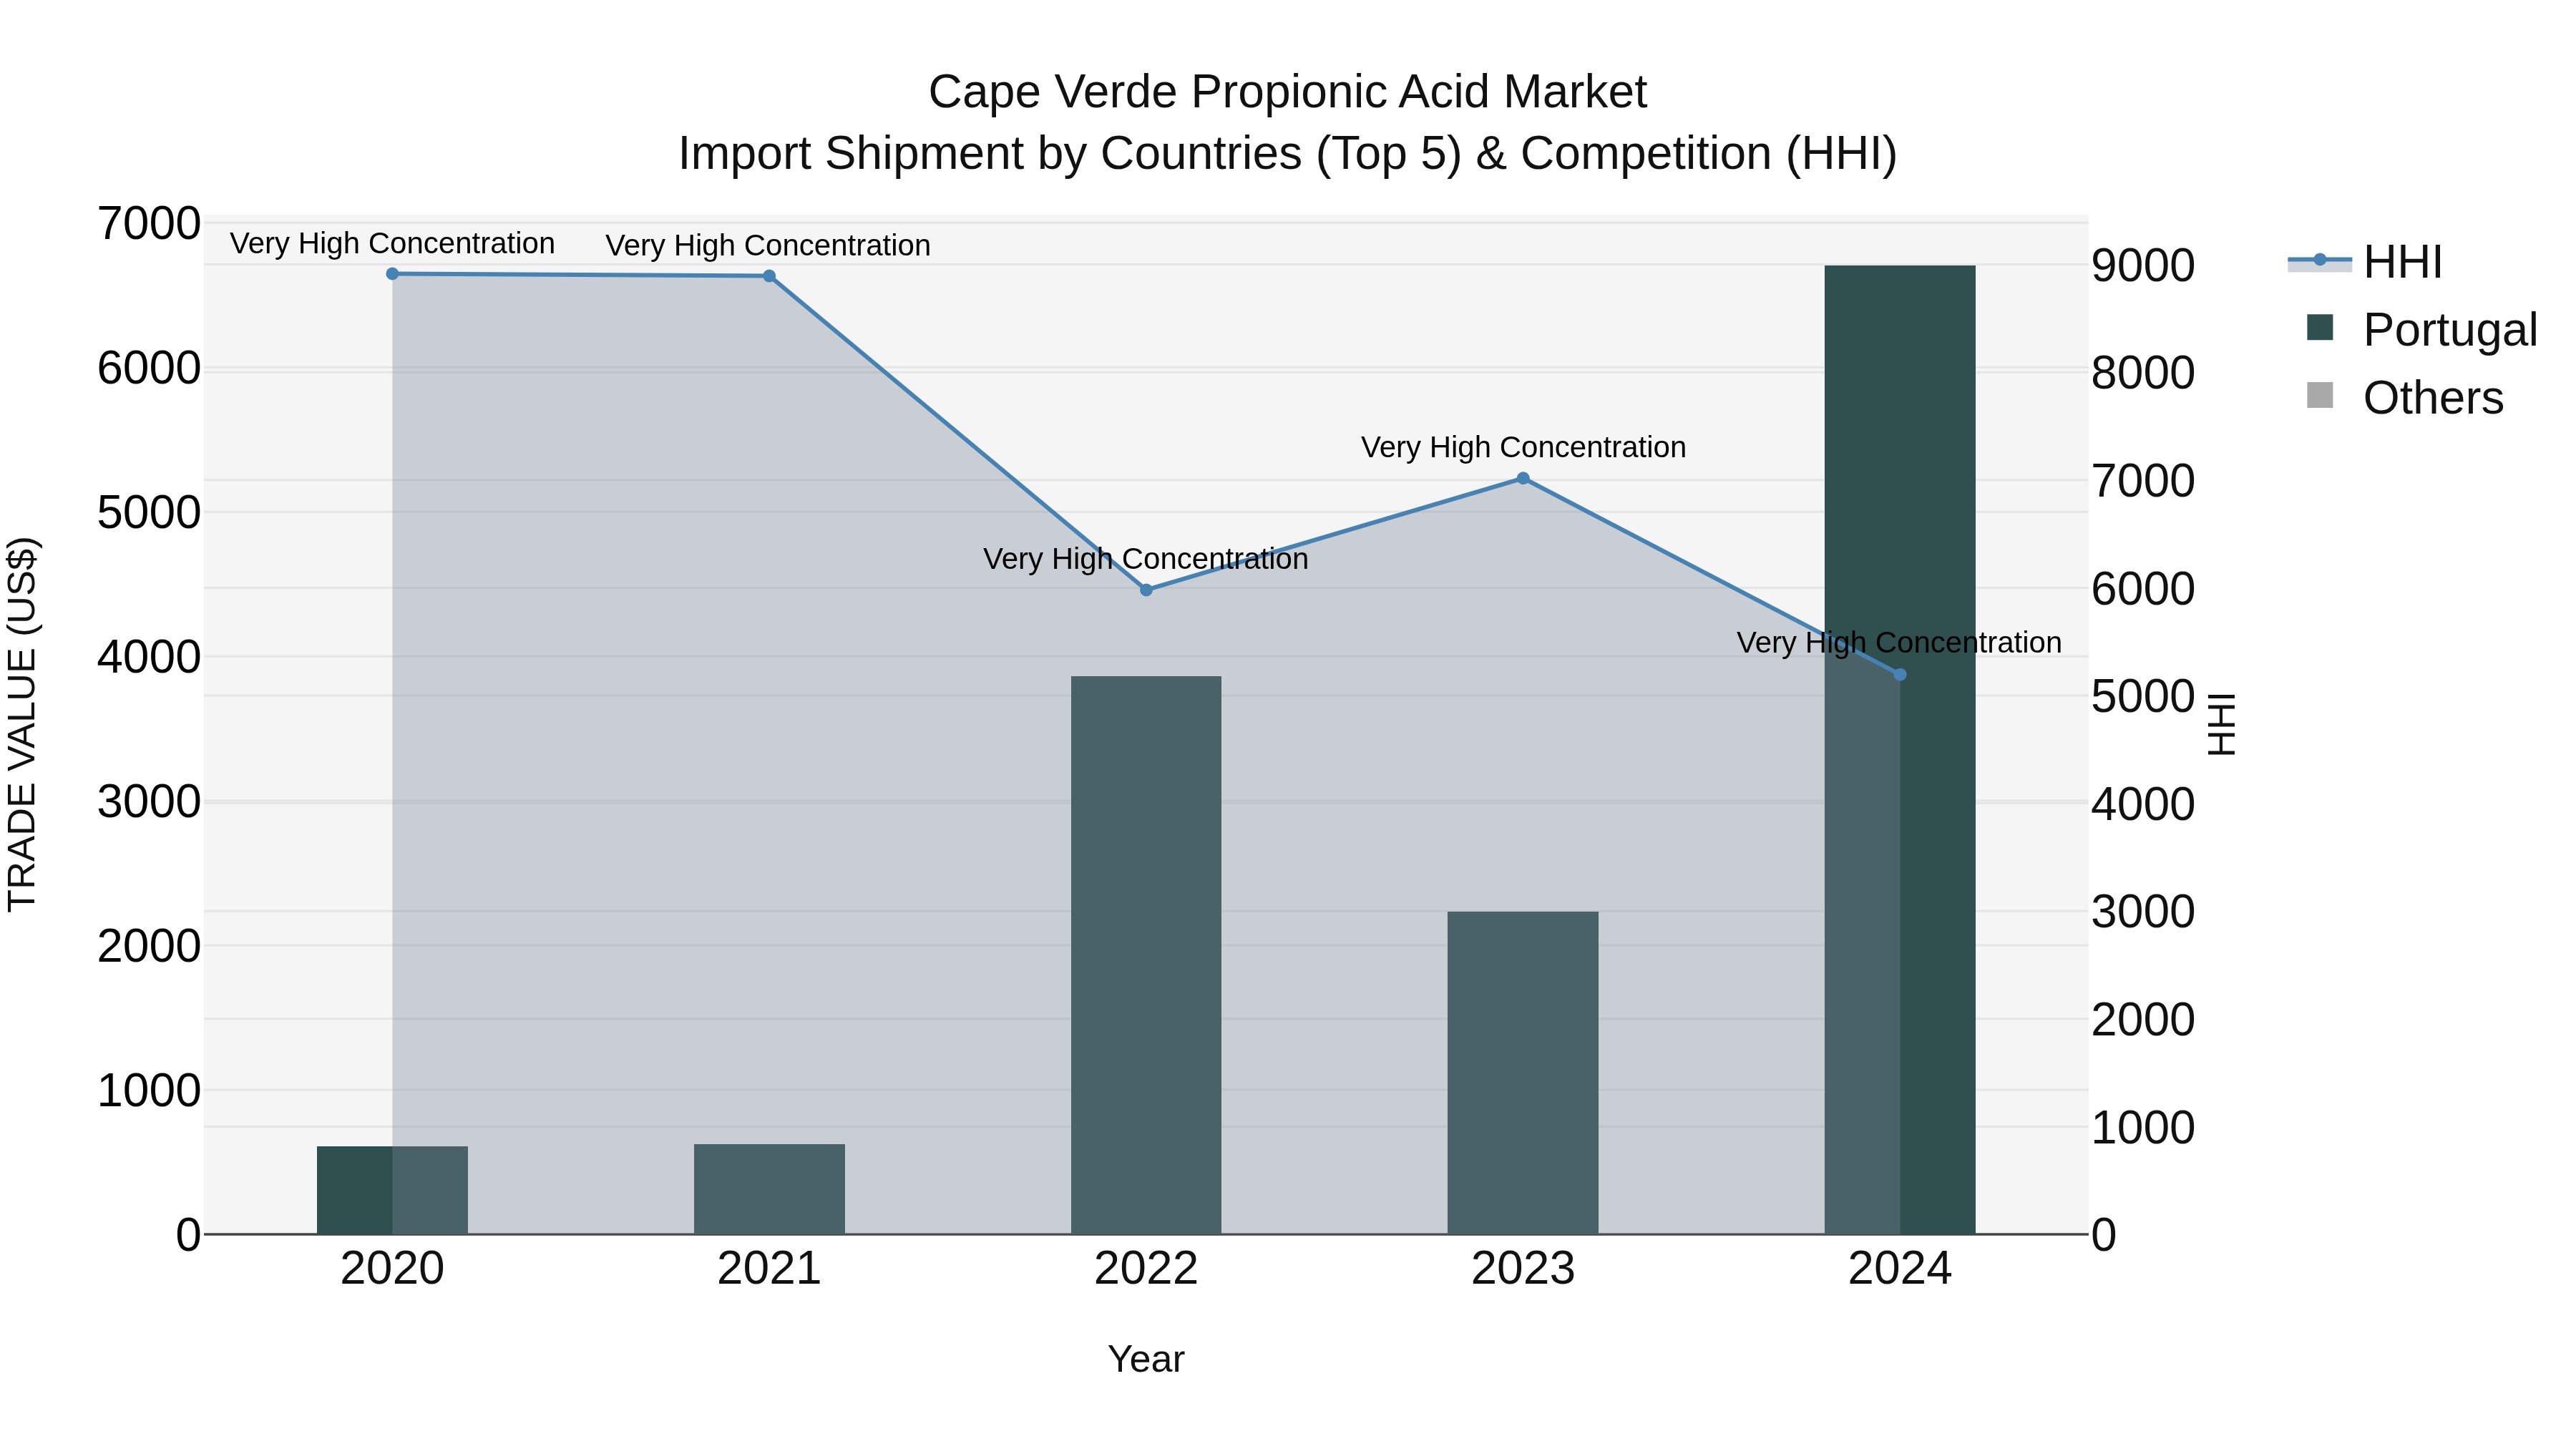
Cape Verde Propionic Acid Market: Top 5 Importing Countries and Market Competition (HHI) Analysis
In 2024, Cape Verde`s propionic acid import market continued to be dominated by Portugal, reflecting a high level of concentration with a Herfindahl-Hirschman Index (HHI) that remained very high. The compound annual growth rate (CAGR) from 2020 to 2024 was an impressive 81.98%, indicating a robust expansion of the market. Furthermore, the growth rate from 2023 to 2024 soared to 200.37%, suggesting a significant uptick in demand for propionic acid in Cape Verde. The strong performance highlights the importance of the relationship between Cape Verde and Portugal in the propionic acid trade.
Cape Verde Propionic acid Market Overview
The Propionic Acid Market in Cape Verde is primarily driven by its use as a preservative in the food and feed industries. Propionic acid helps inhibit mold and bacterial growth, making it essential for extending the shelf life of various products. The market is also supported by its applications in the production of herbicides and in chemical manufacturing processes.
Drivers of the market
The propionic acid market in Cape Verde is influenced by its use in agriculture, food preservation, and chemical manufacturing. Propionic acid acts as a preservative in food products and as a feed additive in agriculture, supporting its market demand. The growth in food and agricultural sectors, along with increasing awareness of food safety and preservation, drives the market.
Challenges of the market
The propionic acid market in Cape Verde is limited by the small scale of its food and feed industries, which are the primary consumers of this preservative. The high cost of importing propionic acid due to geographical isolation also poses a significant challenge, reducing its competitiveness compared to other preservatives. Additionally, there is a lack of awareness about the benefits of using propionic acid in food preservation, which further restricts market growth.
Government Policy of the market
The government of Cape Verde regulates the propionic acid market primarily through policies that ensure the safe handling and use of chemical substances. Importation and distribution are strictly controlled to comply with safety and environmental standards. The market faces challenges due to high import tariffs and limited local production capacity. The government is considering measures to attract foreign investment to establish local manufacturing facilities and reduce dependency on imports.
Key Highlights of the Report:
- Cape Verde Propionic acid Market Outlook
- Market Size of Cape Verde Propionic acid Market, 2024
- Forecast of Cape Verde Propionic acid Market, 2031
- Historical Data and Forecast of Cape Verde Propionic acid Revenues & Volume for the Period 2021-2031
- Cape Verde Propionic acid Market Trend Evolution
- Cape Verde Propionic acid Market Drivers and Challenges
- Cape Verde Propionic acid Price Trends
- Cape Verde Propionic acid Porter`s Five Forces
- Cape Verde Propionic acid Industry Life Cycle
- Historical Data and Forecast of Cape Verde Propionic acid Market Revenues & Volume By Application for the Period 2021-2031
- Historical Data and Forecast of Cape Verde Propionic acid Market Revenues & Volume By Herbicides for the Period 2021-2031
- Historical Data and Forecast of Cape Verde Propionic acid Market Revenues & Volume By Rubber Products for the Period 2021-2031
- Historical Data and Forecast of Cape Verde Propionic acid Market Revenues & Volume By Plasticizers for the Period 2021-2031
- Historical Data and Forecast of Cape Verde Propionic acid Market Revenues & Volume By Food Preservatives for the Period 2021-2031
- Historical Data and Forecast of Cape Verde Propionic acid Market Revenues & Volume By Others for the Period 2021-2031
- Historical Data and Forecast of Cape Verde Propionic acid Market Revenues & Volume By End use Industry for the Period 2021-2031
- Historical Data and Forecast of Cape Verde Propionic acid Market Revenues & Volume By Pharmaceuticals for the Period 2021-2031
- Historical Data and Forecast of Cape Verde Propionic acid Market Revenues & Volume By Personal Care for the Period 2021-2031
- Historical Data and Forecast of Cape Verde Propionic acid Market Revenues & Volume By Food & Beverage for the Period 2021-2031
- Historical Data and Forecast of Cape Verde Propionic acid Market Revenues & Volume By Agriculture for the Period 2021-2031
- Historical Data and Forecast of Cape Verde Propionic acid Market Revenues & Volume By Others for the Period 2021-2031
- Cape Verde Propionic acid Import Export Trade Statistics
- Market Opportunity Assessment By Application
- Market Opportunity Assessment By End use Industry
- Cape Verde Propionic acid Top Companies Market Share
- Cape Verde Propionic acid Competitive Benchmarking By Technical and Operational Parameters
- Cape Verde Propionic acid Company Profiles
- Cape Verde Propionic acid Key Strategic Recommendations
Frequently Asked Questions About the Market Study (FAQs):
6Wresearch actively monitors the Cape Verde Propionic acid Market and publishes its comprehensive annual report, highlighting emerging trends, growth drivers, revenue analysis, and forecast outlook. Our insights help businesses to make data-backed strategic decisions with ongoing market dynamics. Our analysts track relevent industries related to the Cape Verde Propionic acid Market, allowing our clients with actionable intelligence and reliable forecasts tailored to emerging regional needs.
Yes, we provide customisation as per your requirements. To learn more, feel free to contact us on sales@6wresearch.com
1 Executive Summary |
2 Introduction |
2.1 Key Highlights of the Report |
2.2 Report Description |
2.3 Market Scope & Segmentation |
2.4 Research Methodology |
2.5 Assumptions |
3 Cape Verde Propionic acid Market Overview |
3.1 Cape Verde Country Macro Economic Indicators |
3.2 Cape Verde Propionic acid Market Revenues & Volume, 2021 & 2031F |
3.3 Cape Verde Propionic acid Market - Industry Life Cycle |
3.4 Cape Verde Propionic acid Market - Porter's Five Forces |
3.5 Cape Verde Propionic acid Market Revenues & Volume Share, By Application, 2021 & 2031F |
3.6 Cape Verde Propionic acid Market Revenues & Volume Share, By End use Industry, 2021 & 2031F |
4 Cape Verde Propionic acid Market Dynamics |
4.1 Impact Analysis |
4.2 Market Drivers |
4.3 Market Restraints |
5 Cape Verde Propionic acid Market Trends |
6 Cape Verde Propionic acid Market Segmentations |
6.1 Cape Verde Propionic acid Market, By Application |
6.1.1 Overview and Analysis |
6.1.2 Cape Verde Propionic acid Market Revenues & Volume, By Herbicides, 2021-2031F |
6.1.3 Cape Verde Propionic acid Market Revenues & Volume, By Rubber Products, 2021-2031F |
6.1.4 Cape Verde Propionic acid Market Revenues & Volume, By Plasticizers, 2021-2031F |
6.1.5 Cape Verde Propionic acid Market Revenues & Volume, By Food Preservatives, 2021-2031F |
6.1.6 Cape Verde Propionic acid Market Revenues & Volume, By Others, 2021-2031F |
6.2 Cape Verde Propionic acid Market, By End use Industry |
6.2.1 Overview and Analysis |
6.2.2 Cape Verde Propionic acid Market Revenues & Volume, By Pharmaceuticals, 2021-2031F |
6.2.3 Cape Verde Propionic acid Market Revenues & Volume, By Personal Care, 2021-2031F |
6.2.4 Cape Verde Propionic acid Market Revenues & Volume, By Food & Beverage, 2021-2031F |
6.2.5 Cape Verde Propionic acid Market Revenues & Volume, By Agriculture, 2021-2031F |
6.2.6 Cape Verde Propionic acid Market Revenues & Volume, By Others, 2021-2031F |
7 Cape Verde Propionic acid Market Import-Export Trade Statistics |
7.1 Cape Verde Propionic acid Market Export to Major Countries |
7.2 Cape Verde Propionic acid Market Imports from Major Countries |
8 Cape Verde Propionic acid Market Key Performance Indicators |
9 Cape Verde Propionic acid Market - Opportunity Assessment |
9.1 Cape Verde Propionic acid Market Opportunity Assessment, By Application, 2021 & 2031F |
9.2 Cape Verde Propionic acid Market Opportunity Assessment, By End use Industry, 2021 & 2031F |
10 Cape Verde Propionic acid Market - Competitive Landscape |
10.1 Cape Verde Propionic acid Market Revenue Share, By Companies, 2024 |
10.2 Cape Verde Propionic acid Market Competitive Benchmarking, By Operating and Technical Parameters |
11 Company Profiles |
12 Recommendations | 13 Disclaimer |
Export potential assessment - trade Analytics for 2030
Export potential enables firms to identify high-growth global markets with greater confidence by combining advanced trade intelligence with a structured quantitative methodology. The framework analyzes emerging demand trends and country-level import patterns while integrating macroeconomic and trade datasets such as GDP and population forecasts, bilateral import–export flows, tariff structures, elasticity differentials between developed and developing economies, geographic distance, and import demand projections. Using weighted trade values from 2020–2024 as the base period to project country-to-country export potential for 2030, these inputs are operationalized through calculated drivers such as gravity model parameters, tariff impact factors, and projected GDP per-capita growth. Through an analysis of hidden potentials, demand hotspots, and market conditions that are most favorable to success, this method enables firms to focus on target countries, maximize returns, and global expansion with data, backed by accuracy.
By factoring in the projected importer demand gap that is currently unmet and could be potential opportunity, it identifies the potential for the Exporter (Country) among 190 countries, against the general trade analysis, which identifies the biggest importer or exporter.
To discover high-growth global markets and optimize your business strategy:
Click Here
Pricing
- Single User License$ 1,995
- Department License$ 2,400
- Site License$ 3,120
- Global License$ 3,795

Search
Thought Leadership and Analyst Meet


Our Clients
Latest Reports
- Philippines Polyhydroxybutyrate-co-Hydroxyvalerate Market (2026-2032) | Trends, Insights, Challenges, Restraints, Competition, Size, Value, Forecast, Pricing, Share, Outlook, Revenue, Investment Opportunities, Strategy, Drivers, Demand, Growth, segmentation, Analysis, Companies
- Peru Polyhydroxybutyrate-co-Hydroxyvalerate Market (2026-2032) | Growth, Demand, Challenges, Share, Trends, Analysis, Pricing, Investment Opportunities, Drivers, Value, Forecast, Competition, Size, Companies, Insights, Outlook, Restraints, segmentation, Revenue, Strategy
- Pakistan Polyhydroxybutyrate-co-Hydroxyvalerate Market (2026-2032) | Restraints, segmentation, Pricing, Forecast, Share, Strategy, Competition, Trends, Insights, Drivers, Challenges, Growth, Revenue, Outlook, Value, Investment Opportunities, Companies, Size, Analysis, Demand
- Oman Polyhydroxybutyrate-co-Hydroxyvalerate Market (2026-2032) | Drivers, segmentation, Insights, Competition, Pricing, Outlook, Size, Revenue, Challenges, Forecast, Analysis, Growth, Value, Share, Trends, Investment Opportunities, Strategy, Restraints, Companies, Demand
- Nigeria Polyhydroxybutyrate-co-Hydroxyvalerate Market (2026-2032) | Value, Investment Opportunities, Analysis, Revenue, Restraints, Pricing, Outlook, Competition, Demand, Growth, Forecast, Companies, Trends, Challenges, segmentation, Drivers, Insights, Share, Size, Strategy
- Nepal Polyhydroxybutyrate-co-Hydroxyvalerate Market (2026-2032) | Insights, Analysis, Drivers, Share, Revenue, Demand, segmentation, Investment Opportunities, Competition, Forecast, Growth, Pricing, Companies, Strategy, Trends, Restraints, Challenges, Outlook, Size, Value
- Myanmar Polyhydroxybutyrate-co-Hydroxyvalerate Market (2026-2032) | Outlook, Revenue, Strategy, Restraints, Drivers, segmentation, Share, Forecast, Competition, Insights, Growth, Pricing, Size, Demand, Value, Companies, Trends, Challenges, Investment Opportunities, Analysis
- Morocco Polyhydroxybutyrate-co-Hydroxyvalerate Market (2026-2032) | Outlook, Investment Opportunities, Restraints, Strategy, Forecast, Challenges, Drivers, Growth, Companies, segmentation, Trends, Size, Competition, Revenue, Demand, Insights, Share, Analysis, Value, Pricing
- Mexico Polyhydroxybutyrate-co-Hydroxyvalerate Market (2026-2032) | Size, Drivers, Outlook, Share, Strategy, Growth, Pricing, Challenges, Companies, Demand, Value, Investment Opportunities, Restraints, Trends, Forecast, segmentation, Analysis, Insights, Competition, Revenue
- Malaysia Polyhydroxybutyrate-co-Hydroxyvalerate Market (2026-2032) | Share, segmentation, Size, Companies, Analysis, Insights, Forecast, Value, Revenue, Drivers, Restraints, Challenges, Investment Opportunities, Trends, Competition, Strategy, Demand, Growth, Outlook, Pricing
Industry Events and Analyst Meet

HIMTEX 2026

India Refining Summit 2026

India EV Show 2026

EV tech India Expo 2026

Auto Tech Asia 2026
Whitepaper
- Middle East & Africa Commercial Security Market Click here to view more.
- Middle East & Africa Fire Safety Systems & Equipment Market Click here to view more.
- GCC Drone Market Click here to view more.
- Middle East Lighting Fixture Market Click here to view more.
- GCC Physical & Perimeter Security Market Click here to view more.
6WResearch In News
- Doha a strategic location for EV manufacturing hub: IPA Qatar
- Demand for luxury TVs surging in the GCC, says Samsung
- Empowering Growth: The Thriving Journey of Bangladesh’s Cable Industry
- Demand for luxury TVs surging in the GCC, says Samsung
- Video call with a traditional healer? Once unthinkable, it’s now common in South Africa
- Intelligent Buildings To Smooth GCC’s Path To Net Zero