China Vitamin E Market Outlook | Growth, Value, Forecast, Industry, Analysis, COVID-19 IMPACT, Share, Size, Companies, Revenue & Trends
Market Forecast By Product Type (Natural, Synthetic), By Application (Functional Food and Beverages, Pharmaceuticals and Dietary Supplements, Infant Nutrition, Pet Food & Animal Feed, Cosmetics) And Competitive Landscape
| Product Code: ETC083140 | Publication Date: Jun 2021 | Updated Date: Oct 2025 | Product Type: Report | |
| Publisher: 6Wresearch | Author: Ravi Bhandari | No. of Pages: 70 | No. of Figures: 35 | No. of Tables: 5 |
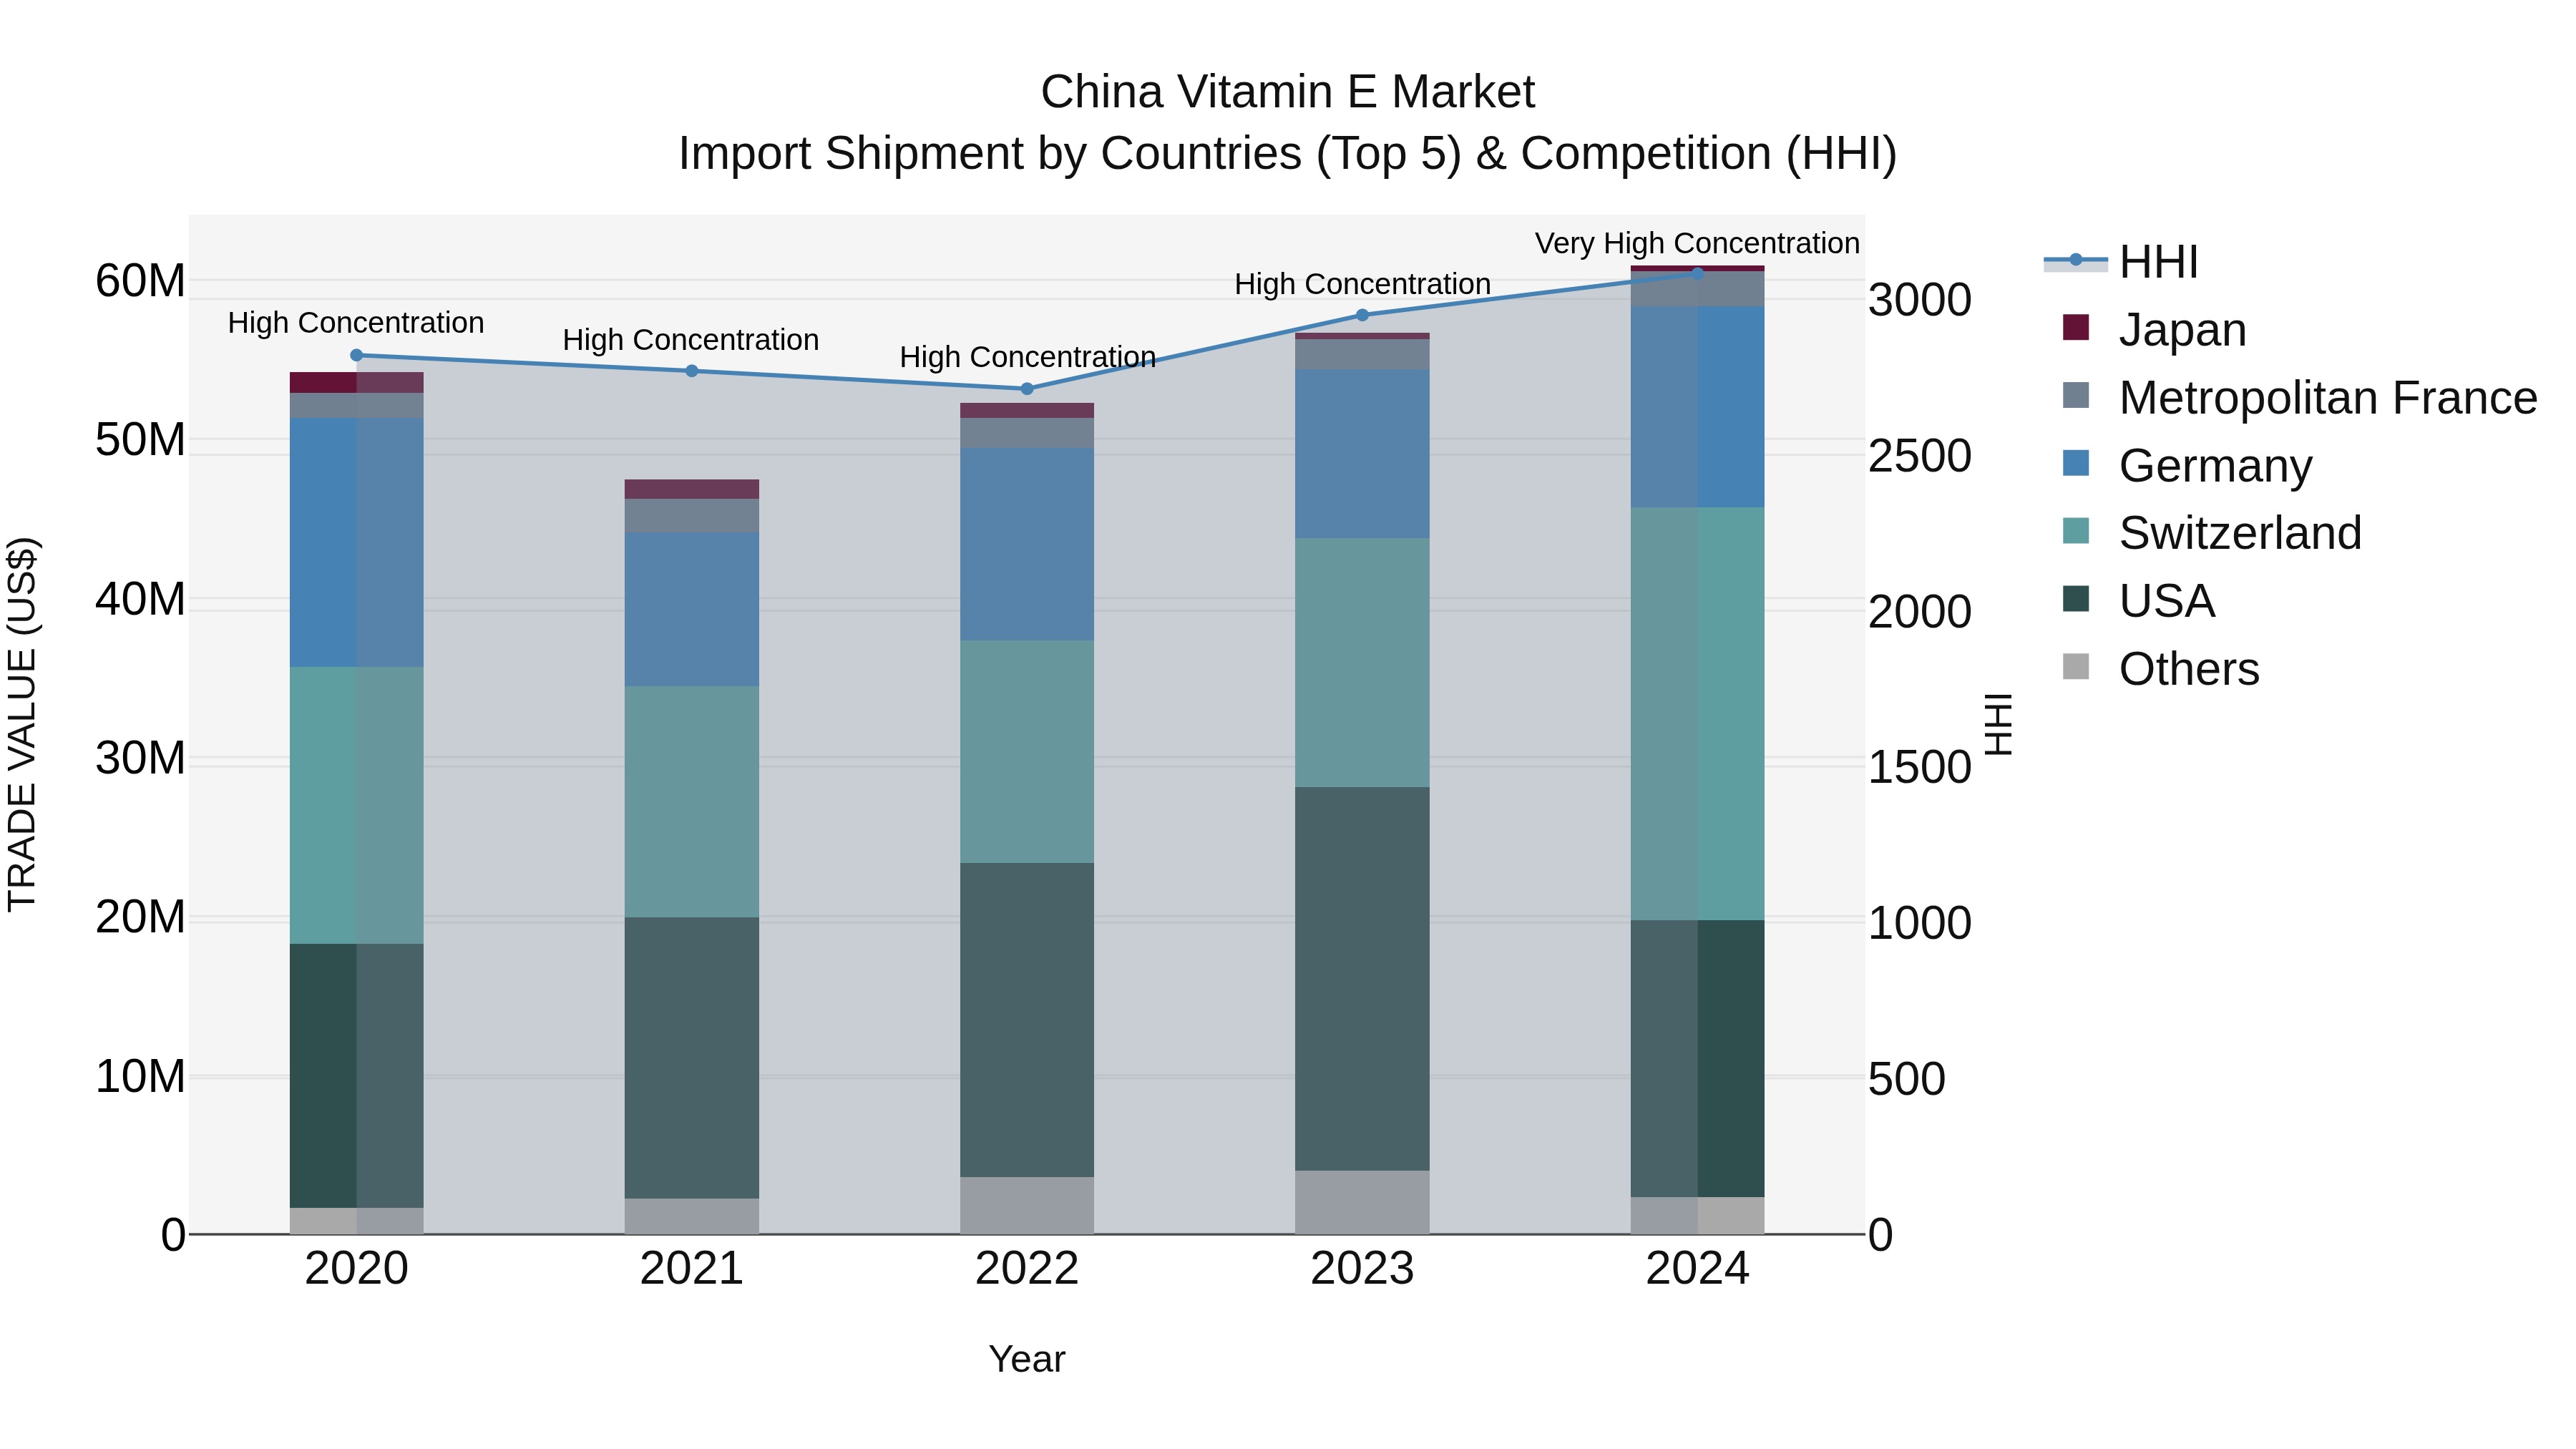
China Vitamin E Market Top 5 Importing Countries and Market Competition (HHI) Analysis
China import shipments of Vitamin E in 2024 show a notable increase in concentration, with the top exporting countries being Switzerland, USA, Germany, Metropolitan France, and China itself. The high concentration levels suggest a competitive market landscape dominated by key players. The Compound Annual Growth Rate (CAGR) from 2020 to 2024 stands at 2.94%, indicating steady growth, while the growth rate from 2023 to 2024 spiked at 7.48%, reflecting a surge in demand or supply chain dynamics. This data highlights evolving trends and dynamics within the global Vitamin E market, particularly in relation to China imports.
China Vitamin E Market Overview
The Vitamin E market in China is experiencing growth driven by its extensive applications in dietary supplements, cosmetics, and functional foods. Its antioxidant properties make it a popular ingredient in anti-aging and skincare products. The market benefits from rising health consciousness and increased spending on personal care products. However, the market is challenged by the availability of synthetic substitutes and fluctuations in raw material prices, which can affect product pricing and profitability.
Drivers of the market
The China Vitamin E Market is driven by its extensive use in the cosmetics and personal care industry due to its antioxidant properties. The growing demand for anti-aging and skin care products is a major factor driving the market. Additionally, the rising health awareness and the increasing use of Vitamin E in dietary supplements and fortified foods are contributing to the market`s expansion.
Challenges of the market
The Vitamin E market faces challenges related to the stability and bioavailability of Vitamin E products. There is also a high level of competition among manufacturers, which can drive down prices and impact profitability. Additionally, concerns over the potential for synthetic Vitamin E to cause health issues and the preference for natural sources can affect market trends.
Government Policy of the market
The Chinese government regulates the vitamin E market through both food safety standards and pharmaceutical regulations. The National Health Commission sets guidelines for the use of vitamin E in dietary supplements and food fortification. Policies include regulations on allowable concentrations and product claims. The government also monitors the market for compliance with safety standards, aiming to prevent adulteration and ensure that products meet health claims.
Key Highlights of the Report:
- China Vitamin E Market Outlook
- Market Size of China Vitamin E Market, 2024
- Forecast of China Vitamin E Market, 2031
- Historical Data and Forecast of China Vitamin E Revenues & Volume for the Period 2018 - 2031
- China Vitamin E Market Trend Evolution
- China Vitamin E Market Drivers and Challenges
- China Vitamin E Price Trends
- China Vitamin E Porter's Five Forces
- China Vitamin E Industry Life Cycle
- Historical Data and Forecast of China Vitamin E Market Revenues & Volume By Product Type for the Period 2018 - 2031
- Historical Data and Forecast of China Vitamin E Market Revenues & Volume By Natural for the Period 2018 - 2031
- Historical Data and Forecast of China Vitamin E Market Revenues & Volume By Synthetic for the Period 2018 - 2031
- Historical Data and Forecast of China Vitamin E Market Revenues & Volume By Application for the Period 2018 - 2031
- Historical Data and Forecast of China Vitamin E Market Revenues & Volume By Functional Food and Beverages for the Period 2018 - 2031
- Historical Data and Forecast of China Vitamin E Market Revenues & Volume By Pharmaceuticals and Dietary Supplements for the Period 2018 - 2031
- Historical Data and Forecast of China Vitamin E Market Revenues & Volume By Infant Nutrition for the Period 2018 - 2031
- Historical Data and Forecast of China Vitamin E Market Revenues & Volume By Pet Food & Animal Feed for the Period 2018 - 2031
- Historical Data and Forecast of China Vitamin E Market Revenues & Volume By Cosmetics for the Period 2018 - 2031
- China Vitamin E Import Export Trade Statistics
- Market Opportunity Assessment By Product Type
- Market Opportunity Assessment By Application
- China Vitamin E Top Companies Market Share
- China Vitamin E Competitive Benchmarking By Technical and Operational Parameters
- China Vitamin E Company Profiles
- China Vitamin E Key Strategic Recommendations
Frequently Asked Questions About the Market Study (FAQs):
6Wresearch actively monitors the China Vitamin E Market and publishes its comprehensive annual report, highlighting emerging trends, growth drivers, revenue analysis, and forecast outlook. Our insights help businesses to make data-backed strategic decisions with ongoing market dynamics. Our analysts track relevent industries related to the China Vitamin E Market, allowing our clients with actionable intelligence and reliable forecasts tailored to emerging regional needs.
Yes, we provide customisation as per your requirements. To learn more, feel free to contact us on sales@6wresearch.com
1 Executive Summary |
2 Introduction |
2.1 Key Highlights of the Report |
2.2 Report Description |
2.3 Market Scope & Segmentation |
2.4 Research Methodology |
2.5 Assumptions |
3 China Vitamin E Market Overview |
3.1 China Country Macro Economic Indicators |
3.2 China Vitamin E Market Revenues & Volume, 2021 & 2031F |
3.3 China Vitamin E Market - Industry Life Cycle |
3.4 China Vitamin E Market - Porter's Five Forces |
3.5 China Vitamin E Market Revenues & Volume Share, By Product Type, 2021 & 2031F |
3.6 China Vitamin E Market Revenues & Volume Share, By Application, 2021 & 2031F |
4 China Vitamin E Market Dynamics |
4.1 Impact Analysis |
4.2 Market Drivers |
4.2.1 Growing awareness about health and wellness among Chinese consumers leading to increased demand for vitamin E products. |
4.2.2 Rising disposable income levels in China, allowing consumers to spend more on healthcare and wellness products like vitamin E supplements. |
4.2.3 Strong focus on preventive healthcare measures in China, driving the consumption of vitamin E for its antioxidant properties. |
4.3 Market Restraints |
4.3.1 Stringent regulations and quality control measures in the Chinese market may hinder the entry of new players or products in the vitamin E segment. |
4.3.2 Fluctuations in raw material prices, such as soybean oil (a common source of vitamin E), can impact the production costs and pricing of vitamin E products. |
5 China Vitamin E Market Trends |
6 China Vitamin E Market, By Types |
6.1 China Vitamin E Market, By Product Type |
6.1.1 Overview and Analysis |
6.1.2 China Vitamin E Market Revenues & Volume, By Product Type, 2021-2031F |
6.1.3 China Vitamin E Market Revenues & Volume, By Natural, 2021-2031F |
6.1.4 China Vitamin E Market Revenues & Volume, By Synthetic, 2021-2031F |
6.2 China Vitamin E Market, By Application |
6.2.1 Overview and Analysis |
6.2.2 China Vitamin E Market Revenues & Volume, By Functional Food and Beverages, 2021-2031F |
6.2.3 China Vitamin E Market Revenues & Volume, By Pharmaceuticals and Dietary Supplements, 2021-2031F |
6.2.4 China Vitamin E Market Revenues & Volume, By Infant Nutrition, 2021-2031F |
6.2.5 China Vitamin E Market Revenues & Volume, By Pet Food & Animal Feed, 2021-2031F |
6.2.6 China Vitamin E Market Revenues & Volume, By Cosmetics, 2021-2031F |
7 China Vitamin E Market Import-Export Trade Statistics |
7.1 China Vitamin E Market Export to Major Countries |
7.2 China Vitamin E Market Imports from Major Countries |
8 China Vitamin E Market Key Performance Indicators |
8.1 Consumer awareness level about the benefits of vitamin E. |
8.2 Adoption rate of vitamin E supplements among different age groups in China. |
8.3 Number of new product launches or innovations in the vitamin E market in China. |
8.4 Market penetration of vitamin E products in tier 2 and tier 3 cities in China. |
8.5 Percentage of repeat purchases of vitamin E products by consumers in China. |
9 China Vitamin E Market - Opportunity Assessment |
9.1 China Vitamin E Market Opportunity Assessment, By Product Type, 2021 & 2031F |
9.2 China Vitamin E Market Opportunity Assessment, By Application, 2021 & 2031F |
10 China Vitamin E Market - Competitive Landscape |
10.1 China Vitamin E Market Revenue Share, By Companies, 2024 |
10.2 China Vitamin E Market Competitive Benchmarking, By Operating and Technical Parameters |
11 Company Profiles |
12 Recommendations |
13 Disclaimer |
Export potential assessment - trade Analytics for 2030
Export potential enables firms to identify high-growth global markets with greater confidence by combining advanced trade intelligence with a structured quantitative methodology. The framework analyzes emerging demand trends and country-level import patterns while integrating macroeconomic and trade datasets such as GDP and population forecasts, bilateral import–export flows, tariff structures, elasticity differentials between developed and developing economies, geographic distance, and import demand projections. Using weighted trade values from 2020–2024 as the base period to project country-to-country export potential for 2030, these inputs are operationalized through calculated drivers such as gravity model parameters, tariff impact factors, and projected GDP per-capita growth. Through an analysis of hidden potentials, demand hotspots, and market conditions that are most favorable to success, this method enables firms to focus on target countries, maximize returns, and global expansion with data, backed by accuracy.
By factoring in the projected importer demand gap that is currently unmet and could be potential opportunity, it identifies the potential for the Exporter (Country) among 190 countries, against the general trade analysis, which identifies the biggest importer or exporter.
To discover high-growth global markets and optimize your business strategy:
Click Here
Pricing
- Single User License$ 1,995
- Department License$ 2,400
- Site License$ 3,120
- Global License$ 3,795

Search
Thought Leadership and Analyst Meet


Our Clients
Related Reports
- India Switchgear Market Outlook (2026 - 2032) | Size, Share, Trends, Growth, Revenue, Forecast, Analysis, Value, Outlook
- Pakistan Contraceptive Implants Market (2025-2031) | Demand, Growth, Size, Share, Industry, Pricing Analysis, Competitive, Strategic Insights, Strategy, Consumer Insights, Analysis, Investment Trends, Opportunities, Revenue, Segments, Value, Segmentation, Supply, Forecast, Restraints, Outlook, Competition, Drivers, Trends, Companies, Challenges
- Sri Lanka Packaging Market (2026-2032) | Outlook, Competition, Drivers, Trends, Demand, Pricing Analysis, Competitive, Strategic Insights, Companies, Challenges, Strategy, Consumer Insights, Analysis, Investment Trends, Opportunities, Growth, Size, Share, Industry, Revenue, Segments, Value, Segmentation, Supply, Forecast, Restraints
- India Kids Watches Market (2026-2032) | Strategy, Consumer Insights, Analysis, Investment Trends, Opportunities, Growth, Size, Share, Industry, Revenue, Segments, Value, Segmentation, Supply, Forecast, Restraints, Outlook, Competition, Drivers, Trends, Demand, Pricing Analysis, Competitive, Strategic Insights, Companies, Challenges
- Saudi Arabia Core Assurance Service Market (2025-2031) | Strategy, Consumer Insights, Analysis, Investment Trends, Opportunities, Growth, Size, Share, Industry, Revenue, Segments, Value, Segmentation, Supply, Forecast, Restraints, Outlook, Competition, Drivers, Trends, Demand, Pricing Analysis, Competitive, Strategic Insights, Companies, Challenges
- Romania Uninterruptible Power Supply (UPS) Market (2026-2032) | Industry, Analysis, Revenue, Size, Forecast, Outlook, Value, Trends, Share, Growth & Companies
- Saudi Arabia Car Window Tinting Film, Paint Protection Film (PPF), and Ceramic Coating Market (2025-2031) | Strategy, Consumer Insights, Analysis, Investment Trends, Opportunities, Growth, Size, Share, Industry, Revenue, Segments, Value, Segmentation, Supply, Forecast, Restraints, Outlook, Competition, Drivers, Trends, Demand, Pricing Analysis, Competitive, Strategic Insights, Companies, Challenges
- South Africa Stationery Market (2025-2031) | Share, Size, Industry, Value, Growth, Revenue, Analysis, Trends, Segmentation & Outlook
- Afghanistan Rocking Chairs And Adirondack Chairs Market (2026-2032) | Size & Revenue, Competitive Landscape, Share, Segmentation, Industry, Value, Outlook, Analysis, Trends, Growth, Forecast, Companies
- Afghanistan Apparel Market (2026-2032) | Growth, Outlook, Industry, Segmentation, Forecast, Size, Companies, Trends, Value, Share, Analysis & Revenue
Industry Events and Analyst Meet

India EV Show 2026

EV tech India Expo 2026

Auto Tech Asia 2026

Battery Tech India 2026

Smart Production Solutions Guangzhou 2026
Whitepaper
- Middle East & Africa Commercial Security Market Click here to view more.
- Middle East & Africa Fire Safety Systems & Equipment Market Click here to view more.
- GCC Drone Market Click here to view more.
- Middle East Lighting Fixture Market Click here to view more.
- GCC Physical & Perimeter Security Market Click here to view more.
6WResearch In News
- Doha a strategic location for EV manufacturing hub: IPA Qatar
- Demand for luxury TVs surging in the GCC, says Samsung
- Empowering Growth: The Thriving Journey of Bangladesh’s Cable Industry
- Demand for luxury TVs surging in the GCC, says Samsung
- Video call with a traditional healer? Once unthinkable, it’s now common in South Africa
- Intelligent Buildings To Smooth GCC’s Path To Net Zero