Costa Rica Bio Fertilizer Market (2026-2032) | Industry, Analysis, Competition, Value, Consumer Insights, Segments, Opportunities, Outlook, Size, Demand, Strategic Insights, Segmentation, Supply, Share, Pricing Analysis, Revenue, Investment Trends, Forecast, Competitive, Challenges, Drivers, Growth, Companies, Strategy, Restraints, Trends
Market Forecast By Product Type (Nitrogen-Fixing, Phosphate-Solubilizing, Potash-Mobilizing), By Application (Soil Treatment, Crop Yield, Organic Farming), By End User (Farmers, Greenhouses, Agricultural Institutions), By Source (Biomass, Plant-Based, Microbial), By Environmental Impact (Sustainable Farming, Eco-Friendly, Reduced Chemical Use) And Competitive Landscape
| Product Code: ETC11460627 | Publication Date: Apr 2025 | Updated Date: Apr 2026 | Product Type: Market Research Report | |
| Publisher: 6Wresearch | No. of Pages: 65 | No. of Figures: 34 | No. of Tables: 19 | |
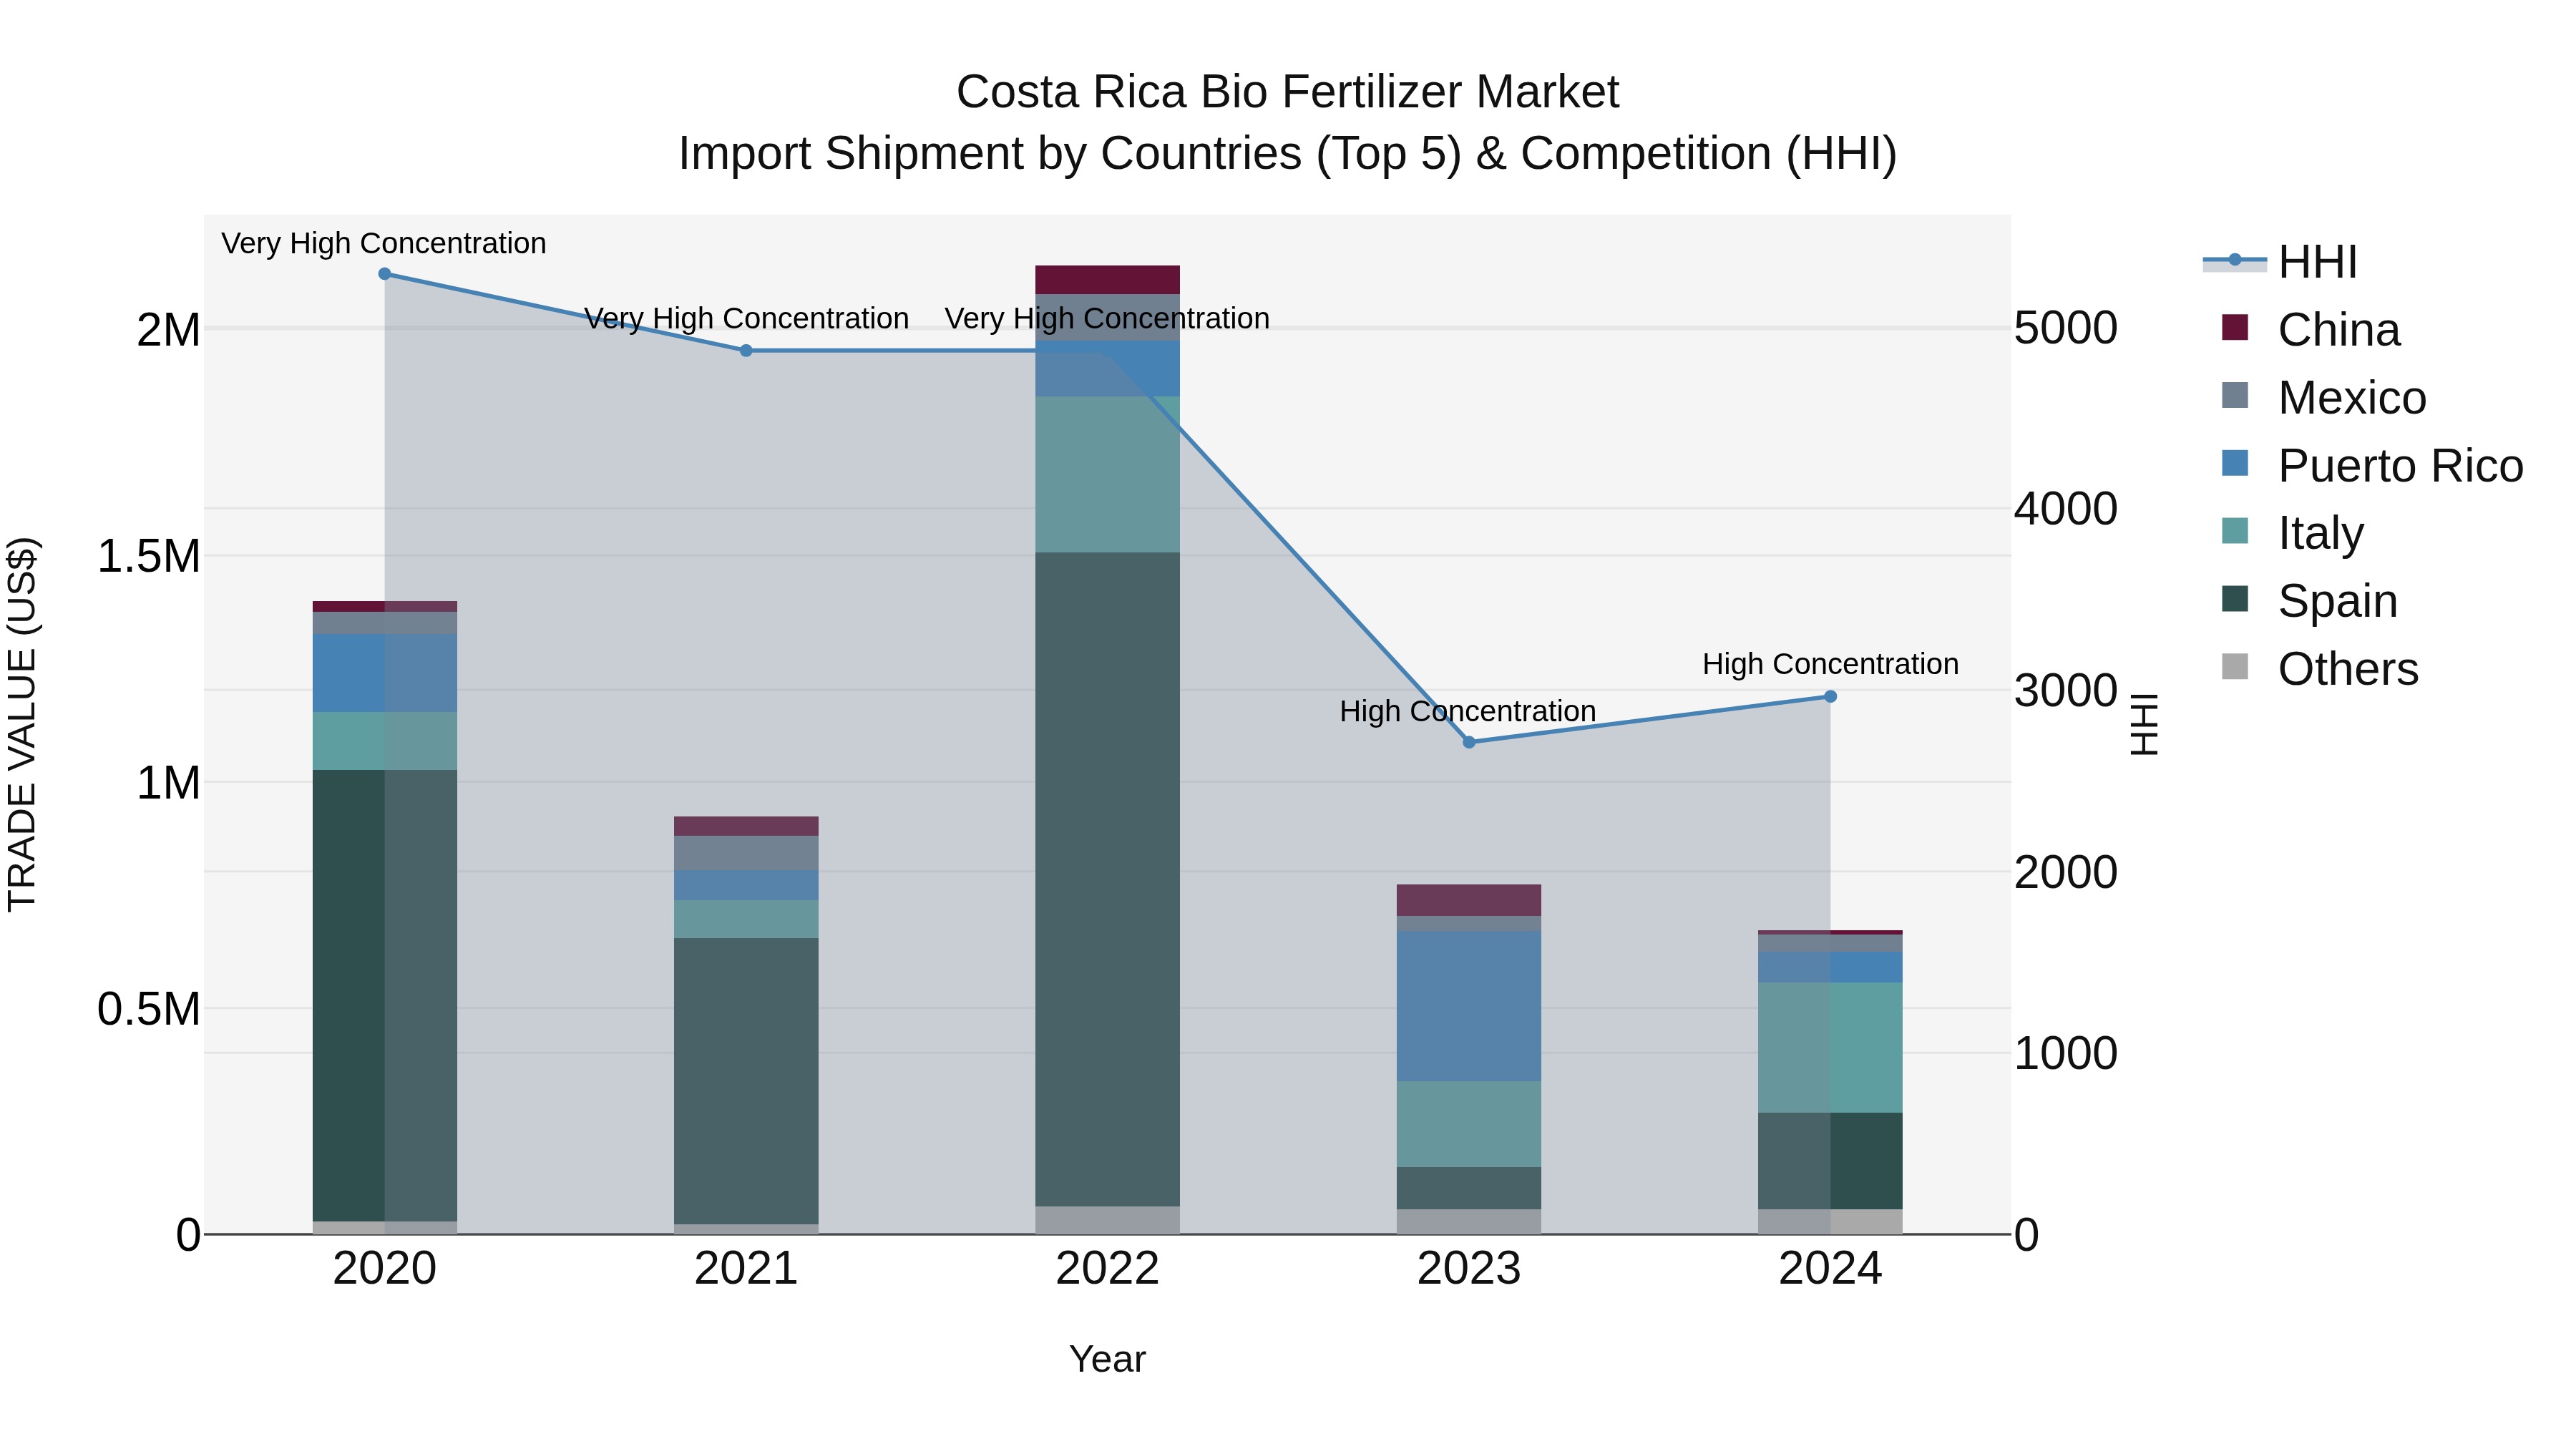
Costa Rica Bio Fertilizer Market: Top 5 Importing Countries and Market Competition (HHI) Analysis
Costa Rica bio fertilizer import market in 2024 continued to see a high concentration of shipments from top exporting countries such as Italy, Spain, Puerto Rico, Mexico, and Germany. Despite a negative compound annual growth rate (CAGR) of -16.74% from 2020 to 2024, the market experienced a slight improvement with a growth rate of -13.07% in 2024 compared to the previous year. The competitive landscape remains strong with these key exporting countries dominating the market.
Key Highlights of the Report:
- Costa Rica Bio Fertilizer Market Outlook
- Market Size of Costa Rica Bio Fertilizer Market, 2025
- Forecast of Costa Rica Bio Fertilizer Market, 2032
- Historical Data and Forecast of Costa Rica Bio Fertilizer Revenues & Volume for the Period 2022 - 2032F
- Costa Rica Bio Fertilizer Market Trend Evolution
- Costa Rica Bio Fertilizer Market Drivers and Challenges
- Costa Rica Bio Fertilizer Price Trends
- Costa Rica Bio Fertilizer Porter's Five Forces
- Costa Rica Bio Fertilizer Industry Life Cycle
- Historical Data and Forecast of Costa Rica Bio Fertilizer Market Revenues & Volume By Product Type for the Period 2022 - 2032F
- Historical Data and Forecast of Costa Rica Bio Fertilizer Market Revenues & Volume By Nitrogen-Fixing for the Period 2022 - 2032F
- Historical Data and Forecast of Costa Rica Bio Fertilizer Market Revenues & Volume By Phosphate-Solubilizing for the Period 2022 - 2032F
- Historical Data and Forecast of Costa Rica Bio Fertilizer Market Revenues & Volume By Potash-Mobilizing for the Period 2022 - 2032F
- Historical Data and Forecast of Costa Rica Bio Fertilizer Market Revenues & Volume By Application for the Period 2022 - 2032F
- Historical Data and Forecast of Costa Rica Bio Fertilizer Market Revenues & Volume By Soil Treatment for the Period 2022 - 2032F
- Historical Data and Forecast of Costa Rica Bio Fertilizer Market Revenues & Volume By Crop Yield for the Period 2022 - 2032F
- Historical Data and Forecast of Costa Rica Bio Fertilizer Market Revenues & Volume By Organic Farming for the Period 2022 - 2032F
- Historical Data and Forecast of Costa Rica Bio Fertilizer Market Revenues & Volume By End User for the Period 2022 - 2032F
- Historical Data and Forecast of Costa Rica Bio Fertilizer Market Revenues & Volume By Farmers for the Period 2022 - 2032F
- Historical Data and Forecast of Costa Rica Bio Fertilizer Market Revenues & Volume By Greenhouses for the Period 2022 - 2032F
- Historical Data and Forecast of Costa Rica Bio Fertilizer Market Revenues & Volume By Agricultural Institutions for the Period 2022 - 2032F
- Historical Data and Forecast of Costa Rica Bio Fertilizer Market Revenues & Volume By Source for the Period 2022 - 2032F
- Historical Data and Forecast of Costa Rica Bio Fertilizer Market Revenues & Volume By Biomass for the Period 2022 - 2032F
- Historical Data and Forecast of Costa Rica Bio Fertilizer Market Revenues & Volume By Plant-Based for the Period 2022 - 2032F
- Historical Data and Forecast of Costa Rica Bio Fertilizer Market Revenues & Volume By Microbial for the Period 2022 - 2032F
- Historical Data and Forecast of Costa Rica Bio Fertilizer Market Revenues & Volume By Environmental Impact for the Period 2022 - 2032F
- Historical Data and Forecast of Costa Rica Bio Fertilizer Market Revenues & Volume By Sustainable Farming for the Period 2022 - 2032F
- Historical Data and Forecast of Costa Rica Bio Fertilizer Market Revenues & Volume By Eco-Friendly for the Period 2022 - 2032F
- Historical Data and Forecast of Costa Rica Bio Fertilizer Market Revenues & Volume By Reduced Chemical Use for the Period 2022 - 2032F
- Costa Rica Bio Fertilizer Import Export Trade Statistics
- Market Opportunity Assessment By Product Type
- Market Opportunity Assessment By Application
- Market Opportunity Assessment By End User
- Market Opportunity Assessment By Source
- Market Opportunity Assessment By Environmental Impact
- Costa Rica Bio Fertilizer Top Companies Market Share
- Costa Rica Bio Fertilizer Competitive Benchmarking By Technical and Operational Parameters
- Costa Rica Bio Fertilizer Company Profiles
- Costa Rica Bio Fertilizer Key Strategic Recommendations
Frequently Asked Questions About the Market Study (FAQs):
6Wresearch actively monitors the Costa Rica Bio Fertilizer Market and publishes its comprehensive annual report, highlighting emerging trends, growth drivers, revenue analysis, and forecast outlook. Our insights help businesses to make data-backed strategic decisions with ongoing market dynamics. Our analysts track relevent industries related to the Costa Rica Bio Fertilizer Market, allowing our clients with actionable intelligence and reliable forecasts tailored to emerging regional needs.
Yes, we provide customisation as per your requirements. To learn more, feel free to contact us on sales@6wresearch.com
1 Executive Summary |
2 Introduction |
2.1 Key Highlights of the Report |
2.2 Report Description |
2.3 Market Scope & Segmentation |
2.4 Research Methodology |
2.5 Assumptions |
3 Costa Rica Bio Fertilizer Market Overview |
3.1 Costa Rica Country Macro Economic Indicators |
3.2 Costa Rica Bio Fertilizer Market Revenues & Volume, 2022 & 2032F |
3.3 Costa Rica Bio Fertilizer Market - Industry Life Cycle |
3.4 Costa Rica Bio Fertilizer Market - Porter's Five Forces |
3.5 Costa Rica Bio Fertilizer Market Revenues & Volume Share, By Product Type, 2022 & 2032F |
3.6 Costa Rica Bio Fertilizer Market Revenues & Volume Share, By Application, 2022 & 2032F |
3.7 Costa Rica Bio Fertilizer Market Revenues & Volume Share, By End User, 2022 & 2032F |
3.8 Costa Rica Bio Fertilizer Market Revenues & Volume Share, By Source, 2022 & 2032F |
3.9 Costa Rica Bio Fertilizer Market Revenues & Volume Share, By Environmental Impact, 2022 & 2032F |
4 Costa Rica Bio Fertilizer Market Dynamics |
4.1 Impact Analysis |
4.2 Market Drivers |
4.2.1 Increasing awareness about environmental sustainability and organic farming practices |
4.2.2 Government initiatives promoting the use of bio fertilizers as a sustainable agricultural practice |
4.2.3 Growing demand for organic food products in both domestic and international markets |
4.3 Market Restraints |
4.3.1 Lack of awareness and understanding among farmers about the benefits and application of bio fertilizers |
4.3.2 Initial high cost of bio fertilizers compared to conventional chemical fertilizers |
4.3.3 Limited availability and distribution channels for bio fertilizers in remote rural areas |
5 Costa Rica Bio Fertilizer Market Trends |
6 Costa Rica Bio Fertilizer Market, By Types |
6.1 Costa Rica Bio Fertilizer Market, By Product Type |
6.1.1 Overview and Analysis |
6.1.2 Costa Rica Bio Fertilizer Market Revenues & Volume, By Product Type, 2022 - 2032F |
6.1.3 Costa Rica Bio Fertilizer Market Revenues & Volume, By Nitrogen-Fixing, 2022 - 2032F |
6.1.4 Costa Rica Bio Fertilizer Market Revenues & Volume, By Phosphate-Solubilizing, 2022 - 2032F |
6.1.5 Costa Rica Bio Fertilizer Market Revenues & Volume, By Potash-Mobilizing, 2022 - 2032F |
6.2 Costa Rica Bio Fertilizer Market, By Application |
6.2.1 Overview and Analysis |
6.2.2 Costa Rica Bio Fertilizer Market Revenues & Volume, By Soil Treatment, 2022 - 2032F |
6.2.3 Costa Rica Bio Fertilizer Market Revenues & Volume, By Crop Yield, 2022 - 2032F |
6.2.4 Costa Rica Bio Fertilizer Market Revenues & Volume, By Organic Farming, 2022 - 2032F |
6.3 Costa Rica Bio Fertilizer Market, By End User |
6.3.1 Overview and Analysis |
6.3.2 Costa Rica Bio Fertilizer Market Revenues & Volume, By Farmers, 2022 - 2032F |
6.3.3 Costa Rica Bio Fertilizer Market Revenues & Volume, By Greenhouses, 2022 - 2032F |
6.3.4 Costa Rica Bio Fertilizer Market Revenues & Volume, By Agricultural Institutions, 2022 - 2032F |
6.4 Costa Rica Bio Fertilizer Market, By Source |
6.4.1 Overview and Analysis |
6.4.2 Costa Rica Bio Fertilizer Market Revenues & Volume, By Biomass, 2022 - 2032F |
6.4.3 Costa Rica Bio Fertilizer Market Revenues & Volume, By Plant-Based, 2022 - 2032F |
6.4.4 Costa Rica Bio Fertilizer Market Revenues & Volume, By Microbial, 2022 - 2032F |
6.5 Costa Rica Bio Fertilizer Market, By Environmental Impact |
6.5.1 Overview and Analysis |
6.5.2 Costa Rica Bio Fertilizer Market Revenues & Volume, By Sustainable Farming, 2022 - 2032F |
6.5.3 Costa Rica Bio Fertilizer Market Revenues & Volume, By Eco-Friendly, 2022 - 2032F |
6.5.4 Costa Rica Bio Fertilizer Market Revenues & Volume, By Reduced Chemical Use, 2022 - 2032F |
7 Costa Rica Bio Fertilizer Market Import-Export Trade Statistics |
7.1 Costa Rica Bio Fertilizer Market Export to Major Countries |
7.2 Costa Rica Bio Fertilizer Market Imports from Major Countries |
8 Costa Rica Bio Fertilizer Market Key Performance Indicators |
8.1 Percentage increase in the adoption of bio fertilizers by farmers across different regions in Costa Rica |
8.2 Number of new government policies or programs supporting the use of bio fertilizers in agriculture |
8.3 Growth in the number of certified organic farms using bio fertilizers |
8.4 Improvement in soil health and crop yield in areas where bio fertilizers are extensively used |
8.5 Increase in the number of research studies and collaborations focused on developing new bio fertilizer products and technologies |
9 Costa Rica Bio Fertilizer Market - Opportunity Assessment |
9.1 Costa Rica Bio Fertilizer Market Opportunity Assessment, By Product Type, 2022 & 2032F |
9.2 Costa Rica Bio Fertilizer Market Opportunity Assessment, By Application, 2022 & 2032F |
9.3 Costa Rica Bio Fertilizer Market Opportunity Assessment, By End User, 2022 & 2032F |
9.4 Costa Rica Bio Fertilizer Market Opportunity Assessment, By Source, 2022 & 2032F |
9.5 Costa Rica Bio Fertilizer Market Opportunity Assessment, By Environmental Impact, 2022 & 2032F |
10 Costa Rica Bio Fertilizer Market - Competitive Landscape |
10.1 Costa Rica Bio Fertilizer Market Revenue Share, By Companies, 2025 |
10.2 Costa Rica Bio Fertilizer Market Competitive Benchmarking, By Operating and Technical Parameters |
11 Company Profiles |
12 Recommendations |
13 Disclaimer |
Export potential assessment - trade Analytics for 2030
Export potential enables firms to identify high-growth global markets with greater confidence by combining advanced trade intelligence with a structured quantitative methodology. The framework analyzes emerging demand trends and country-level import patterns while integrating macroeconomic and trade datasets such as GDP and population forecasts, bilateral import–export flows, tariff structures, elasticity differentials between developed and developing economies, geographic distance, and import demand projections. Using weighted trade values from 2020–2024 as the base period to project country-to-country export potential for 2030, these inputs are operationalized through calculated drivers such as gravity model parameters, tariff impact factors, and projected GDP per-capita growth. Through an analysis of hidden potentials, demand hotspots, and market conditions that are most favorable to success, this method enables firms to focus on target countries, maximize returns, and global expansion with data, backed by accuracy.
By factoring in the projected importer demand gap that is currently unmet and could be potential opportunity, it identifies the potential for the Exporter (Country) among 190 countries, against the general trade analysis, which identifies the biggest importer or exporter.
To discover high-growth global markets and optimize your business strategy:
Click Here
Pricing
- Single User License$ 1,995
- Department License$ 2,400
- Site License$ 3,120
- Global License$ 3,795

Search
Thought Leadership and Analyst Meet


Our Clients
Latest Reports
- Philippines Polyhydroxybutyrate-co-Hydroxyvalerate Market (2026-2032) | Trends, Insights, Challenges, Restraints, Competition, Size, Value, Forecast, Pricing, Share, Outlook, Revenue, Investment Opportunities, Strategy, Drivers, Demand, Growth, segmentation, Analysis, Companies
- Peru Polyhydroxybutyrate-co-Hydroxyvalerate Market (2026-2032) | Growth, Demand, Challenges, Share, Trends, Analysis, Pricing, Investment Opportunities, Drivers, Value, Forecast, Competition, Size, Companies, Insights, Outlook, Restraints, segmentation, Revenue, Strategy
- Pakistan Polyhydroxybutyrate-co-Hydroxyvalerate Market (2026-2032) | Restraints, segmentation, Pricing, Forecast, Share, Strategy, Competition, Trends, Insights, Drivers, Challenges, Growth, Revenue, Outlook, Value, Investment Opportunities, Companies, Size, Analysis, Demand
- Oman Polyhydroxybutyrate-co-Hydroxyvalerate Market (2026-2032) | Drivers, segmentation, Insights, Competition, Pricing, Outlook, Size, Revenue, Challenges, Forecast, Analysis, Growth, Value, Share, Trends, Investment Opportunities, Strategy, Restraints, Companies, Demand
- Nigeria Polyhydroxybutyrate-co-Hydroxyvalerate Market (2026-2032) | Value, Investment Opportunities, Analysis, Revenue, Restraints, Pricing, Outlook, Competition, Demand, Growth, Forecast, Companies, Trends, Challenges, segmentation, Drivers, Insights, Share, Size, Strategy
- Nepal Polyhydroxybutyrate-co-Hydroxyvalerate Market (2026-2032) | Insights, Analysis, Drivers, Share, Revenue, Demand, segmentation, Investment Opportunities, Competition, Forecast, Growth, Pricing, Companies, Strategy, Trends, Restraints, Challenges, Outlook, Size, Value
- Myanmar Polyhydroxybutyrate-co-Hydroxyvalerate Market (2026-2032) | Outlook, Revenue, Strategy, Restraints, Drivers, segmentation, Share, Forecast, Competition, Insights, Growth, Pricing, Size, Demand, Value, Companies, Trends, Challenges, Investment Opportunities, Analysis
- Morocco Polyhydroxybutyrate-co-Hydroxyvalerate Market (2026-2032) | Outlook, Investment Opportunities, Restraints, Strategy, Forecast, Challenges, Drivers, Growth, Companies, segmentation, Trends, Size, Competition, Revenue, Demand, Insights, Share, Analysis, Value, Pricing
- Mexico Polyhydroxybutyrate-co-Hydroxyvalerate Market (2026-2032) | Size, Drivers, Outlook, Share, Strategy, Growth, Pricing, Challenges, Companies, Demand, Value, Investment Opportunities, Restraints, Trends, Forecast, segmentation, Analysis, Insights, Competition, Revenue
- Malaysia Polyhydroxybutyrate-co-Hydroxyvalerate Market (2026-2032) | Share, segmentation, Size, Companies, Analysis, Insights, Forecast, Value, Revenue, Drivers, Restraints, Challenges, Investment Opportunities, Trends, Competition, Strategy, Demand, Growth, Outlook, Pricing
Industry Events and Analyst Meet

HIMTEX 2026

India Refining Summit 2026

India EV Show 2026

EV tech India Expo 2026

Auto Tech Asia 2026
Whitepaper
- Middle East & Africa Commercial Security Market Click here to view more.
- Middle East & Africa Fire Safety Systems & Equipment Market Click here to view more.
- GCC Drone Market Click here to view more.
- Middle East Lighting Fixture Market Click here to view more.
- GCC Physical & Perimeter Security Market Click here to view more.
6WResearch In News
- Doha a strategic location for EV manufacturing hub: IPA Qatar
- Demand for luxury TVs surging in the GCC, says Samsung
- Empowering Growth: The Thriving Journey of Bangladesh’s Cable Industry
- Demand for luxury TVs surging in the GCC, says Samsung
- Video call with a traditional healer? Once unthinkable, it’s now common in South Africa
- Intelligent Buildings To Smooth GCC’s Path To Net Zero