Croatia Action Figures Market (2026-2032) | Trends, Share, Value, Companies, Competitive Landscape, Size & Revenue, Forecast, Industry, Segmentation, Growth, Outlook, Analysis
Market Forecast By Type (Superheroes, Anime Characters, Movie Characters), By Distribution Channel (Online, Offline), By End Users (Up to 8 years, 9-15 years, 15 years and Above) And Competitive Landscape
| Product Code: ETC6843792 | Publication Date: Sep 2024 | Updated Date: Apr 2026 | Product Type: Market Research Report | |
| Publisher: 6Wresearch | Author: Sumit Sagar | No. of Pages: 75 | No. of Figures: 35 | No. of Tables: 20 |
Croatia Action Figures Market Size (2020-2030)
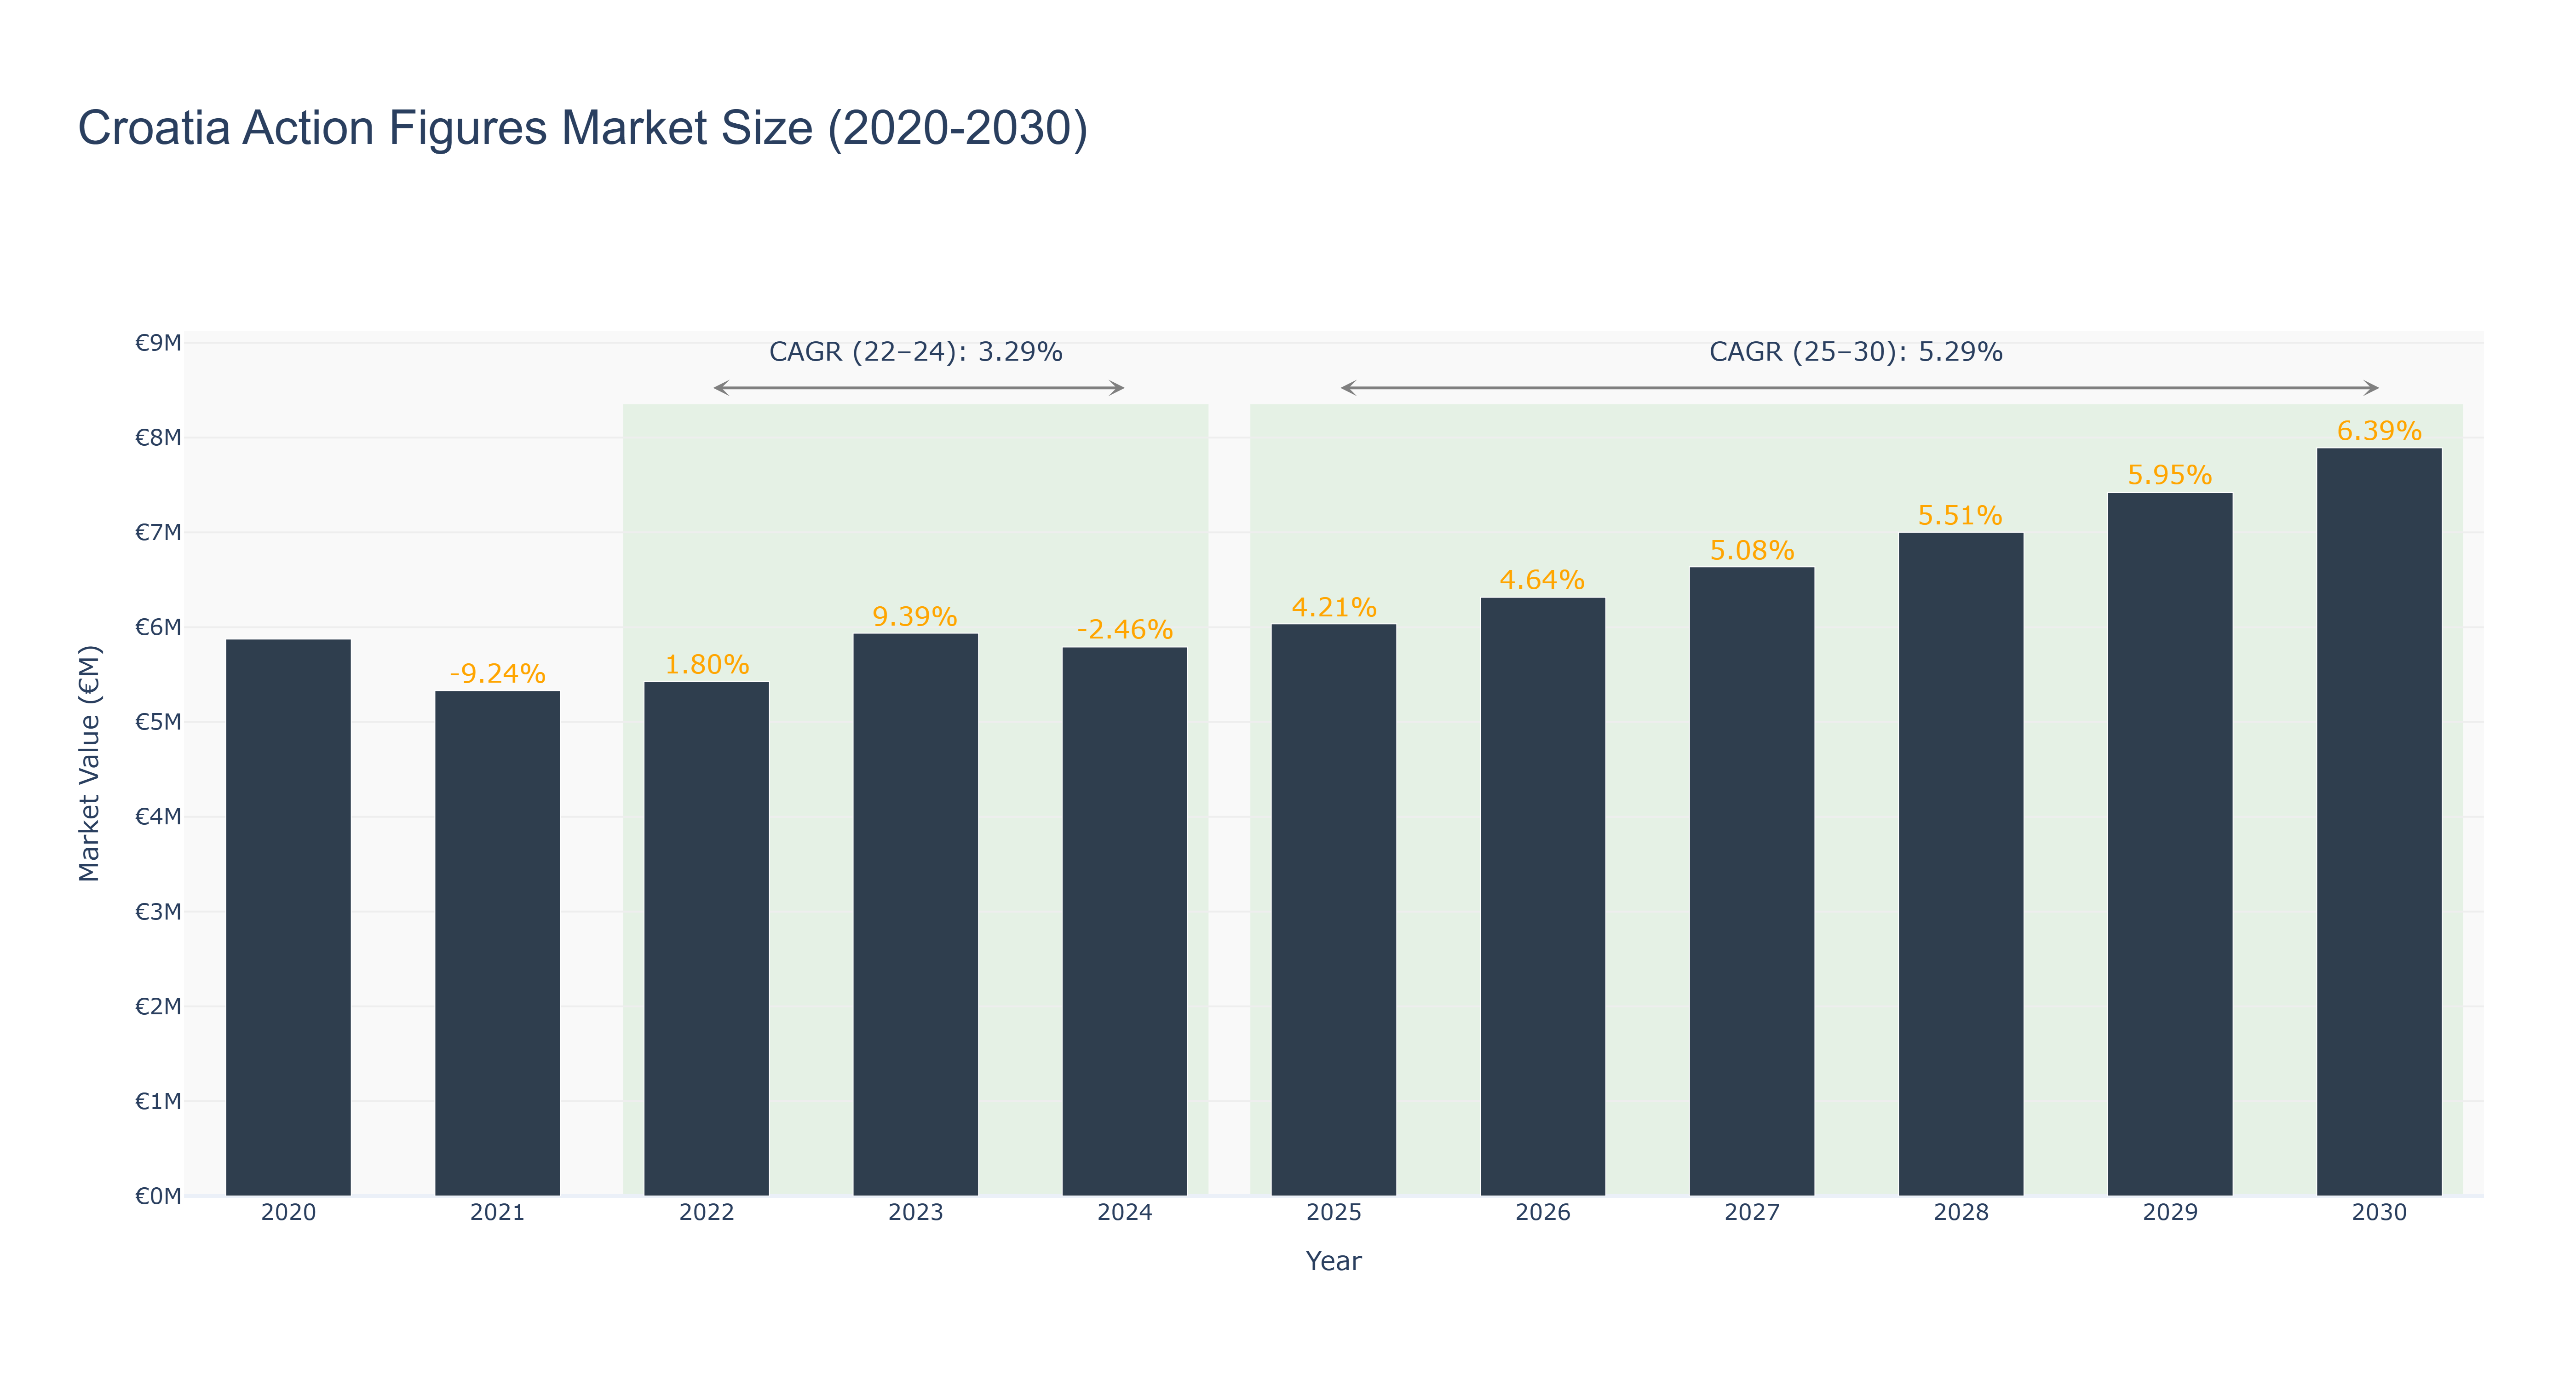
Croatia's Action Figures Market has shown a steady growth trajectory over the past decade. The market reached its peak size of €7.89 million in 2030, with a consistent increase in market size from 2020 to 2030. Notable growth spurts were observed from 2023 onwards, driven by factors such as increased consumer demand for collectibles and the market's ability to innovate with new product offerings. The market experienced a slight dip in 2024, potentially influenced by external economic factors. Looking ahead, the market is projected to maintain a healthy growth rate, with a CAGR of 5.29% from 2025 to 2030. Recent developments indicate a focus on expanding product lines to cater to a broader audience, coupled with strategic marketing initiatives to boost consumer engagement and brand loyalty. Industry drivers include a growing interest in pop culture and nostalgia, driving demand for action figures among consumers of all ages.
Croatia Action Figures Market: Production & Trade Performance (2019-2025)
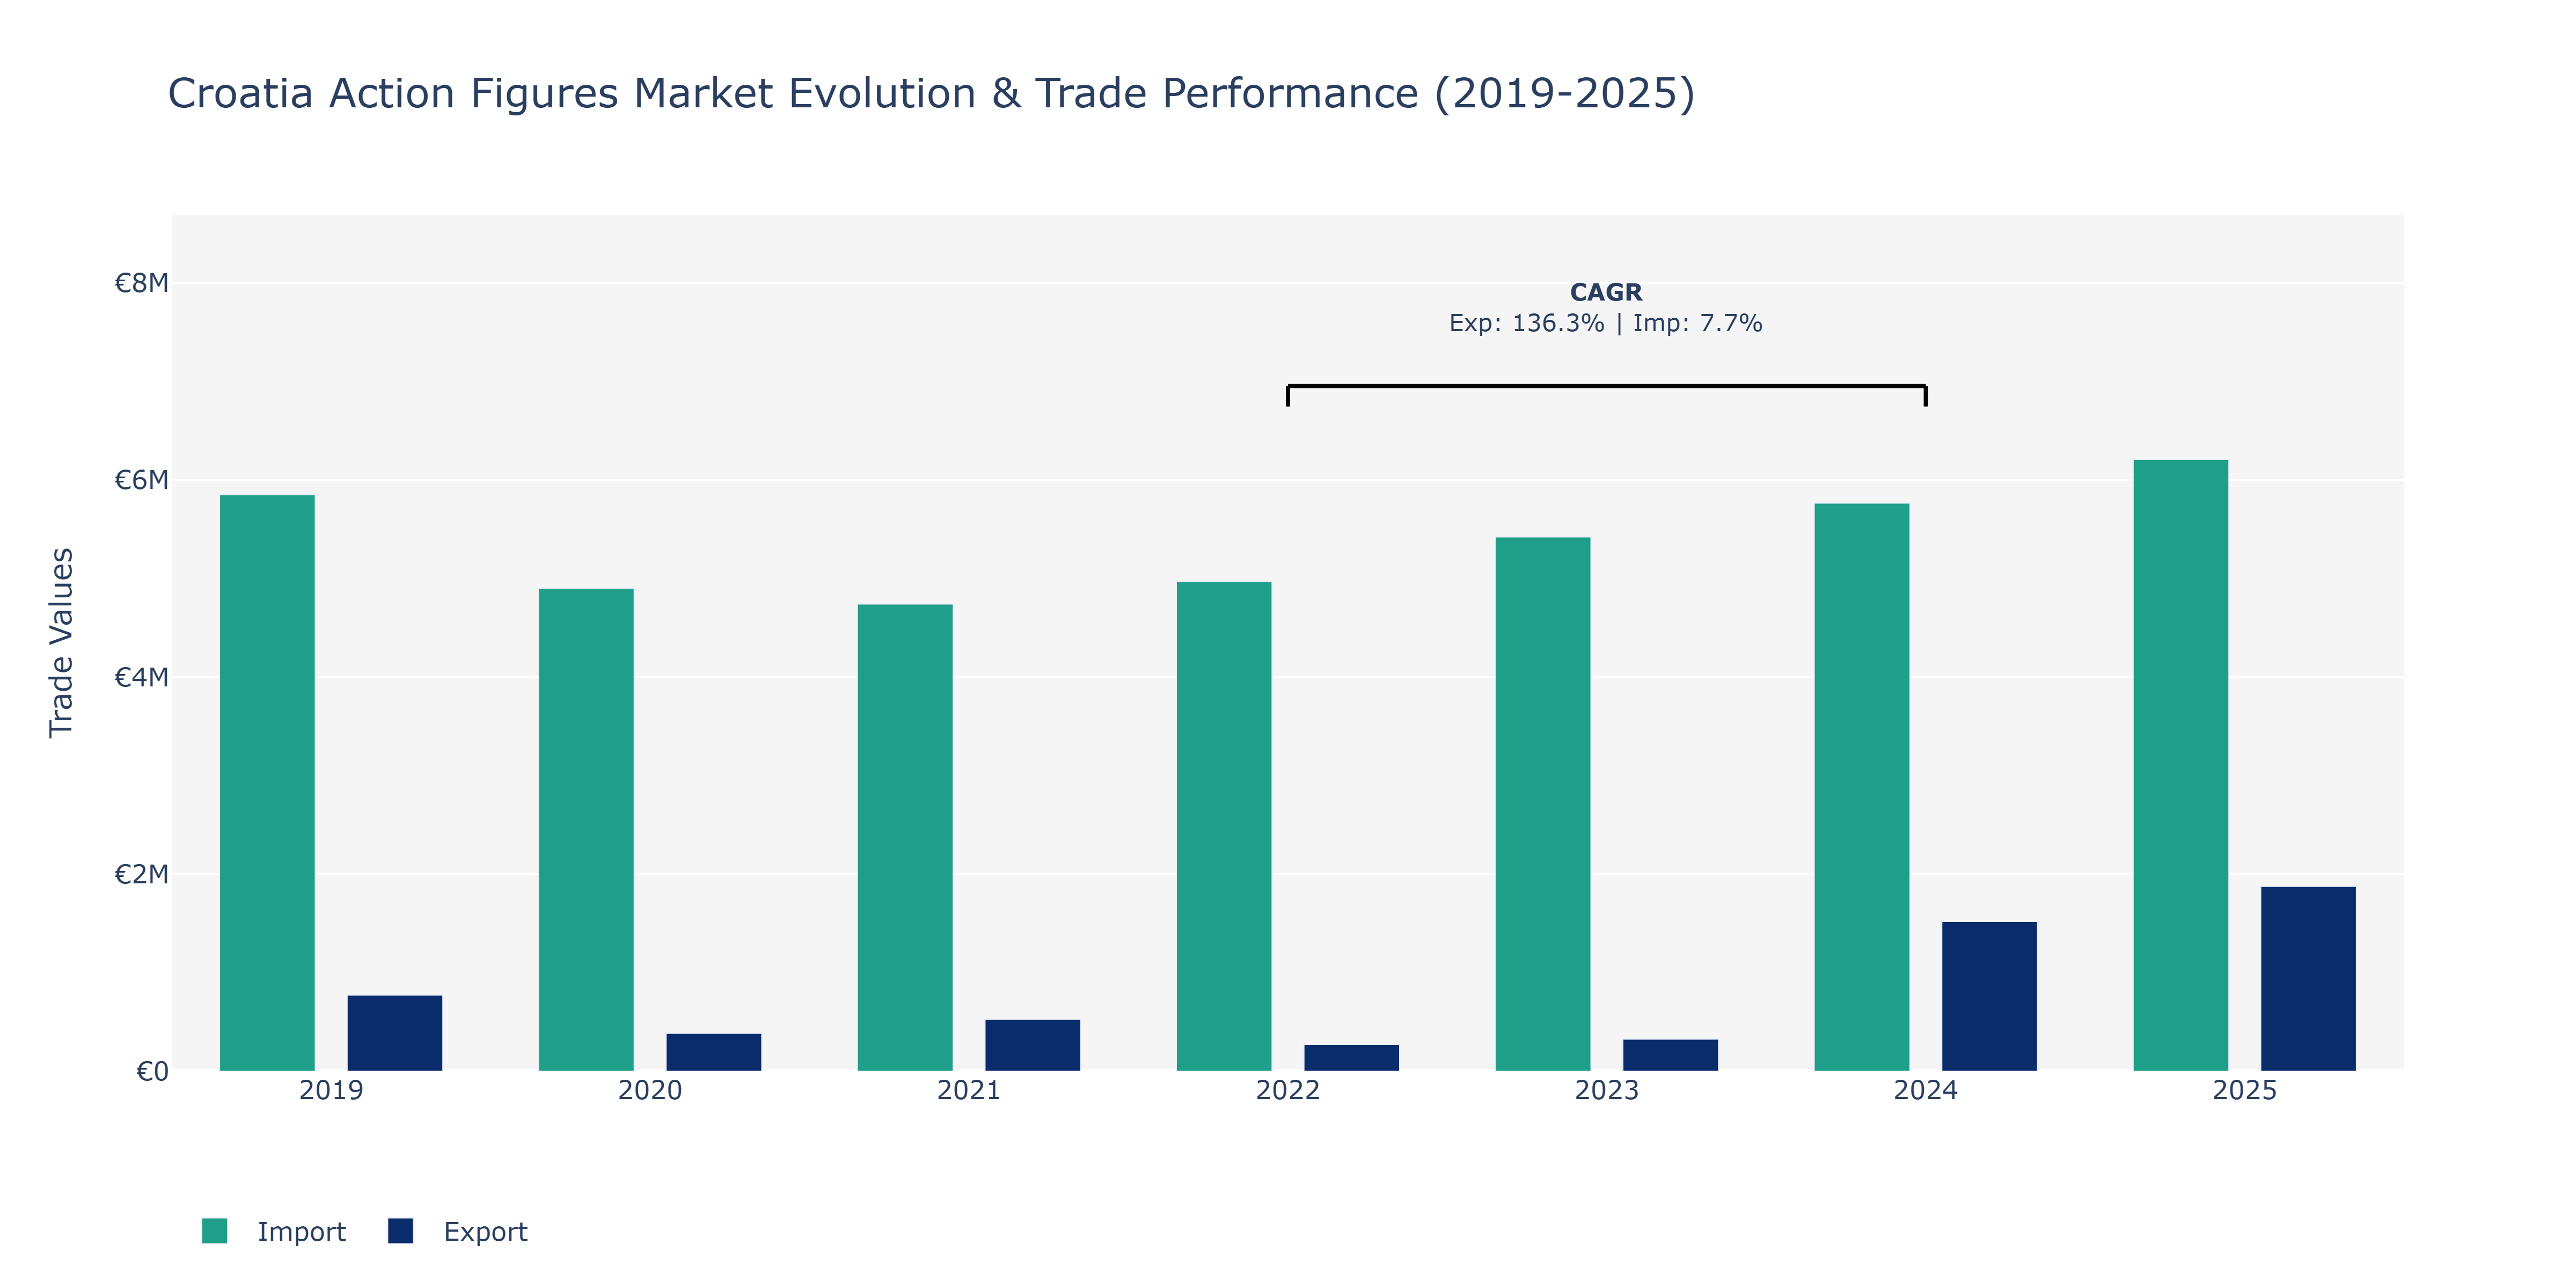
Between 2019 and 2025, Croatia's Action Figures Market experienced dynamic shifts in both exports and imports. Exports showed a downward trend from 2019 to 2022, reaching their lowest point at €272.31 thousand before rebounding significantly in 2024 to €1.52 million and further increasing to €1.88 million in 2025. In contrast, imports fluctuated, hitting a peak in 2025 at €6.21 million after a slight decrease in 2021. The market's export growth can be attributed to strategic marketing initiatives by Croatian manufacturers, new product launches, and increased international demand for unique action figures. Imports surged in 2025 due to a growing preference for imported high-quality action figures among Croatian consumers, indicating a shift towards more diverse offerings in the domestic market. These trends underline Croatia's evolving position in the global action figures landscape, fostering both domestic production and international trade partnerships.
Key Highlights of the Report:
- Croatia Action Figures Market Outlook
- Market Size of Croatia Action Figures Market, 2025
- Forecast of Croatia Action Figures Market, 2032
- Historical Data and Forecast of Croatia Action Figures Revenues & Volume for the Period 2022 - 2032
- Croatia Action Figures Market Trend Evolution
- Croatia Action Figures Market Drivers and Challenges
- Croatia Action Figures Price Trends
- Croatia Action Figures Porter's Five Forces
- Croatia Action Figures Industry Life Cycle
- Historical Data and Forecast of Croatia Action Figures Market Revenues & Volume By Type for the Period 2022 - 2032
- Historical Data and Forecast of Croatia Action Figures Market Revenues & Volume By Superheroes for the Period 2022 - 2032
- Historical Data and Forecast of Croatia Action Figures Market Revenues & Volume By Anime Characters for the Period 2022 - 2032
- Historical Data and Forecast of Croatia Action Figures Market Revenues & Volume By Movie Characters for the Period 2022 - 2032
- Historical Data and Forecast of Croatia Action Figures Market Revenues & Volume By Distribution Channel for the Period 2022 - 2032
- Historical Data and Forecast of Croatia Action Figures Market Revenues & Volume By Online for the Period 2022 - 2032
- Historical Data and Forecast of Croatia Action Figures Market Revenues & Volume By Offline for the Period 2022 - 2032
- Historical Data and Forecast of Croatia Action Figures Market Revenues & Volume By End Users for the Period 2022 - 2032
- Historical Data and Forecast of Croatia Action Figures Market Revenues & Volume By Up to 8 years for the Period 2022 - 2032
- Historical Data and Forecast of Croatia Action Figures Market Revenues & Volume By 9-15 years for the Period 2022 - 2032
- Historical Data and Forecast of Croatia Action Figures Market Revenues & Volume By 15 years and Above for the Period 2022 - 2032
- Croatia Action Figures Import Export Trade Statistics
- Market Opportunity Assessment By Type
- Market Opportunity Assessment By Distribution Channel
- Market Opportunity Assessment By End Users
- Croatia Action Figures Top Companies Market Share
- Croatia Action Figures Competitive Benchmarking By Technical and Operational Parameters
- Croatia Action Figures Company Profiles
- Croatia Action Figures Key Strategic Recommendations
Frequently Asked Questions About the Market Study (FAQs):
6Wresearch actively monitors the Croatia Action Figures Market and publishes its comprehensive annual report, highlighting emerging trends, growth drivers, revenue analysis, and forecast outlook. Our insights help businesses to make data-backed strategic decisions with ongoing market dynamics. Our analysts track relevent industries related to the Croatia Action Figures Market, allowing our clients with actionable intelligence and reliable forecasts tailored to emerging regional needs.
Yes, we provide customisation as per your requirements. To learn more, feel free to contact us on sales@6wresearch.com
1 Executive Summary |
2 Introduction |
2.1 Key Highlights of the Report |
2.2 Report Description |
2.3 Market Scope & Segmentation |
2.4 Research Methodology |
2.5 Assumptions |
3 Croatia Action Figures Market Overview |
3.1 Croatia Country Macro Economic Indicators |
3.2 Croatia Action Figures Market Revenues & Volume, 2022 & 2032F |
3.3 Croatia Action Figures Market - Industry Life Cycle |
3.4 Croatia Action Figures Market - Porter's Five Forces |
3.5 Croatia Action Figures Market Revenues & Volume Share, By Type, 2022 & 2032F |
3.6 Croatia Action Figures Market Revenues & Volume Share, By Distribution Channel, 2022 & 2032F |
3.7 Croatia Action Figures Market Revenues & Volume Share, By End Users, 2022 & 2032F |
4 Croatia Action Figures Market Dynamics |
4.1 Impact Analysis |
4.2 Market Drivers |
4.2.1 Growing popularity of action figures among children and collectors in Croatia |
4.2.2 Increasing demand for action figures based on popular movies, TV shows, and video games |
4.2.3 Rising disposable income and spending power of consumers in Croatia |
4.3 Market Restraints |
4.3.1 Competition from alternative forms of entertainment such as video games and digital media |
4.3.2 Fluctuations in currency exchange rates affecting import prices of action figures |
4.3.3 Limited availability of licensed action figures in the Croatian market |
5 Croatia Action Figures Market Trends |
6 Croatia Action Figures Market, By Types |
6.1 Croatia Action Figures Market, By Type |
6.1.1 Overview and Analysis |
6.1.2 Croatia Action Figures Market Revenues & Volume, By Type, 2022 - 2032F |
6.1.3 Croatia Action Figures Market Revenues & Volume, By Superheroes, 2022 - 2032F |
6.1.4 Croatia Action Figures Market Revenues & Volume, By Anime Characters, 2022 - 2032F |
6.1.5 Croatia Action Figures Market Revenues & Volume, By Movie Characters, 2022 - 2032F |
6.2 Croatia Action Figures Market, By Distribution Channel |
6.2.1 Overview and Analysis |
6.2.2 Croatia Action Figures Market Revenues & Volume, By Online, 2022 - 2032F |
6.2.3 Croatia Action Figures Market Revenues & Volume, By Offline, 2022 - 2032F |
6.3 Croatia Action Figures Market, By End Users |
6.3.1 Overview and Analysis |
6.3.2 Croatia Action Figures Market Revenues & Volume, By Up to 8 years, 2022 - 2032F |
6.3.3 Croatia Action Figures Market Revenues & Volume, By 9-15 years, 2022 - 2032F |
6.3.4 Croatia Action Figures Market Revenues & Volume, By 15 years and Above, 2022 - 2032F |
7 Croatia Action Figures Market Import-Export Trade Statistics |
7.1 Croatia Action Figures Market Export to Major Countries |
7.2 Croatia Action Figures Market Imports from Major Countries |
8 Croatia Action Figures Market Key Performance Indicators |
8.1 Number of new action figure releases in the Croatian market |
8.2 Percentage of licensed action figures in the overall product range |
8.3 Growth in online searches and social media mentions related to action figures in Croatia |
9 Croatia Action Figures Market - Opportunity Assessment |
9.1 Croatia Action Figures Market Opportunity Assessment, By Type, 2022 & 2032F |
9.2 Croatia Action Figures Market Opportunity Assessment, By Distribution Channel, 2022 & 2032F |
9.3 Croatia Action Figures Market Opportunity Assessment, By End Users, 2022 & 2032F |
10 Croatia Action Figures Market - Competitive Landscape |
10.1 Croatia Action Figures Market Revenue Share, By Companies, 2025 |
10.2 Croatia Action Figures Market Competitive Benchmarking, By Operating and Technical Parameters |
11 Company Profiles |
12 Recommendations |
13 Disclaimer |
Global Go To Market Strategy - 2030
Export potential enables firms to identify high-growth global markets with greater confidence by combining advanced trade intelligence with a structured quantitative methodology. The framework analyzes emerging demand trends and country-level import patterns while integrating macroeconomic and trade datasets such as GDP and population forecasts, bilateral import–export flows, tariff structures, elasticity differentials between developed and developing economies, geographic distance, and import demand projections. Using weighted trade values from 2020–2024 as the base period to project country-to-country export potential for 2030, these inputs are operationalized through calculated drivers such as gravity model parameters, tariff impact factors, and projected GDP per-capita growth. Through an analysis of hidden potentials, demand hotspots, and market conditions that are most favorable to success, this method enables firms to focus on target countries, maximize returns, and global expansion with data, backed by accuracy.
By factoring in the projected importer demand gap that is currently unmet and could be potential opportunity, it identifies the potential for the Exporter (Country) among 190 countries, against the general trade analysis, which identifies the biggest importer or exporter.
To discover high-growth global markets and optimize your business strategy:
Click Here
Pricing
- Single User License$ 1,995
- Department License$ 2,400
- Site License$ 3,120
- Global License$ 3,795

Leadership Perspectives from Industry Events
Search
Thought Leadership and Analyst Meet


Our Clients
6WResearch In News
- India Export Attractiveness Tracker 2026
- India Air Conditioner Market Set for Strong Rebound in 2026 After Weather-Led Correction and GST-Driven Recovery: 6Wresearch
- ADAS in India: How Automatic Emergency Braking, Blind Spot Detection & Driver Monitoring are Transforming Road Safety
- Doha a strategic location for EV manufacturing hub: IPA Qatar
- Demand for luxury TVs surging in the GCC, says Samsung
- Empowering Growth: The Thriving Journey of Bangladesh’s Cable Industry
Latest Reports
- Nicaragua RPG Gaming Market (2026-2032)
- New Zealand RPG Gaming Market (2026-2032)
- Netherlands RPG Gaming Market (2026-2032)
- Nauru RPG Gaming Market (2026-2032)
- Namibia RPG Gaming Market (2026-2032)
- Mozambique RPG Gaming Market (2026-2032)
- Montenegro RPG Gaming Market (2026-2032)
- Mongolia RPG Gaming Market (2026-2032)
- Monaco RPG Gaming Market (2026-2032)
- Micronesia RPG Gaming Market (2026-2032)
Industry Events and Analyst Meet

EV India Expo 2026

HIMTEX 2026

India Refining Summit 2026

India EV Show 2026

EV tech India Expo 2026
Whitepaper
- Middle East & Africa Commercial Security Market Click here to view more.
- Middle East & Africa Fire Safety Systems & Equipment Market Click here to view more.
- GCC Drone Market Click here to view more.
- Middle East Lighting Fixture Market Click here to view more.
- GCC Physical & Perimeter Security Market Click here to view more.