Croatia Activated Bleaching Earth Market (2026-2032) | Outlook, Companies, Trends, Value, Size & Revenue, Growth, Analysis, Industry, Forecast, Competitive Landscape, Share, Segmentation
Market Forecast By Application (Edible Oil & Fats, Mineral Oil & Lubricants) And Competitive Landscape
| Product Code: ETC6843794 | Publication Date: Sep 2024 | Updated Date: Apr 2026 | Product Type: Market Research Report | |
| Publisher: 6Wresearch | Author: Sumit Sagar | No. of Pages: 75 | No. of Figures: 35 | No. of Tables: 20 |
Croatia Activated Bleaching Earth Market Size (2020-2030)
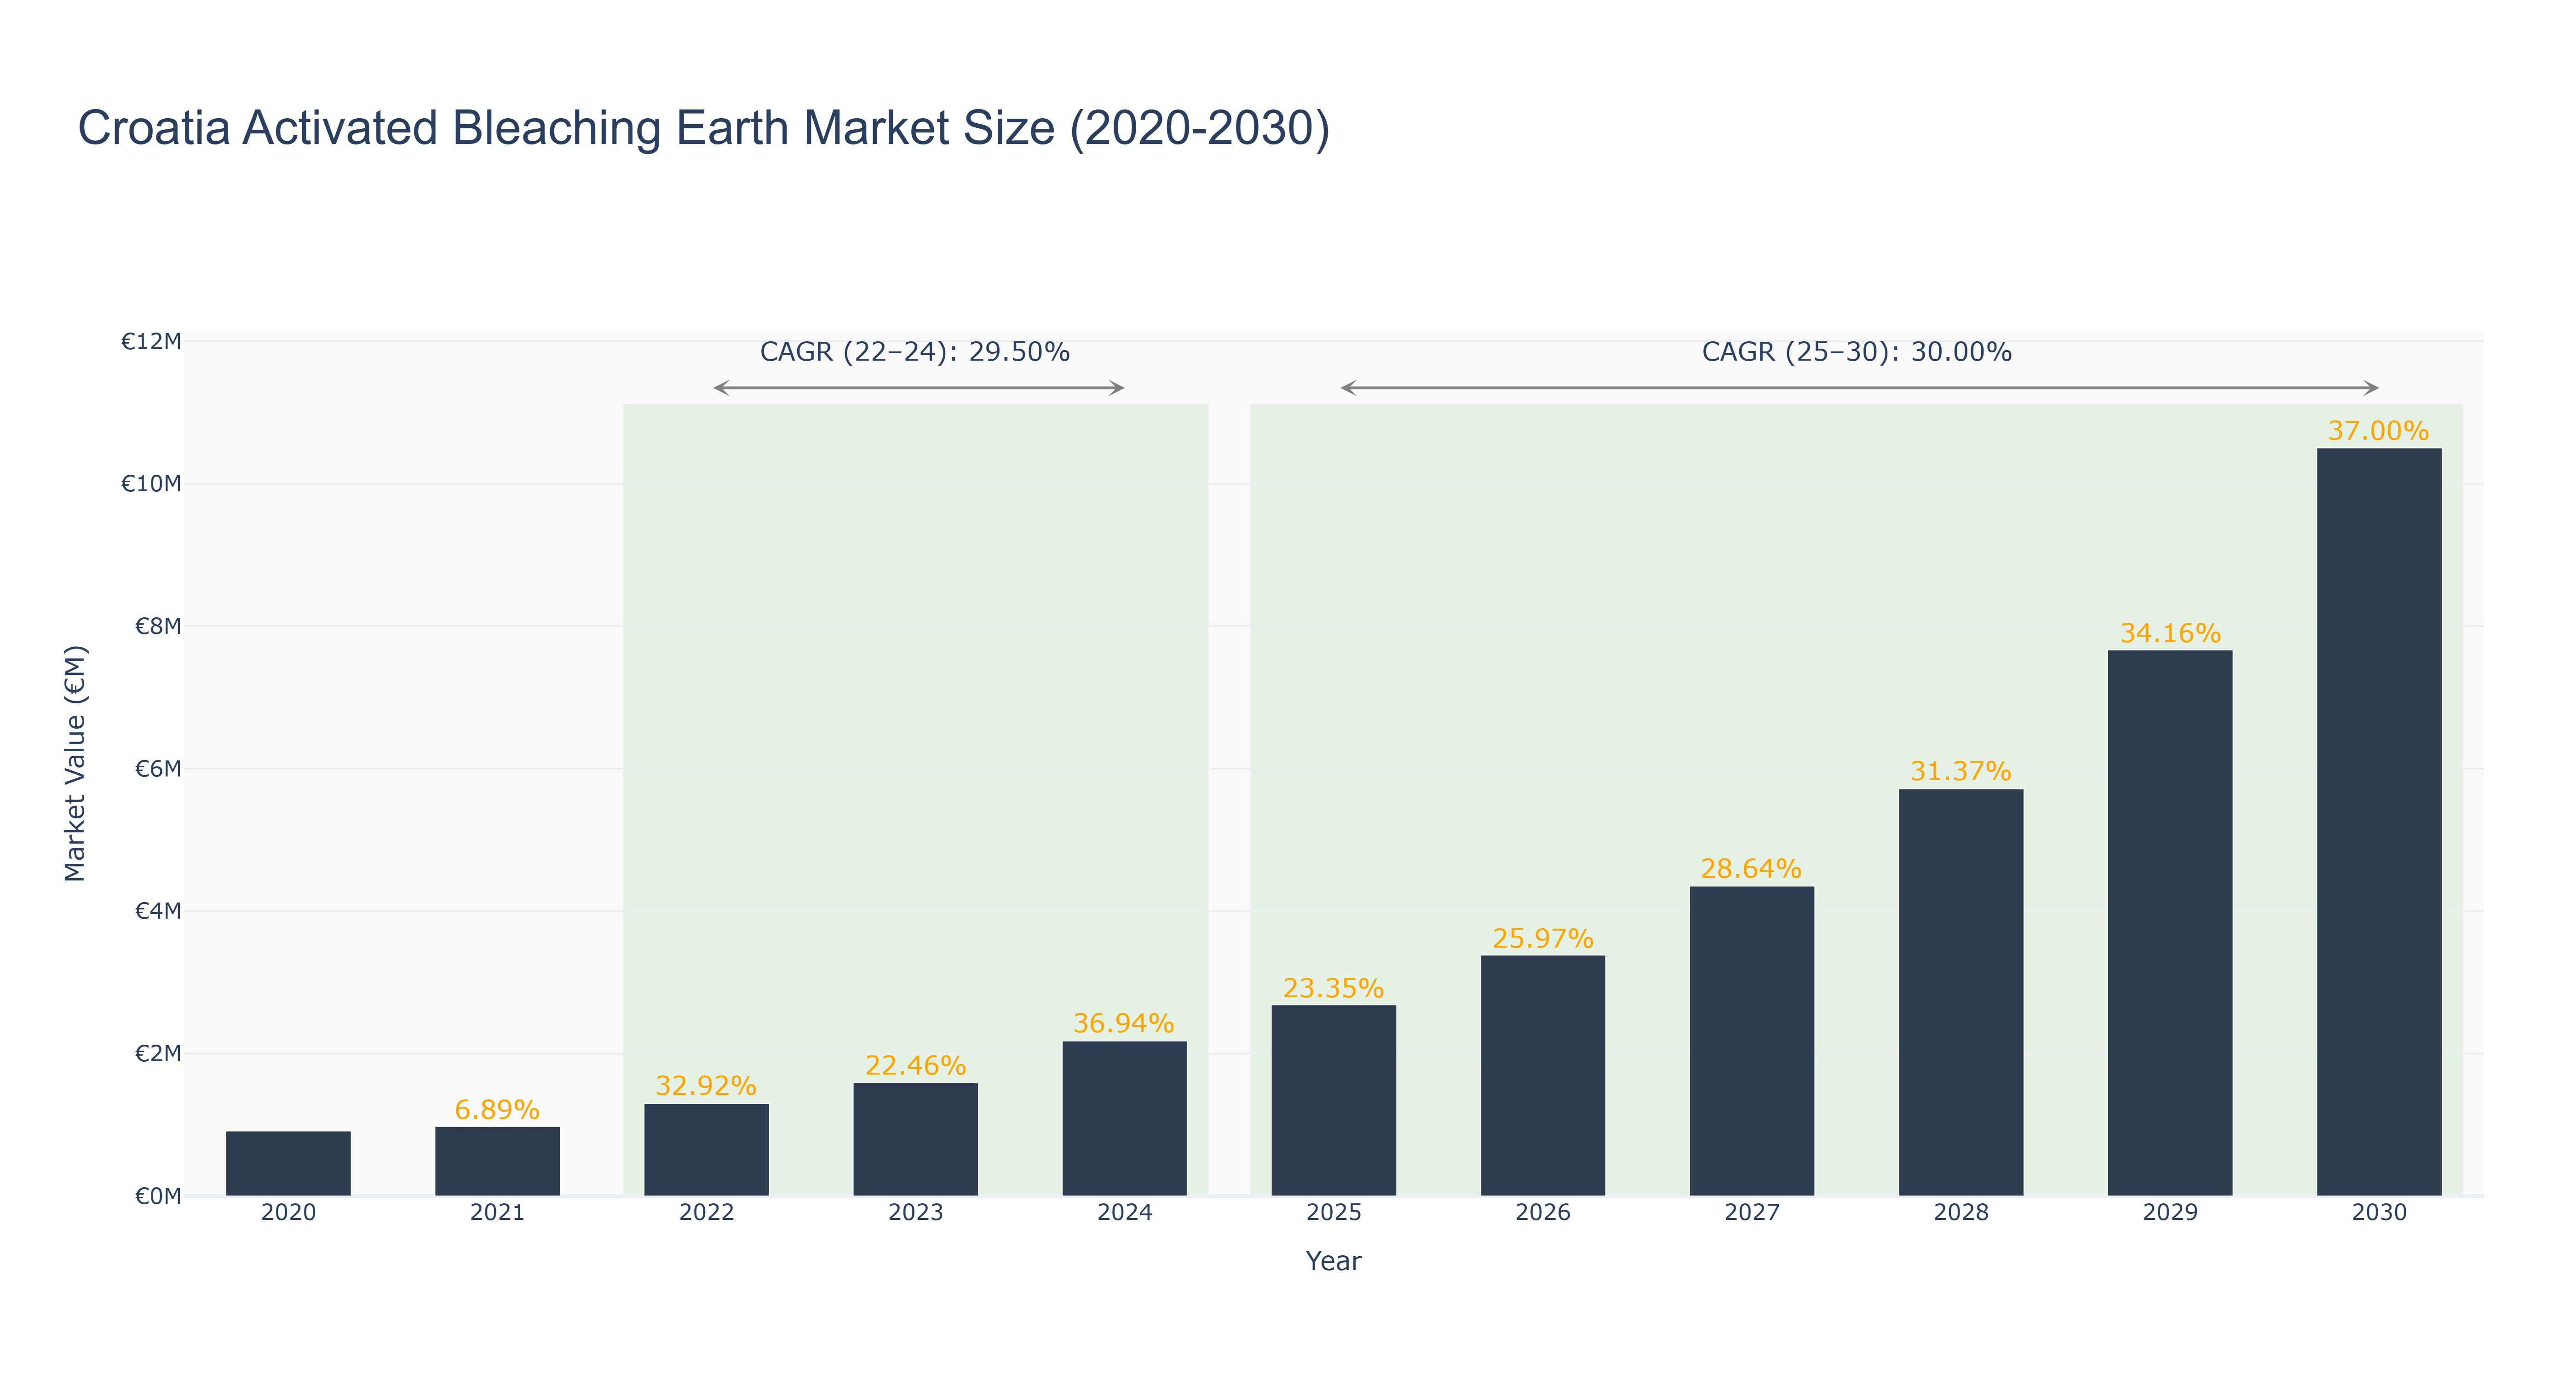
The Croatia Activated Bleaching Earth Market has demonstrated robust growth, peaking at €2.18 million in 2024, reflecting a remarkable compound annual growth rate (CAGR) of 29.50% from 2022 to 2024. This growth trajectory has been driven by increasing demand from food and beverage industries for high-quality bleaching agents, coupled with heightened environmental awareness leading to sustainable product innovations. Looking ahead, the market is projected to continue its upward momentum, with forecasted sizes reaching €10.51 million by 2030, corresponding to a CAGR of 30.00% from 2025 to 2030. Key industry drivers for this anticipated growth include expanding manufacturing capabilities, advancements in processing technologies, and the rising trend of eco-friendly products. As companies invest in enhancing product efficacy and sustainability, the Croatia Activated Bleaching Earth Market is set for significant evolution, positioning itself favorably within the broader European market landscape.
Croatia Activated Bleaching Earth Market: Production & Trade Performance (2019-2025)
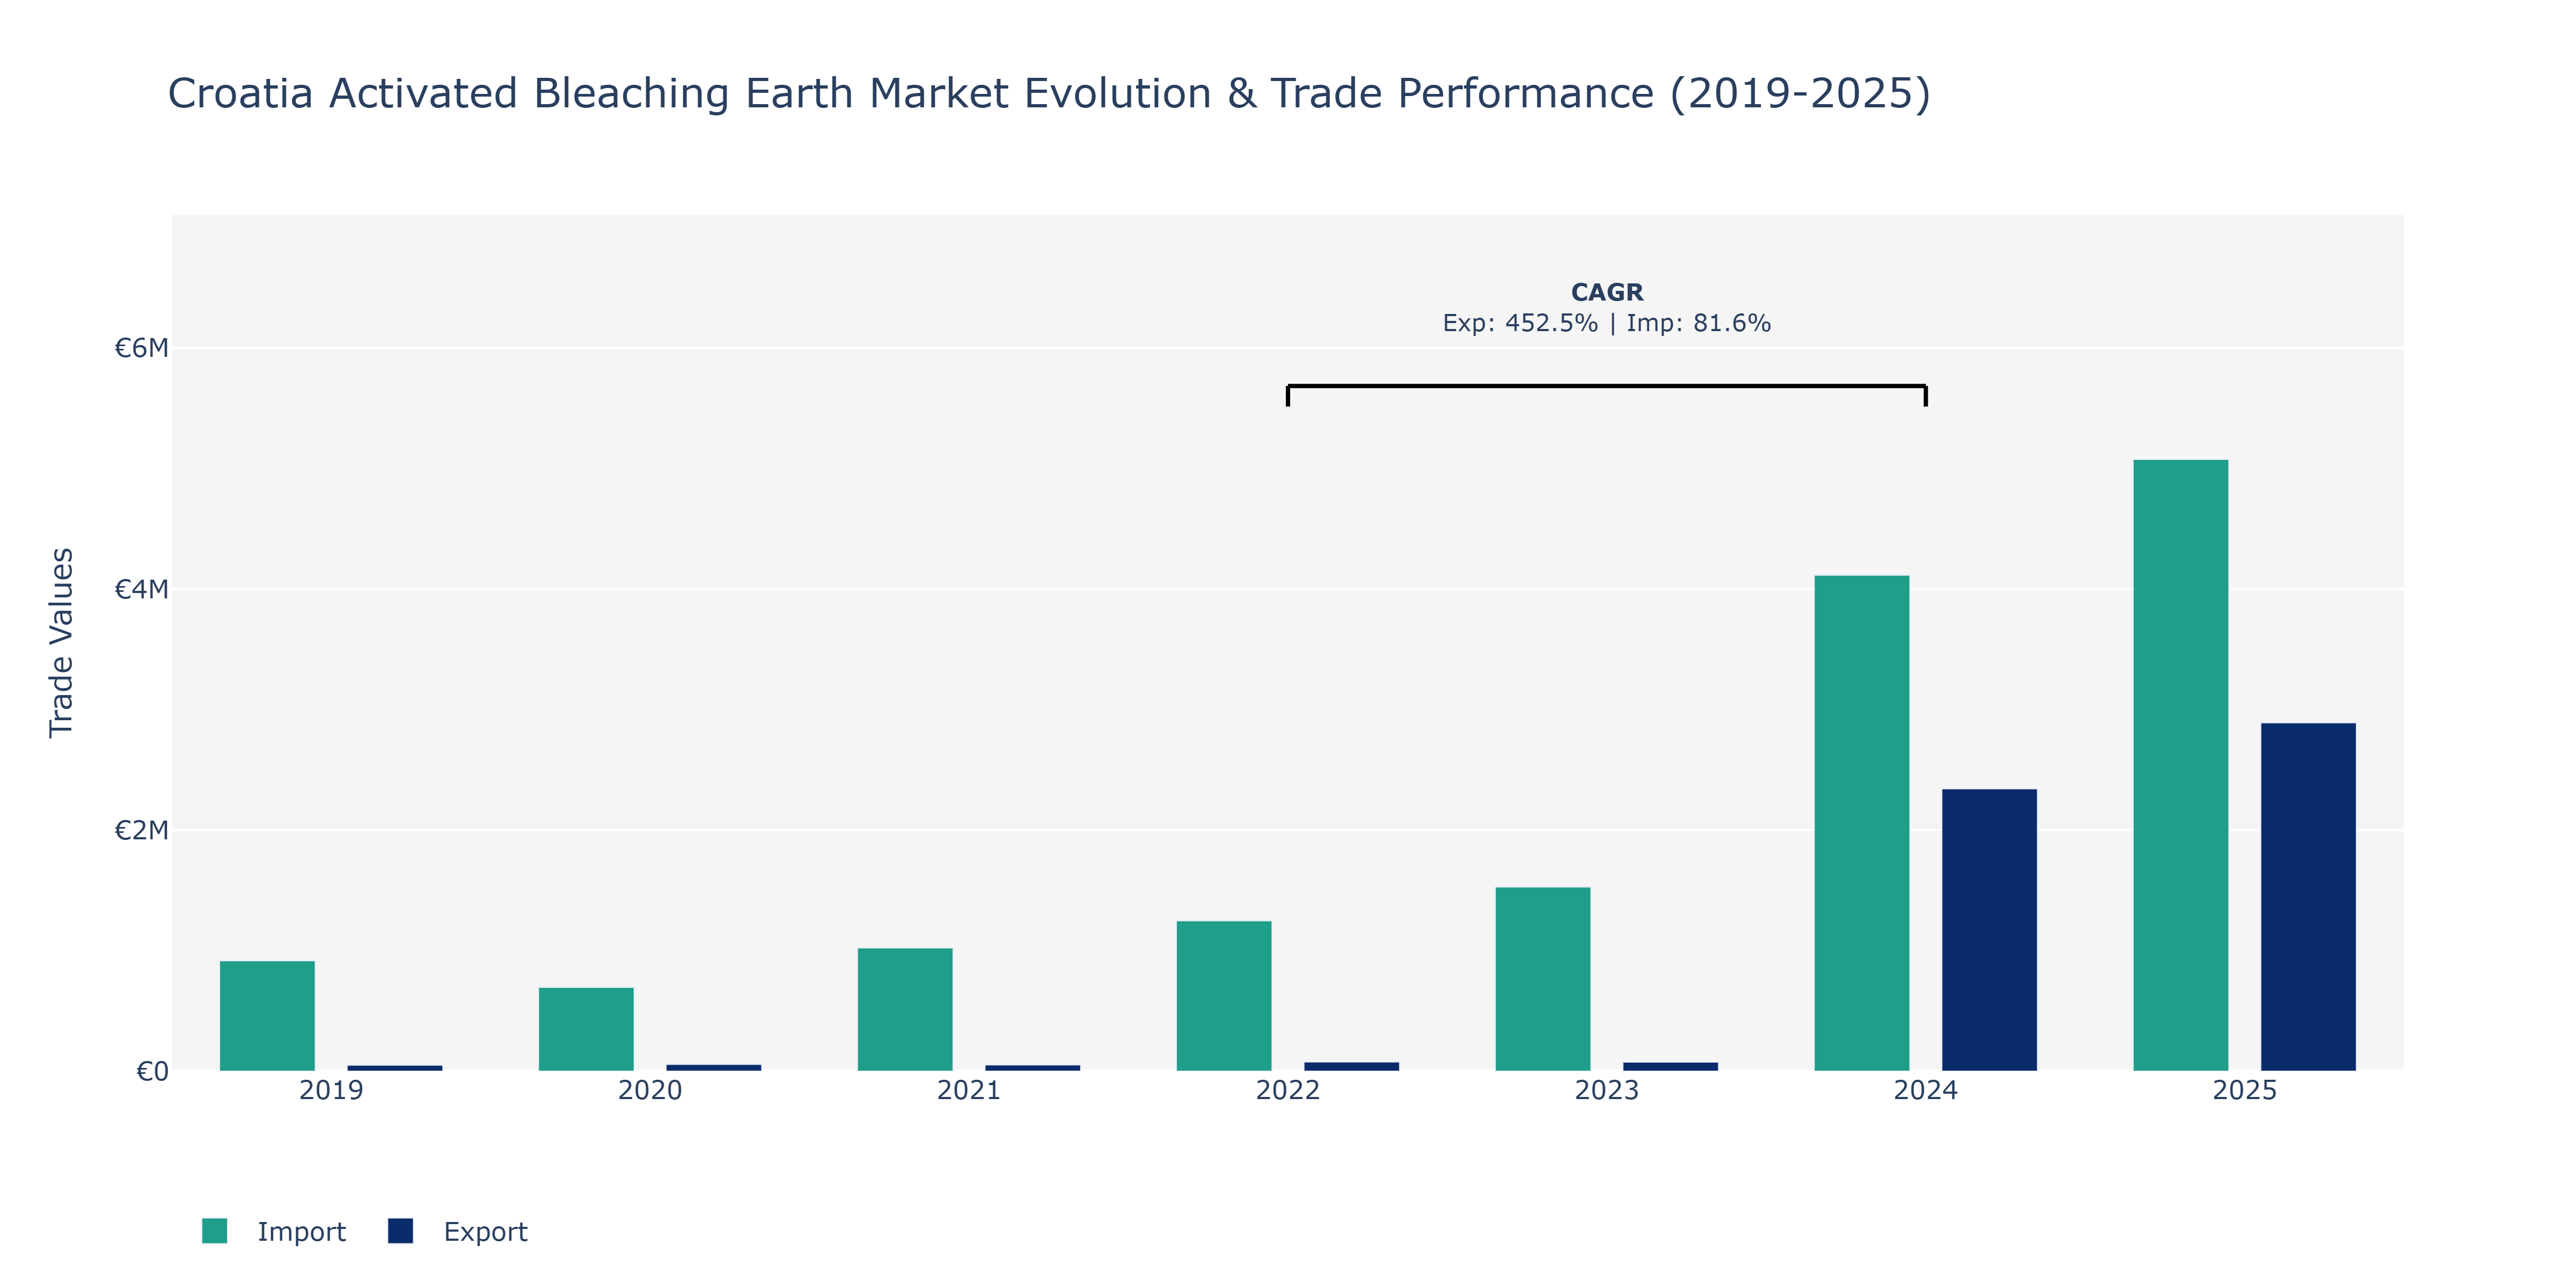
Between 2019 and 2025, Croatia's Activated Bleaching Earth Market witnessed notable fluctuations in Exports and Imports. Exports showed steady growth, escalating from €49.64 thousand in 2019 to €2.89 million in 2025. The peak point was observed in 2025, indicating a substantial uptrend fueled by increasing global demand for bleaching earth products. In contrast, Imports fluctuated over the period, reaching €5.08 million in 2025 from €915.65 thousand in 2019. The peak occurred in 2025, reflecting a surge in demand for raw materials to meet the expanding production capacity of the activated bleaching earth industry in Croatia. The significant rise in Exports can be attributed to the country's enhanced production capabilities and improved product quality, aligning with the growing preference for environmentally friendly and sustainable bleaching earth products globally. On the other hand, the surge in Imports underscores Croatia's reliance on external sources for key raw materials, necessitated by the expanding market demand and the pursuit of cost-effectiveness in production processes. Such dynamics indicate a burgeoning market poised for continued growth and potential strategic partnerships to secure the supply chain and sustain market competitiveness.
Key Highlights of the Report:
- Croatia Activated Bleaching Earth Market Outlook
- Market Size of Croatia Activated Bleaching Earth Market, 2025
- Forecast of Croatia Activated Bleaching Earth Market, 2032
- Historical Data and Forecast of Croatia Activated Bleaching Earth Revenues & Volume for the Period 2022 - 2032
- Croatia Activated Bleaching Earth Market Trend Evolution
- Croatia Activated Bleaching Earth Market Drivers and Challenges
- Croatia Activated Bleaching Earth Price Trends
- Croatia Activated Bleaching Earth Porter's Five Forces
- Croatia Activated Bleaching Earth Industry Life Cycle
- Historical Data and Forecast of Croatia Activated Bleaching Earth Market Revenues & Volume By Application for the Period 2022 - 2032
- Historical Data and Forecast of Croatia Activated Bleaching Earth Market Revenues & Volume By Edible Oil & Fats for the Period 2022 - 2032
- Historical Data and Forecast of Croatia Activated Bleaching Earth Market Revenues & Volume By Mineral Oil & Lubricants for the Period 2022 - 2032
- Croatia Activated Bleaching Earth Import Export Trade Statistics
- Market Opportunity Assessment By Application
- Croatia Activated Bleaching Earth Top Companies Market Share
- Croatia Activated Bleaching Earth Competitive Benchmarking By Technical and Operational Parameters
- Croatia Activated Bleaching Earth Company Profiles
- Croatia Activated Bleaching Earth Key Strategic Recommendations
Frequently Asked Questions About the Market Study (FAQs):
6Wresearch actively monitors the Croatia Activated Bleaching Earth Market and publishes its comprehensive annual report, highlighting emerging trends, growth drivers, revenue analysis, and forecast outlook. Our insights help businesses to make data-backed strategic decisions with ongoing market dynamics. Our analysts track relevent industries related to the Croatia Activated Bleaching Earth Market, allowing our clients with actionable intelligence and reliable forecasts tailored to emerging regional needs.
Yes, we provide customisation as per your requirements. To learn more, feel free to contact us on sales@6wresearch.com
1 Executive Summary |
2 Introduction |
2.1 Key Highlights of the Report |
2.2 Report Description |
2.3 Market Scope & Segmentation |
2.4 Research Methodology |
2.5 Assumptions |
3 Croatia Activated Bleaching Earth Market Overview |
3.1 Croatia Country Macro Economic Indicators |
3.2 Croatia Activated Bleaching Earth Market Revenues & Volume, 2022 & 2032F |
3.3 Croatia Activated Bleaching Earth Market - Industry Life Cycle |
3.4 Croatia Activated Bleaching Earth Market - Porter's Five Forces |
3.5 Croatia Activated Bleaching Earth Market Revenues & Volume Share, By Application, 2022 & 2032F |
4 Croatia Activated Bleaching Earth Market Dynamics |
4.1 Impact Analysis |
4.2 Market Drivers |
4.2.1 Increasing demand for refined vegetable oils in the food industry |
4.2.2 Growth in the cosmetics and personal care industry |
4.2.3 Rising awareness about the benefits of activated bleaching earth in various applications |
4.3 Market Restraints |
4.3.1 Fluctuating prices of raw materials |
4.3.2 Stringent environmental regulations affecting production processes |
4.3.3 Intense competition from alternative bleaching agents |
5 Croatia Activated Bleaching Earth Market Trends |
6 Croatia Activated Bleaching Earth Market, By Types |
6.1 Croatia Activated Bleaching Earth Market, By Application |
6.1.1 Overview and Analysis |
6.1.2 Croatia Activated Bleaching Earth Market Revenues & Volume, By Application, 2022 - 2032F |
6.1.3 Croatia Activated Bleaching Earth Market Revenues & Volume, By Edible Oil & Fats, 2022 - 2032F |
6.1.4 Croatia Activated Bleaching Earth Market Revenues & Volume, By Mineral Oil & Lubricants, 2022 - 2032F |
7 Croatia Activated Bleaching Earth Market Import-Export Trade Statistics |
7.1 Croatia Activated Bleaching Earth Market Export to Major Countries |
7.2 Croatia Activated Bleaching Earth Market Imports from Major Countries |
8 Croatia Activated Bleaching Earth Market Key Performance Indicators |
8.1 Average selling price of activated bleaching earth |
8.2 Number of new product launches incorporating activated bleaching earth |
8.3 Adoption rate of activated bleaching earth in different industries |
9 Croatia Activated Bleaching Earth Market - Opportunity Assessment |
9.1 Croatia Activated Bleaching Earth Market Opportunity Assessment, By Application, 2022 & 2032F |
10 Croatia Activated Bleaching Earth Market - Competitive Landscape |
10.1 Croatia Activated Bleaching Earth Market Revenue Share, By Companies, 2025 |
10.2 Croatia Activated Bleaching Earth Market Competitive Benchmarking, By Operating and Technical Parameters |
11 Company Profiles |
12 Recommendations |
13 Disclaimer |
Global Go To Market Strategy - 2030
Export potential enables firms to identify high-growth global markets with greater confidence by combining advanced trade intelligence with a structured quantitative methodology. The framework analyzes emerging demand trends and country-level import patterns while integrating macroeconomic and trade datasets such as GDP and population forecasts, bilateral import–export flows, tariff structures, elasticity differentials between developed and developing economies, geographic distance, and import demand projections. Using weighted trade values from 2020–2024 as the base period to project country-to-country export potential for 2030, these inputs are operationalized through calculated drivers such as gravity model parameters, tariff impact factors, and projected GDP per-capita growth. Through an analysis of hidden potentials, demand hotspots, and market conditions that are most favorable to success, this method enables firms to focus on target countries, maximize returns, and global expansion with data, backed by accuracy.
By factoring in the projected importer demand gap that is currently unmet and could be potential opportunity, it identifies the potential for the Exporter (Country) among 190 countries, against the general trade analysis, which identifies the biggest importer or exporter.
To discover high-growth global markets and optimize your business strategy:
Click Here
Pricing
- Single User License$ 1,995
- Department License$ 2,400
- Site License$ 3,120
- Global License$ 3,795

Leadership Perspectives from Industry Events
Search
Thought Leadership and Analyst Meet


Our Clients
6WResearch In News
- Doha a strategic location for EV manufacturing hub: IPA Qatar
- Demand for luxury TVs surging in the GCC, says Samsung
- Empowering Growth: The Thriving Journey of Bangladesh’s Cable Industry
- Demand for luxury TVs surging in the GCC, says Samsung
- Video call with a traditional healer? Once unthinkable, it’s now common in South Africa
- Intelligent Buildings To Smooth GCC’s Path To Net Zero
Latest Reports
- Taiwan Windshield Projection Systems Market (2026-2032)
- Vietnam Windshield Projection Systems Market (2026-2032)
- Thailand Windshield Projection Systems Market (2026-2032)
- South Korea Windshield Projection Systems Market (2026-2032)
- Romania Windshield Projection Systems Market (2026-2032)
- Qatar Windshield Projection Systems Market (2026-2032)
- Philippines Windshield Projection Systems Market (2026-2032)
- Japan Windshield Projection Systems Market (2026-2032)
- Taiwan Windshield Projection Display Market (2026-2032)
- Vietnam Windshield Projection Display Market (2026-2032)
Industry Events and Analyst Meet

HIMTEX 2026

India Refining Summit 2026

India EV Show 2026

EV tech India Expo 2026

Auto Tech Asia 2026
Whitepaper
- Middle East & Africa Commercial Security Market Click here to view more.
- Middle East & Africa Fire Safety Systems & Equipment Market Click here to view more.
- GCC Drone Market Click here to view more.
- Middle East Lighting Fixture Market Click here to view more.
- GCC Physical & Perimeter Security Market Click here to view more.