Croatia Alginate Market (2026-2032) | Forecast, Growth, Size, Companies, Industry, Trends, Revenue, Share, Value, Outlook, Segmentation & Analysis
Market Forecast By Type (Sodium Alginate, Calcium Alginate, Potassium Alginate, PGA, Others), By Application (Food & Beverage, Industrial, Pharmaceutical, Others) And Competitive Landscape
| Product Code: ETC4706759 | Publication Date: Nov 2023 | Updated Date: Apr 2026 | Product Type: Market Research Report | |
| Publisher: 6Wresearch | Author: Shubham Padhi | No. of Pages: 60 | No. of Figures: 30 | No. of Tables: 5 |
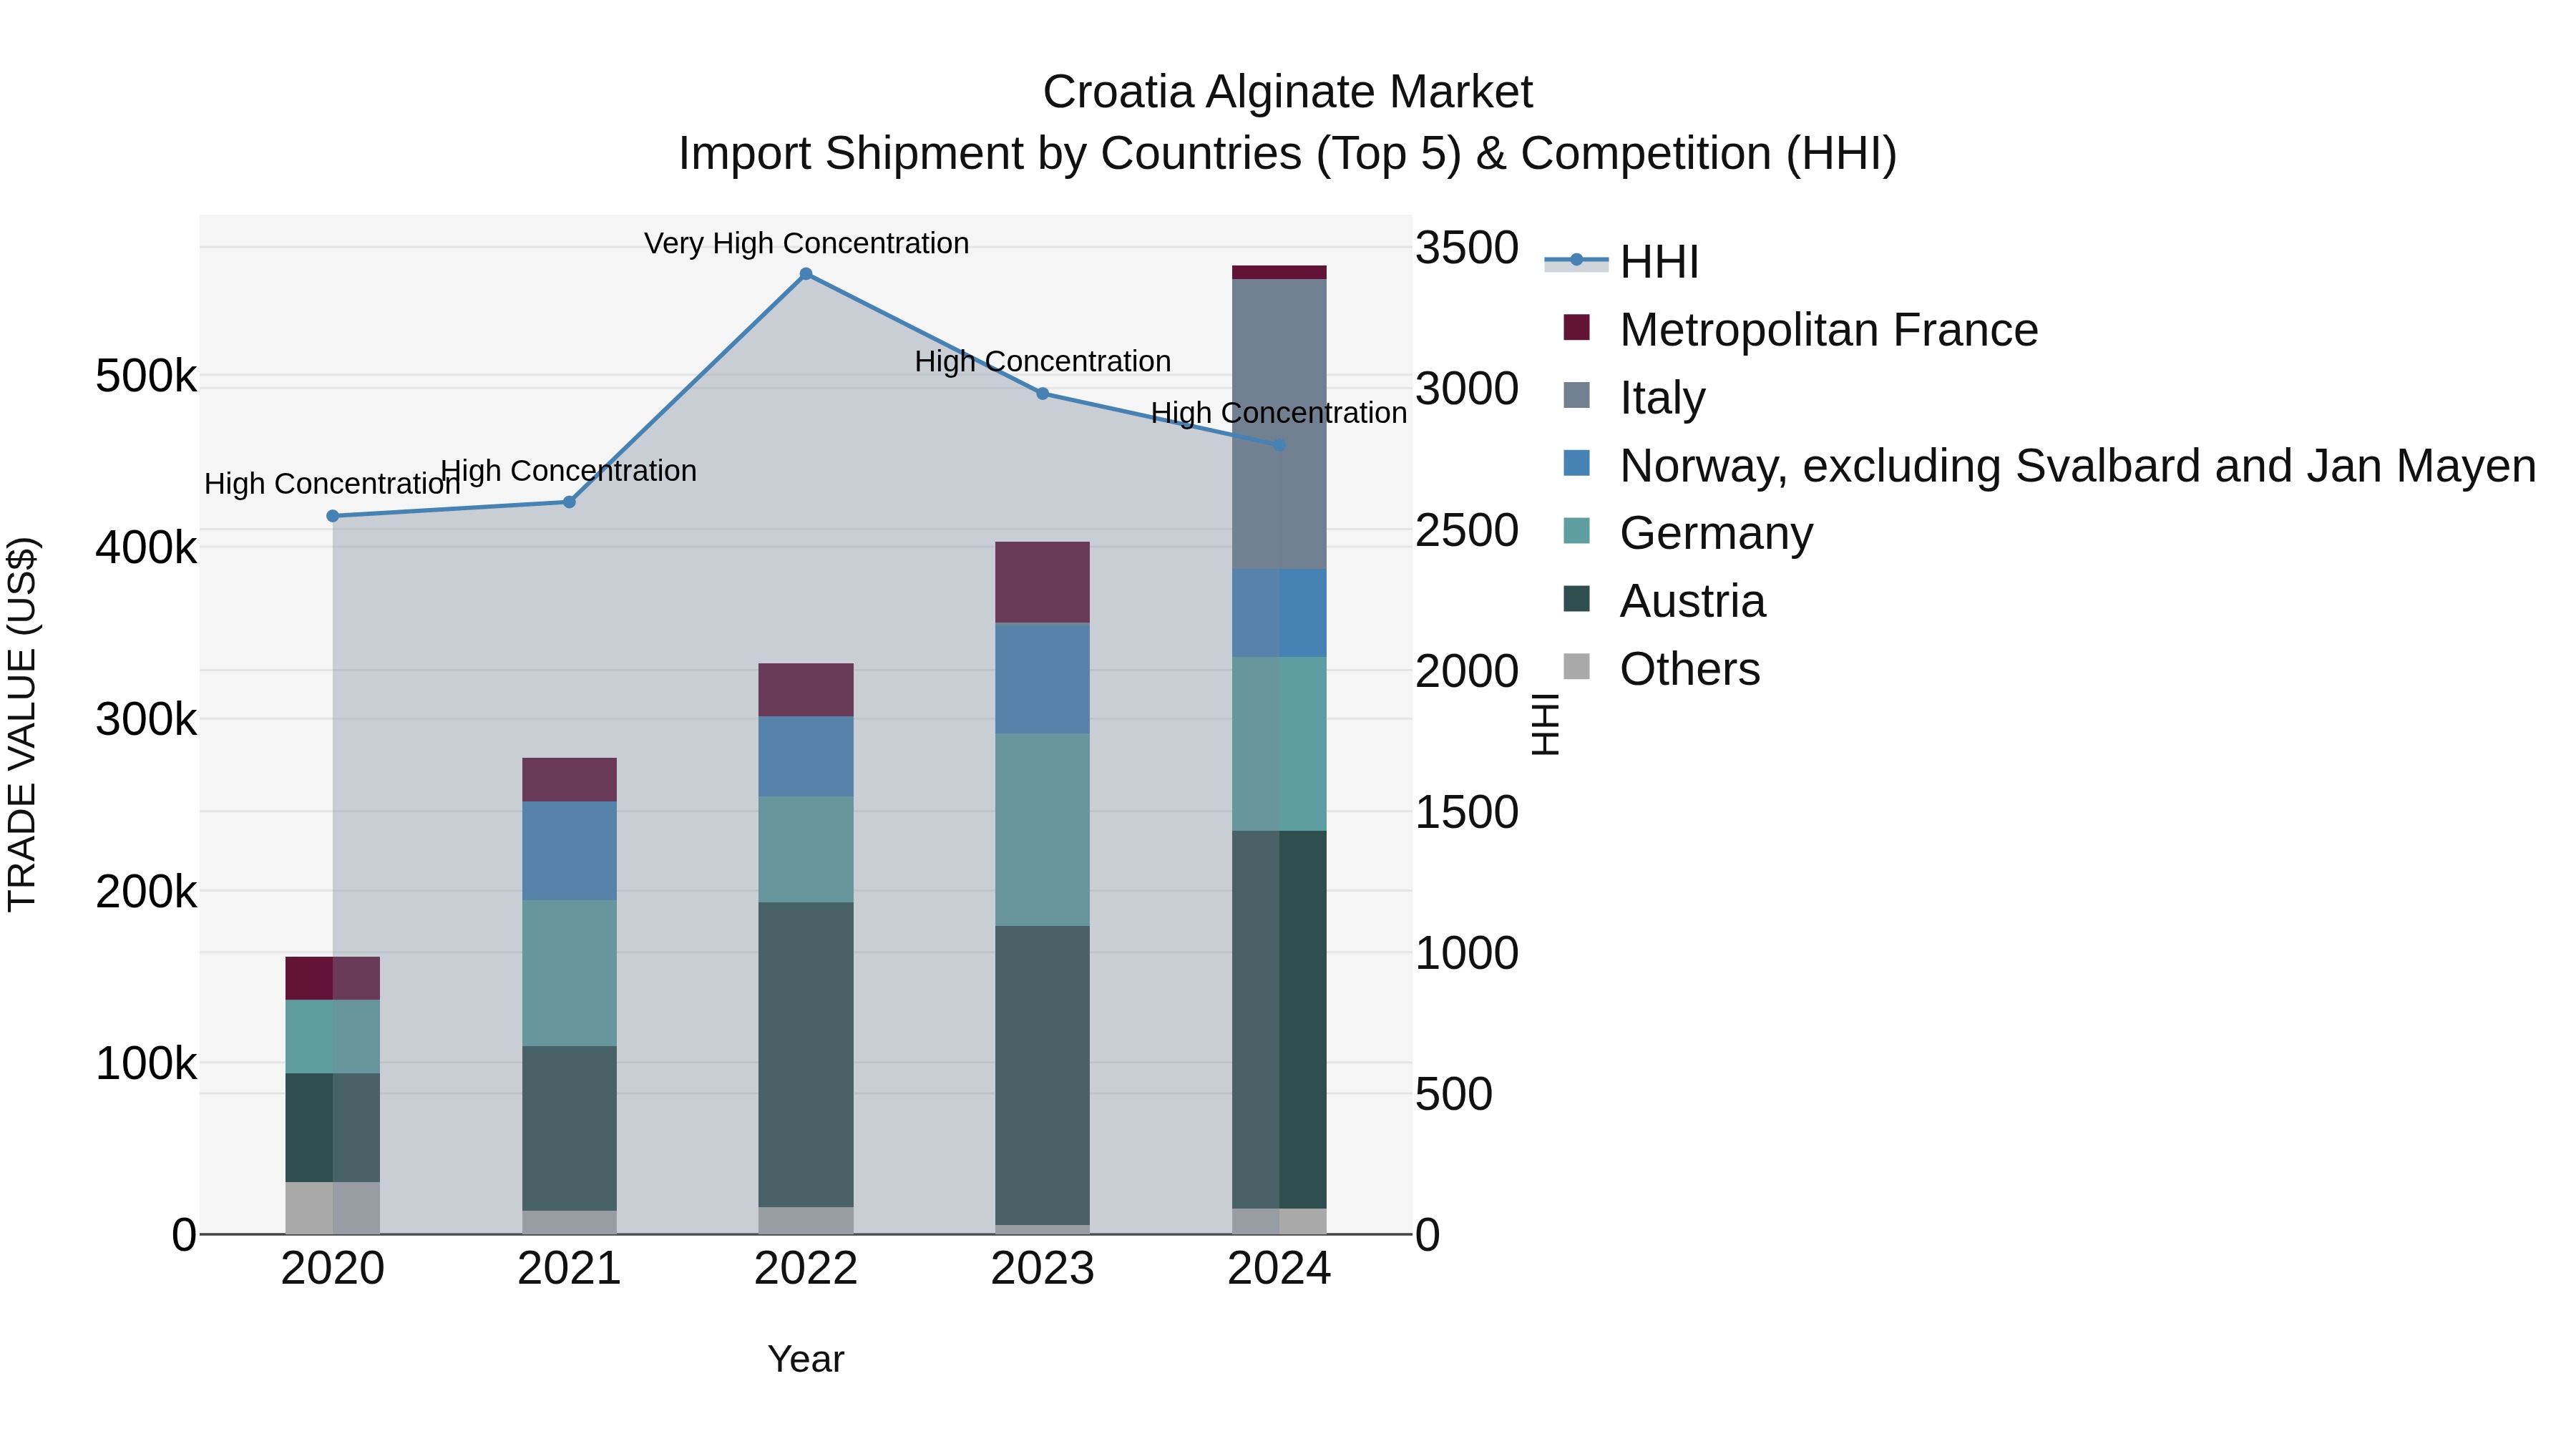
Croatia Alginate Market Top 5 Importing Countries and Market Competition (HHI) Analysis
Croatia import shipments of alginate in 2024 show a notable increase in concentration among top exporting countries, with Austria, Italy, Germany, and Norway leading the way. China, which was a significant player in 2023, is now excluded from the top list. The high Herfindahl-Hirschman Index (HHI) in 2023 further intensified in 2024, indicating a more concentrated market. The impressive compound annual growth rate (CAGR) of 36.7% from 2020 to 2024, coupled with a remarkable growth rate of 39.89% from 2023 to 2024, underscores the robust expansion and competitive dynamics within Croatia alginate import sector.
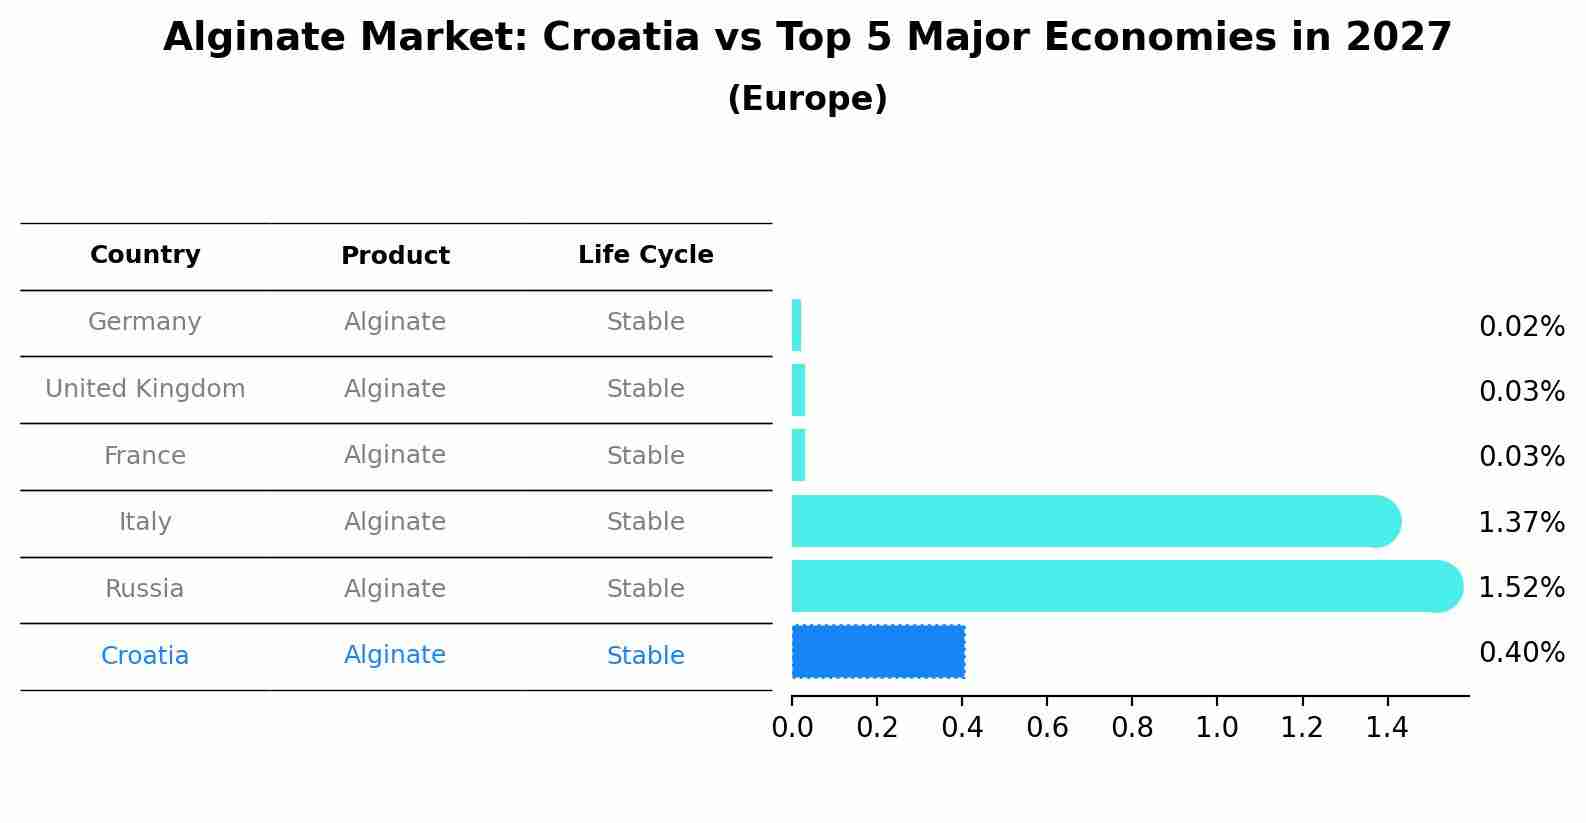
Alginate Market: Croatia vs Top 5 Major Economies in 2027 (Europe)
By 2027, the Alginate market in Croatia is anticipated to reach a growth rate of 0.40%, as part of an increasingly competitive Europe region, where Germany remains at the forefront, supported by United Kingdom, France, Italy and Russia, driving innovations and market adoption across sectors.
Key Highlights of the Report:
- Croatia Alginate Market Outlook
- Market Size of Croatia Alginate Market, 2025
- Forecast of Croatia Alginate Market, 2032
- Historical Data and Forecast of Croatia Alginate Revenues & Volume for the Period 2022 - 2032F
- Croatia Alginate Market Trend Evolution
- Croatia Alginate Market Drivers and Challenges
- Croatia Alginate Price Trends
- Croatia Alginate Porter`s Five Forces
- Croatia Alginate Industry Life Cycle
- Historical Data and Forecast of Croatia Alginate Market Revenues & Volume By Type for the Period 2022 - 2032F
- Historical Data and Forecast of Croatia Alginate Market Revenues & Volume By Sodium Alginate for the Period 2022 - 2032F
- Historical Data and Forecast of Croatia Alginate Market Revenues & Volume By Calcium Alginate for the Period 2022 - 2032F
- Historical Data and Forecast of Croatia Alginate Market Revenues & Volume By Potassium Alginate for the Period 2022 - 2032F
- Historical Data and Forecast of Croatia Alginate Market Revenues & Volume By PGA for the Period 2022 - 2032F
- Historical Data and Forecast of Croatia Alginate Market Revenues & Volume By Others for the Period 2022 - 2032F
- Historical Data and Forecast of Croatia Alginate Market Revenues & Volume By Application for the Period 2022 - 2032F
- Historical Data and Forecast of Croatia Alginate Market Revenues & Volume By Food & Beverage for the Period 2022 - 2032F
- Historical Data and Forecast of Croatia Alginate Market Revenues & Volume By Industrial for the Period 2022 - 2032F
- Historical Data and Forecast of Croatia Alginate Market Revenues & Volume By Pharmaceutical for the Period 2022 - 2032F
- Historical Data and Forecast of Croatia Alginate Market Revenues & Volume By Others for the Period 2022 - 2032F
- Croatia Alginate Import Export Trade Statistics
- Market Opportunity Assessment By Type
- Market Opportunity Assessment By Application
- Croatia Alginate Top Companies Market Share
- Croatia Alginate Competitive Benchmarking By Technical and Operational Parameters
- Croatia Alginate Company Profiles
- Croatia Alginate Key Strategic Recommendations
Frequently Asked Questions About the Market Study (FAQs):
6Wresearch actively monitors the Croatia Alginate Market and publishes its comprehensive annual report, highlighting emerging trends, growth drivers, revenue analysis, and forecast outlook. Our insights help businesses to make data-backed strategic decisions with ongoing market dynamics. Our analysts track relevent industries related to the Croatia Alginate Market, allowing our clients with actionable intelligence and reliable forecasts tailored to emerging regional needs.
Yes, we provide customisation as per your requirements. To learn more, feel free to contact us on sales@6wresearch.com
1 Executive Summary |
2 Introduction |
2.1 Key Highlights of the Report |
2.2 Report Description |
2.3 Market Scope & Segmentation |
2.4 Research Methodology |
2.5 Assumptions |
3 Croatia Alginate Market Overview |
3.1 Croatia Country Macro Economic Indicators |
3.2 Croatia Alginate Market Revenues & Volume, 2022 & 2032F |
3.3 Croatia Alginate Market - Industry Life Cycle |
3.4 Croatia Alginate Market - Porter's Five Forces |
3.5 Croatia Alginate Market Revenues & Volume Share, By Type, 2022 & 2032F |
3.6 Croatia Alginate Market Revenues & Volume Share, By Application, 2022 & 2032F |
4 Croatia Alginate Market Dynamics |
4.1 Impact Analysis |
4.2 Market Drivers |
4.2.1 Growing demand for natural and sustainable ingredients in food and pharmaceutical industries |
4.2.2 Increased awareness about the health benefits of alginate as a food additive and pharmaceutical excipient |
4.2.3 Rising usage of alginate in various applications such as food, pharmaceuticals, and biotechnology |
4.3 Market Restraints |
4.3.1 Fluctuating prices of raw materials used in alginate production |
4.3.2 Stringent regulations related to the usage of food additives and pharmaceutical ingredients |
4.3.3 Limited availability of high-quality alginate raw materials |
5 Croatia Alginate Market Trends |
6 Croatia Alginate Market Segmentations |
6.1 Croatia Alginate Market, By Type |
6.1.1 Overview and Analysis |
6.1.2 Croatia Alginate Market Revenues & Volume, By Sodium Alginate, 2022 - 2032F |
6.1.3 Croatia Alginate Market Revenues & Volume, By Calcium Alginate, 2022 - 2032F |
6.1.4 Croatia Alginate Market Revenues & Volume, By Potassium Alginate, 2022 - 2032F |
6.1.5 Croatia Alginate Market Revenues & Volume, By PGA, 2022 - 2032F |
6.1.6 Croatia Alginate Market Revenues & Volume, By Others, 2022 - 2032F |
6.2 Croatia Alginate Market, By Application |
6.2.1 Overview and Analysis |
6.2.2 Croatia Alginate Market Revenues & Volume, By Food & Beverage, 2022 - 2032F |
6.2.3 Croatia Alginate Market Revenues & Volume, By Industrial, 2022 - 2032F |
6.2.4 Croatia Alginate Market Revenues & Volume, By Pharmaceutical, 2022 - 2032F |
6.2.5 Croatia Alginate Market Revenues & Volume, By Others, 2022 - 2032F |
7 Croatia Alginate Market Import-Export Trade Statistics |
7.1 Croatia Alginate Market Export to Major Countries |
7.2 Croatia Alginate Market Imports from Major Countries |
8 Croatia Alginate Market Key Performance Indicators |
8.1 Percentage of food products in Croatia incorporating alginate as an ingredient |
8.2 Number of pharmaceutical companies in Croatia using alginate in their formulations |
8.3 Research and development investment in alginate-based products in Croatia |
9 Croatia Alginate Market - Opportunity Assessment |
9.1 Croatia Alginate Market Opportunity Assessment, By Type, 2022 & 2032F |
9.2 Croatia Alginate Market Opportunity Assessment, By Application, 2022 & 2032F |
10 Croatia Alginate Market - Competitive Landscape |
10.1 Croatia Alginate Market Revenue Share, By Companies, 2025 |
10.2 Croatia Alginate Market Competitive Benchmarking, By Operating and Technical Parameters |
11 Company Profiles |
12 Recommendations | 13 Disclaimer |
Export potential assessment - trade Analytics for 2030
Export potential enables firms to identify high-growth global markets with greater confidence by combining advanced trade intelligence with a structured quantitative methodology. The framework analyzes emerging demand trends and country-level import patterns while integrating macroeconomic and trade datasets such as GDP and population forecasts, bilateral import–export flows, tariff structures, elasticity differentials between developed and developing economies, geographic distance, and import demand projections. Using weighted trade values from 2020–2024 as the base period to project country-to-country export potential for 2030, these inputs are operationalized through calculated drivers such as gravity model parameters, tariff impact factors, and projected GDP per-capita growth. Through an analysis of hidden potentials, demand hotspots, and market conditions that are most favorable to success, this method enables firms to focus on target countries, maximize returns, and global expansion with data, backed by accuracy.
By factoring in the projected importer demand gap that is currently unmet and could be potential opportunity, it identifies the potential for the Exporter (Country) among 190 countries, against the general trade analysis, which identifies the biggest importer or exporter.
To discover high-growth global markets and optimize your business strategy:
Click Here
Pricing
- Single User License$ 1,995
- Department License$ 2,400
- Site License$ 3,120
- Global License$ 3,795

Search
Thought Leadership and Analyst Meet


Our Clients
Latest Reports
- India Ultrasonic Smart Water Meter Market (2026-2032) | Outlook, Competition, Drivers, Trends, Demand, Competitive, Strategic Insights, Companies, Challenges, Strategy, Consumer Insights, Analysis, Opportunities, Growth, Size, Share, Industry, Revenue, Segments, Value, Segmentation, Supply, Forecast, Restraints,
- India Electromagnetic Bulk Flow Meter Market (2026-2032) | Analysis, Challenges, Strategic Insights, Supply, Forecast, Growth, Share, Consumer Insights, Competitive, Value, Outlook, Size & Demand,
- India Battery Powered Bulk Flow Meter Market (2026-2032) | Outlook, Analysis, Competitive Landscape, Growth, Size, Trends, Value, Revenue, Companies, Segmentation, Share & Forecast
- Bosnia and Herzegovina Fuel-Efficient Winglets Market (2026-2032) | Growth, Competition, Strategy, Restraints, Trends, Challenges, segmentation, Value, Outlook, Investment Opportunities, Analysis, Revenue, Companies, Insights, Pricing, Size, Drivers, Demand, Share, Forecast
- Canada Cloud CFD Market (2026-2032) | Size & Revenue, Industry, Growth, Competitive Landscape, Forecast, Segmentation, Value, Outlook, Trends, Share, Analysis, Companies
- Taiwan Food Delivery Platform Market (2026-2032) | Companies, Outlook, Analysis, Trends, Value, Revenue, Segmentation, Share, Forecast, Competitive Landscape, Growth, Size & Forecast
- United Kingdom (UK) Long-term Care Insurance Market (2026-2032) | Growth, Share, Consumer Insights, Drivers, Opportunities, Competition, Pricing Analysis, Segments, Restraints, Companies, Competitive, Value, Outlook, Size, Demand, Analysis, Challenges, Strategic Insights, Investment Trends, Revenue, Trends, Supply, Forecast
- United Kingdom (UK) Long Term Care Market (2026-2032) | Companies, Outlook, Analysis, Trends, Value, Revenue, Segmentation, Share, Forecast, Competitive Landscape, Growth, Size & Forecast
- Iraq Insulation and Waterproofing Market (2026-2032) | Outlook, Drivers, Growth, Size, Share, Industry, Revenue, Trends, Demand, Competitive, Strategic Insights, Opportunities, Segments, Companies, Challenges, Strategy, Consumer Insights, Analysis, Investment Trends, Value, Segmentation, Forecast, Restraints
- India Switchgear Market Outlook (2026-2032) | Size, Share, Trends, Growth, Revenue, Forecast, Analysis, Value, Outlook
Industry Events and Analyst Meet

India EV Show 2026

EV tech India Expo 2026

Auto Tech Asia 2026

Battery Tech India 2026

Smart Production Solutions Guangzhou 2026
Whitepaper
- Middle East & Africa Commercial Security Market Click here to view more.
- Middle East & Africa Fire Safety Systems & Equipment Market Click here to view more.
- GCC Drone Market Click here to view more.
- Middle East Lighting Fixture Market Click here to view more.
- GCC Physical & Perimeter Security Market Click here to view more.
6WResearch In News
- Doha a strategic location for EV manufacturing hub: IPA Qatar
- Demand for luxury TVs surging in the GCC, says Samsung
- Empowering Growth: The Thriving Journey of Bangladesh’s Cable Industry
- Demand for luxury TVs surging in the GCC, says Samsung
- Video call with a traditional healer? Once unthinkable, it’s now common in South Africa
- Intelligent Buildings To Smooth GCC’s Path To Net Zero