Croatia Bar Soap Market (2026-2032) | Companies, Forecast, Segmentation, Value, Analysis, Competitive Landscape, Growth, Share, Outlook, Size & Revenue, Industry, Trends
Market Forecast By Type (Organic, Synthetic), By Application (Hair Care, Skin/Body Care, Facial Care, Specialized), By Distribution Channel (Supermarkets/Hypermarkets, Convenience Stores, Specialty Stores, Online Retailers, Others) And Competitive Landscape
| Product Code: ETC6845951 | Publication Date: Sep 2024 | Updated Date: Apr 2026 | Product Type: Market Research Report | |
| Publisher: 6Wresearch | Author: Summon Dutta | No. of Pages: 75 | No. of Figures: 35 | No. of Tables: 20 |
Croatia Bar Soap Market Size (2020-2030)
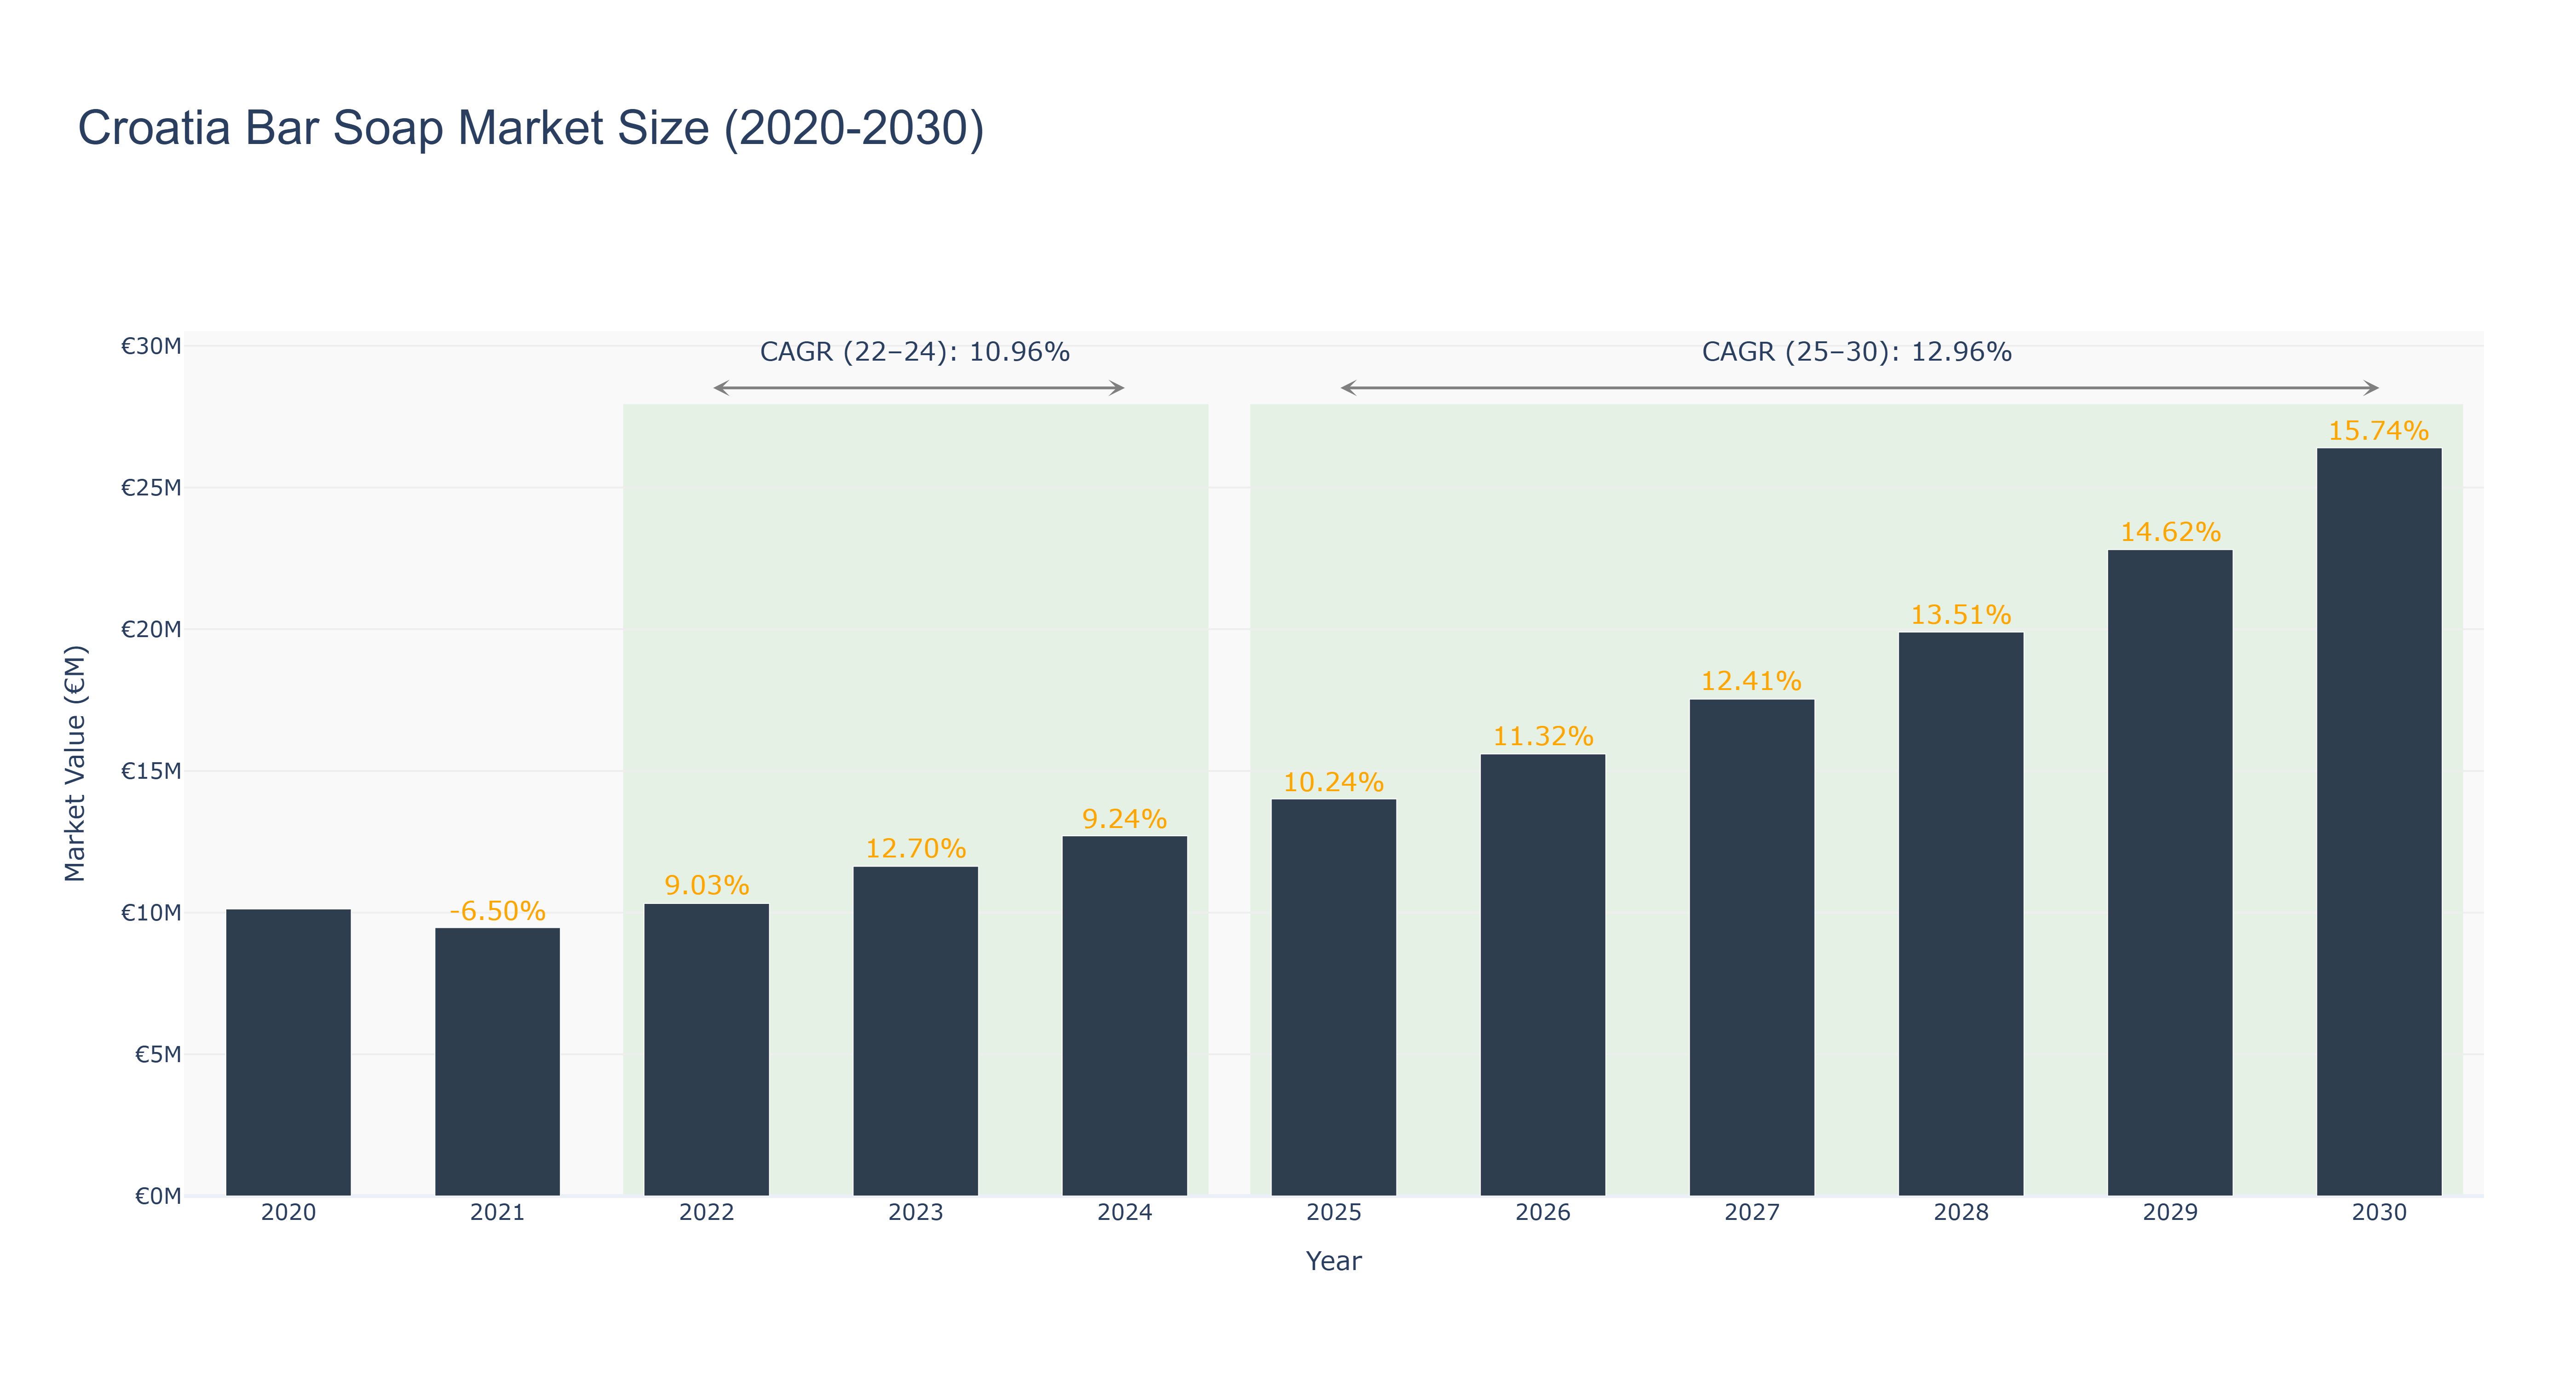
The Croatia Bar Soap Market experienced fluctuations between 2020 and 2024, peaking in 2023 with a market size of €11.63 million, following a positive growth trend after a decline in 2021. The actual data for this period indicates a Compound Annual Growth Rate (CAGR) of 10.96% from 2022 to 2024, driven by rising consumer awareness of hygiene and a growing preference for natural and organic products. Looking ahead, the forecasted period from 2025 to 2030 suggests robust growth, with market size projected to reach €26.40 million by 2030, reflecting a CAGR of 12.96%. This growth is expected to be supported by increasing disposable incomes, innovative product developments, and a shift towards sustainable packaging. The Croatian market is well-positioned to capitalize on these macro trends, ensuring continued expansion in the bar soap segment.
Croatia Bar Soap Market: Production & Trade Performance (2019-2025)
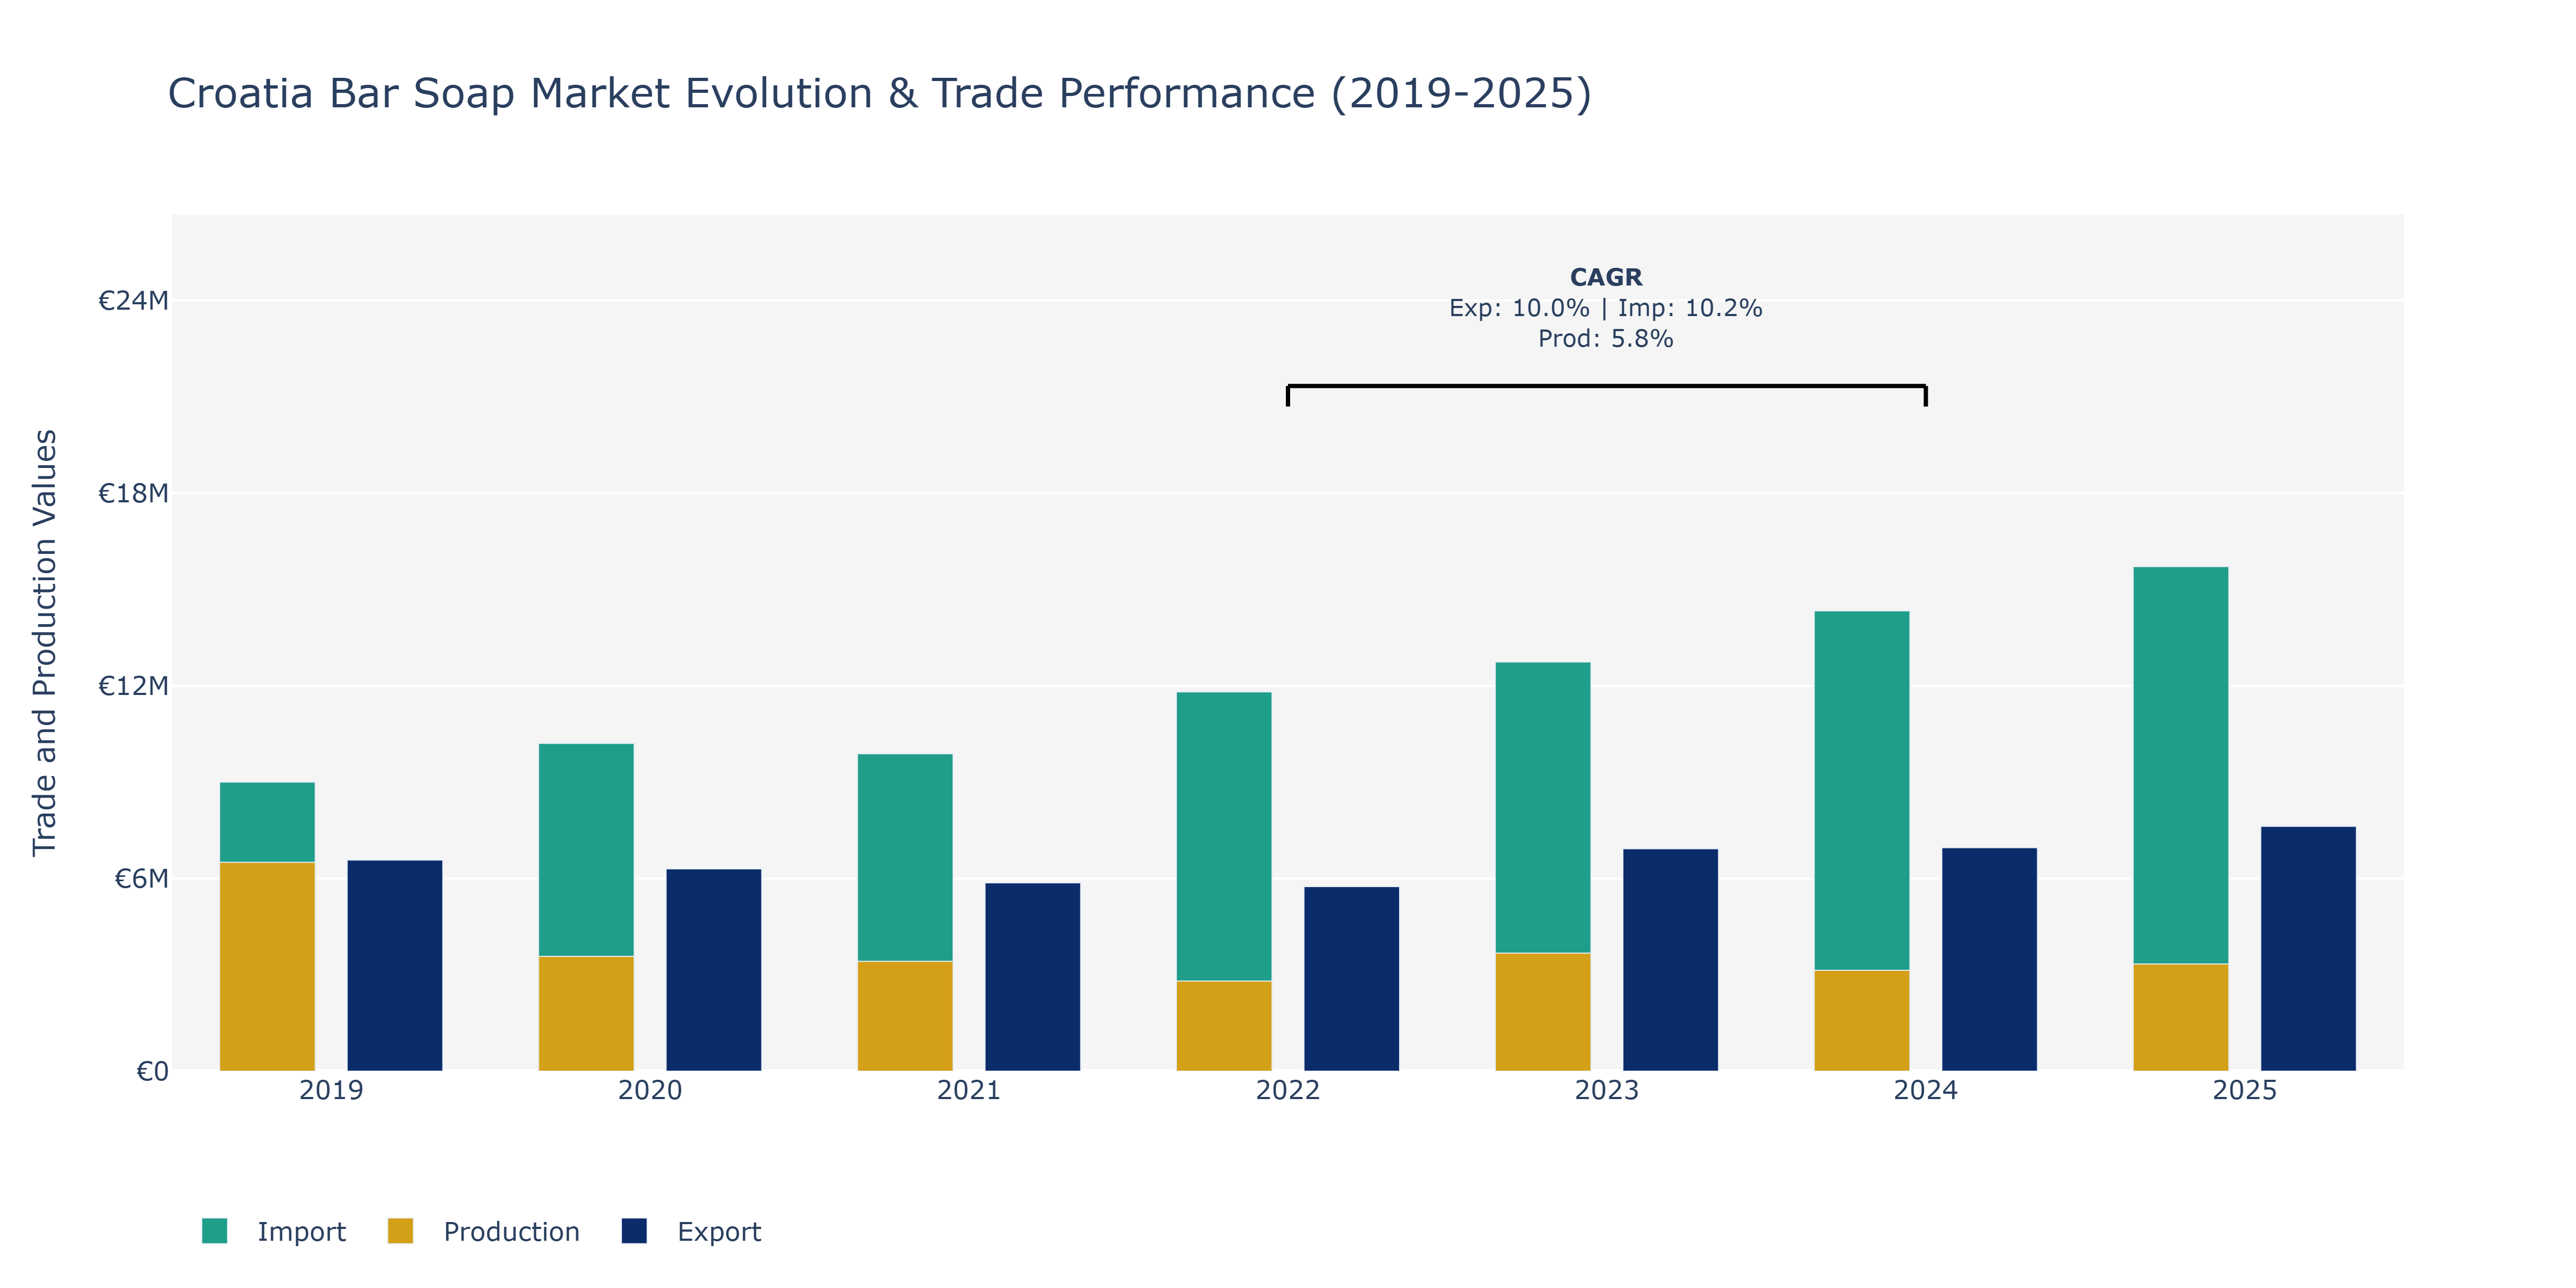
In the Croatia Bar Soap Market, exports displayed a fluctuating trend from 2019 to 2025, with a notable peak in 2025 at approximately €7.62 million. Conversely, imports steadily increased each year, reaching around €15.71 million in 2025. Production value varied more significantly, with a drop to around €2.81 million in 2022 followed by a partial recovery to about €3.34 million in 2025. The market saw a spike in both exports and imports in 2023, indicating potential changes in international demand and supply dynamics. The rise in production from 2022 to 2025 may be attributed to manufacturers adapting to evolving consumer preferences for sustainable and natural soap products, aligning with global trends towards eco-friendly personal care items. Additionally, the import increase could signify a growing preference for foreign specialty soaps or raw materials not readily available domestically.
Key Highlights of the Report:
- Croatia Bar Soap Market Outlook
- Market Size of Croatia Bar Soap Market, 2025
- Forecast of Croatia Bar Soap Market, 2032
- Historical Data and Forecast of Croatia Bar Soap Revenues & Volume for the Period 2022 - 2032
- Croatia Bar Soap Market Trend Evolution
- Croatia Bar Soap Market Drivers and Challenges
- Croatia Bar Soap Price Trends
- Croatia Bar Soap Porter's Five Forces
- Croatia Bar Soap Industry Life Cycle
- Historical Data and Forecast of Croatia Bar Soap Market Revenues & Volume By Type for the Period 2022 - 2032
- Historical Data and Forecast of Croatia Bar Soap Market Revenues & Volume By Organic for the Period 2022 - 2032
- Historical Data and Forecast of Croatia Bar Soap Market Revenues & Volume By Synthetic for the Period 2022 - 2032
- Historical Data and Forecast of Croatia Bar Soap Market Revenues & Volume By Application for the Period 2022 - 2032
- Historical Data and Forecast of Croatia Bar Soap Market Revenues & Volume By Hair Care for the Period 2022 - 2032
- Historical Data and Forecast of Croatia Bar Soap Market Revenues & Volume By Skin/Body Care for the Period 2022 - 2032
- Historical Data and Forecast of Croatia Bar Soap Market Revenues & Volume By Facial Care for the Period 2022 - 2032
- Historical Data and Forecast of Croatia Bar Soap Market Revenues & Volume By Specialized for the Period 2022 - 2032
- Historical Data and Forecast of Croatia Bar Soap Market Revenues & Volume By Distribution Channel for the Period 2022 - 2032
- Historical Data and Forecast of Croatia Bar Soap Market Revenues & Volume By Supermarkets/Hypermarkets for the Period 2022 - 2032
- Historical Data and Forecast of Croatia Bar Soap Market Revenues & Volume By Convenience Stores for the Period 2022 - 2032
- Historical Data and Forecast of Croatia Bar Soap Market Revenues & Volume By Specialty Stores for the Period 2022 - 2032
- Historical Data and Forecast of Croatia Bar Soap Market Revenues & Volume By Online Retailers for the Period 2022 - 2032
- Historical Data and Forecast of Croatia Bar Soap Market Revenues & Volume By Others for the Period 2022 - 2032
- Croatia Bar Soap Import Export Trade Statistics
- Market Opportunity Assessment By Type
- Market Opportunity Assessment By Application
- Market Opportunity Assessment By Distribution Channel
- Croatia Bar Soap Top Companies Market Share
- Croatia Bar Soap Competitive Benchmarking By Technical and Operational Parameters
- Croatia Bar Soap Company Profiles
- Croatia Bar Soap Key Strategic Recommendations
Frequently Asked Questions About the Market Study (FAQs):
6Wresearch actively monitors the Croatia Bar Soap Market and publishes its comprehensive annual report, highlighting emerging trends, growth drivers, revenue analysis, and forecast outlook. Our insights help businesses to make data-backed strategic decisions with ongoing market dynamics. Our analysts track relevent industries related to the Croatia Bar Soap Market, allowing our clients with actionable intelligence and reliable forecasts tailored to emerging regional needs.
Yes, we provide customisation as per your requirements. To learn more, feel free to contact us on sales@6wresearch.com
1 Executive Summary |
2 Introduction |
2.1 Key Highlights of the Report |
2.2 Report Description |
2.3 Market Scope & Segmentation |
2.4 Research Methodology |
2.5 Assumptions |
3 Croatia Bar Soap Market Overview |
3.1 Croatia Country Macro Economic Indicators |
3.2 Croatia Bar Soap Market Revenues & Volume, 2022 & 2032F |
3.3 Croatia Bar Soap Market - Industry Life Cycle |
3.4 Croatia Bar Soap Market - Porter's Five Forces |
3.5 Croatia Bar Soap Market Revenues & Volume Share, By Type, 2022 & 2032F |
3.6 Croatia Bar Soap Market Revenues & Volume Share, By Application, 2022 & 2032F |
3.7 Croatia Bar Soap Market Revenues & Volume Share, By Distribution Channel, 2022 & 2032F |
4 Croatia Bar Soap Market Dynamics |
4.1 Impact Analysis |
4.2 Market Drivers |
4.3 Market Restraints |
5 Croatia Bar Soap Market Trends |
6 Croatia Bar Soap Market, By Types |
6.1 Croatia Bar Soap Market, By Type |
6.1.1 Overview and Analysis |
6.1.2 Croatia Bar Soap Market Revenues & Volume, By Type, 2022 - 2032F |
6.1.3 Croatia Bar Soap Market Revenues & Volume, By Organic, 2022 - 2032F |
6.1.4 Croatia Bar Soap Market Revenues & Volume, By Synthetic, 2022 - 2032F |
6.2 Croatia Bar Soap Market, By Application |
6.2.1 Overview and Analysis |
6.2.2 Croatia Bar Soap Market Revenues & Volume, By Hair Care, 2022 - 2032F |
6.2.3 Croatia Bar Soap Market Revenues & Volume, By Skin/Body Care, 2022 - 2032F |
6.2.4 Croatia Bar Soap Market Revenues & Volume, By Facial Care, 2022 - 2032F |
6.2.5 Croatia Bar Soap Market Revenues & Volume, By Specialized, 2022 - 2032F |
6.3 Croatia Bar Soap Market, By Distribution Channel |
6.3.1 Overview and Analysis |
6.3.2 Croatia Bar Soap Market Revenues & Volume, By Supermarkets/Hypermarkets, 2022 - 2032F |
6.3.3 Croatia Bar Soap Market Revenues & Volume, By Convenience Stores, 2022 - 2032F |
6.3.4 Croatia Bar Soap Market Revenues & Volume, By Specialty Stores, 2022 - 2032F |
6.3.5 Croatia Bar Soap Market Revenues & Volume, By Online Retailers, 2022 - 2032F |
6.3.6 Croatia Bar Soap Market Revenues & Volume, By Others, 2022 - 2032F |
7 Croatia Bar Soap Market Import-Export Trade Statistics |
7.1 Croatia Bar Soap Market Export to Major Countries |
7.2 Croatia Bar Soap Market Imports from Major Countries |
8 Croatia Bar Soap Market Key Performance Indicators |
9 Croatia Bar Soap Market - Opportunity Assessment |
9.1 Croatia Bar Soap Market Opportunity Assessment, By Type, 2022 & 2032F |
9.2 Croatia Bar Soap Market Opportunity Assessment, By Application, 2022 & 2032F |
9.3 Croatia Bar Soap Market Opportunity Assessment, By Distribution Channel, 2022 & 2032F |
10 Croatia Bar Soap Market - Competitive Landscape |
10.1 Croatia Bar Soap Market Revenue Share, By Companies, 2025 |
10.2 Croatia Bar Soap Market Competitive Benchmarking, By Operating and Technical Parameters |
11 Company Profiles |
12 Recommendations |
13 Disclaimer |
Global Go To Market Strategy - 2030
Export potential enables firms to identify high-growth global markets with greater confidence by combining advanced trade intelligence with a structured quantitative methodology. The framework analyzes emerging demand trends and country-level import patterns while integrating macroeconomic and trade datasets such as GDP and population forecasts, bilateral import–export flows, tariff structures, elasticity differentials between developed and developing economies, geographic distance, and import demand projections. Using weighted trade values from 2020–2024 as the base period to project country-to-country export potential for 2030, these inputs are operationalized through calculated drivers such as gravity model parameters, tariff impact factors, and projected GDP per-capita growth. Through an analysis of hidden potentials, demand hotspots, and market conditions that are most favorable to success, this method enables firms to focus on target countries, maximize returns, and global expansion with data, backed by accuracy.
By factoring in the projected importer demand gap that is currently unmet and could be potential opportunity, it identifies the potential for the Exporter (Country) among 190 countries, against the general trade analysis, which identifies the biggest importer or exporter.
To discover high-growth global markets and optimize your business strategy:
Click Here
Pricing
- Single User License$ 1,995
- Department License$ 2,400
- Site License$ 3,120
- Global License$ 3,795

Leadership Perspectives from Industry Events
Search
Thought Leadership and Analyst Meet


Our Clients
6WResearch In News
- Doha a strategic location for EV manufacturing hub: IPA Qatar
- Demand for luxury TVs surging in the GCC, says Samsung
- Empowering Growth: The Thriving Journey of Bangladesh’s Cable Industry
- Demand for luxury TVs surging in the GCC, says Samsung
- Video call with a traditional healer? Once unthinkable, it’s now common in South Africa
- Intelligent Buildings To Smooth GCC’s Path To Net Zero
Latest Reports
- New Zealand Aseptic Manufacturing Market (2026-2032)
- Netherlands Aseptic Manufacturing Market (2026-2032)
- Nauru Aseptic Manufacturing Market (2026-2032)
- Namibia Aseptic Manufacturing Market (2026-2032)
- Mozambique Aseptic Manufacturing Market (2026-2032)
- Montenegro Aseptic Manufacturing Market (2026-2032)
- Mongolia Aseptic Manufacturing Market (2026-2032)
- Monaco Aseptic Manufacturing Market (2026-2032)
- Micronesia Aseptic Manufacturing Market (2026-2032)
- Mauritius Aseptic Manufacturing Market (2026-2032)
Industry Events and Analyst Meet

HIMTEX 2026

India Refining Summit 2026

India EV Show 2026

EV tech India Expo 2026

Auto Tech Asia 2026
Whitepaper
- Middle East & Africa Commercial Security Market Click here to view more.
- Middle East & Africa Fire Safety Systems & Equipment Market Click here to view more.
- GCC Drone Market Click here to view more.
- Middle East Lighting Fixture Market Click here to view more.
- GCC Physical & Perimeter Security Market Click here to view more.