Croatia Bulb Market (2025-2031) | Share, Companies, Outlook, Forecast, Growth, Trends, Industry, Revenue, Value, Segmentation, Analysis & Size
Market Forecast By Type (Incandescent Bulbs, Fluorescent Bulbs, CFLs, Halogens, LEDs), By Application (Lamps & Light Bulbs, Operation Theatre (OT Instruments), Torchlights and Flashlights, Automobile Headlights, Mining Headgears, Others) And Competitive Landscape
| Product Code: ETC5110813 | Publication Date: Nov 2023 | Updated Date: Oct 2025 | Product Type: Market Research Report | |
| Publisher: 6Wresearch | Author: Sachin Kumar Rai | No. of Pages: 60 | No. of Figures: 30 | No. of Tables: 5 |
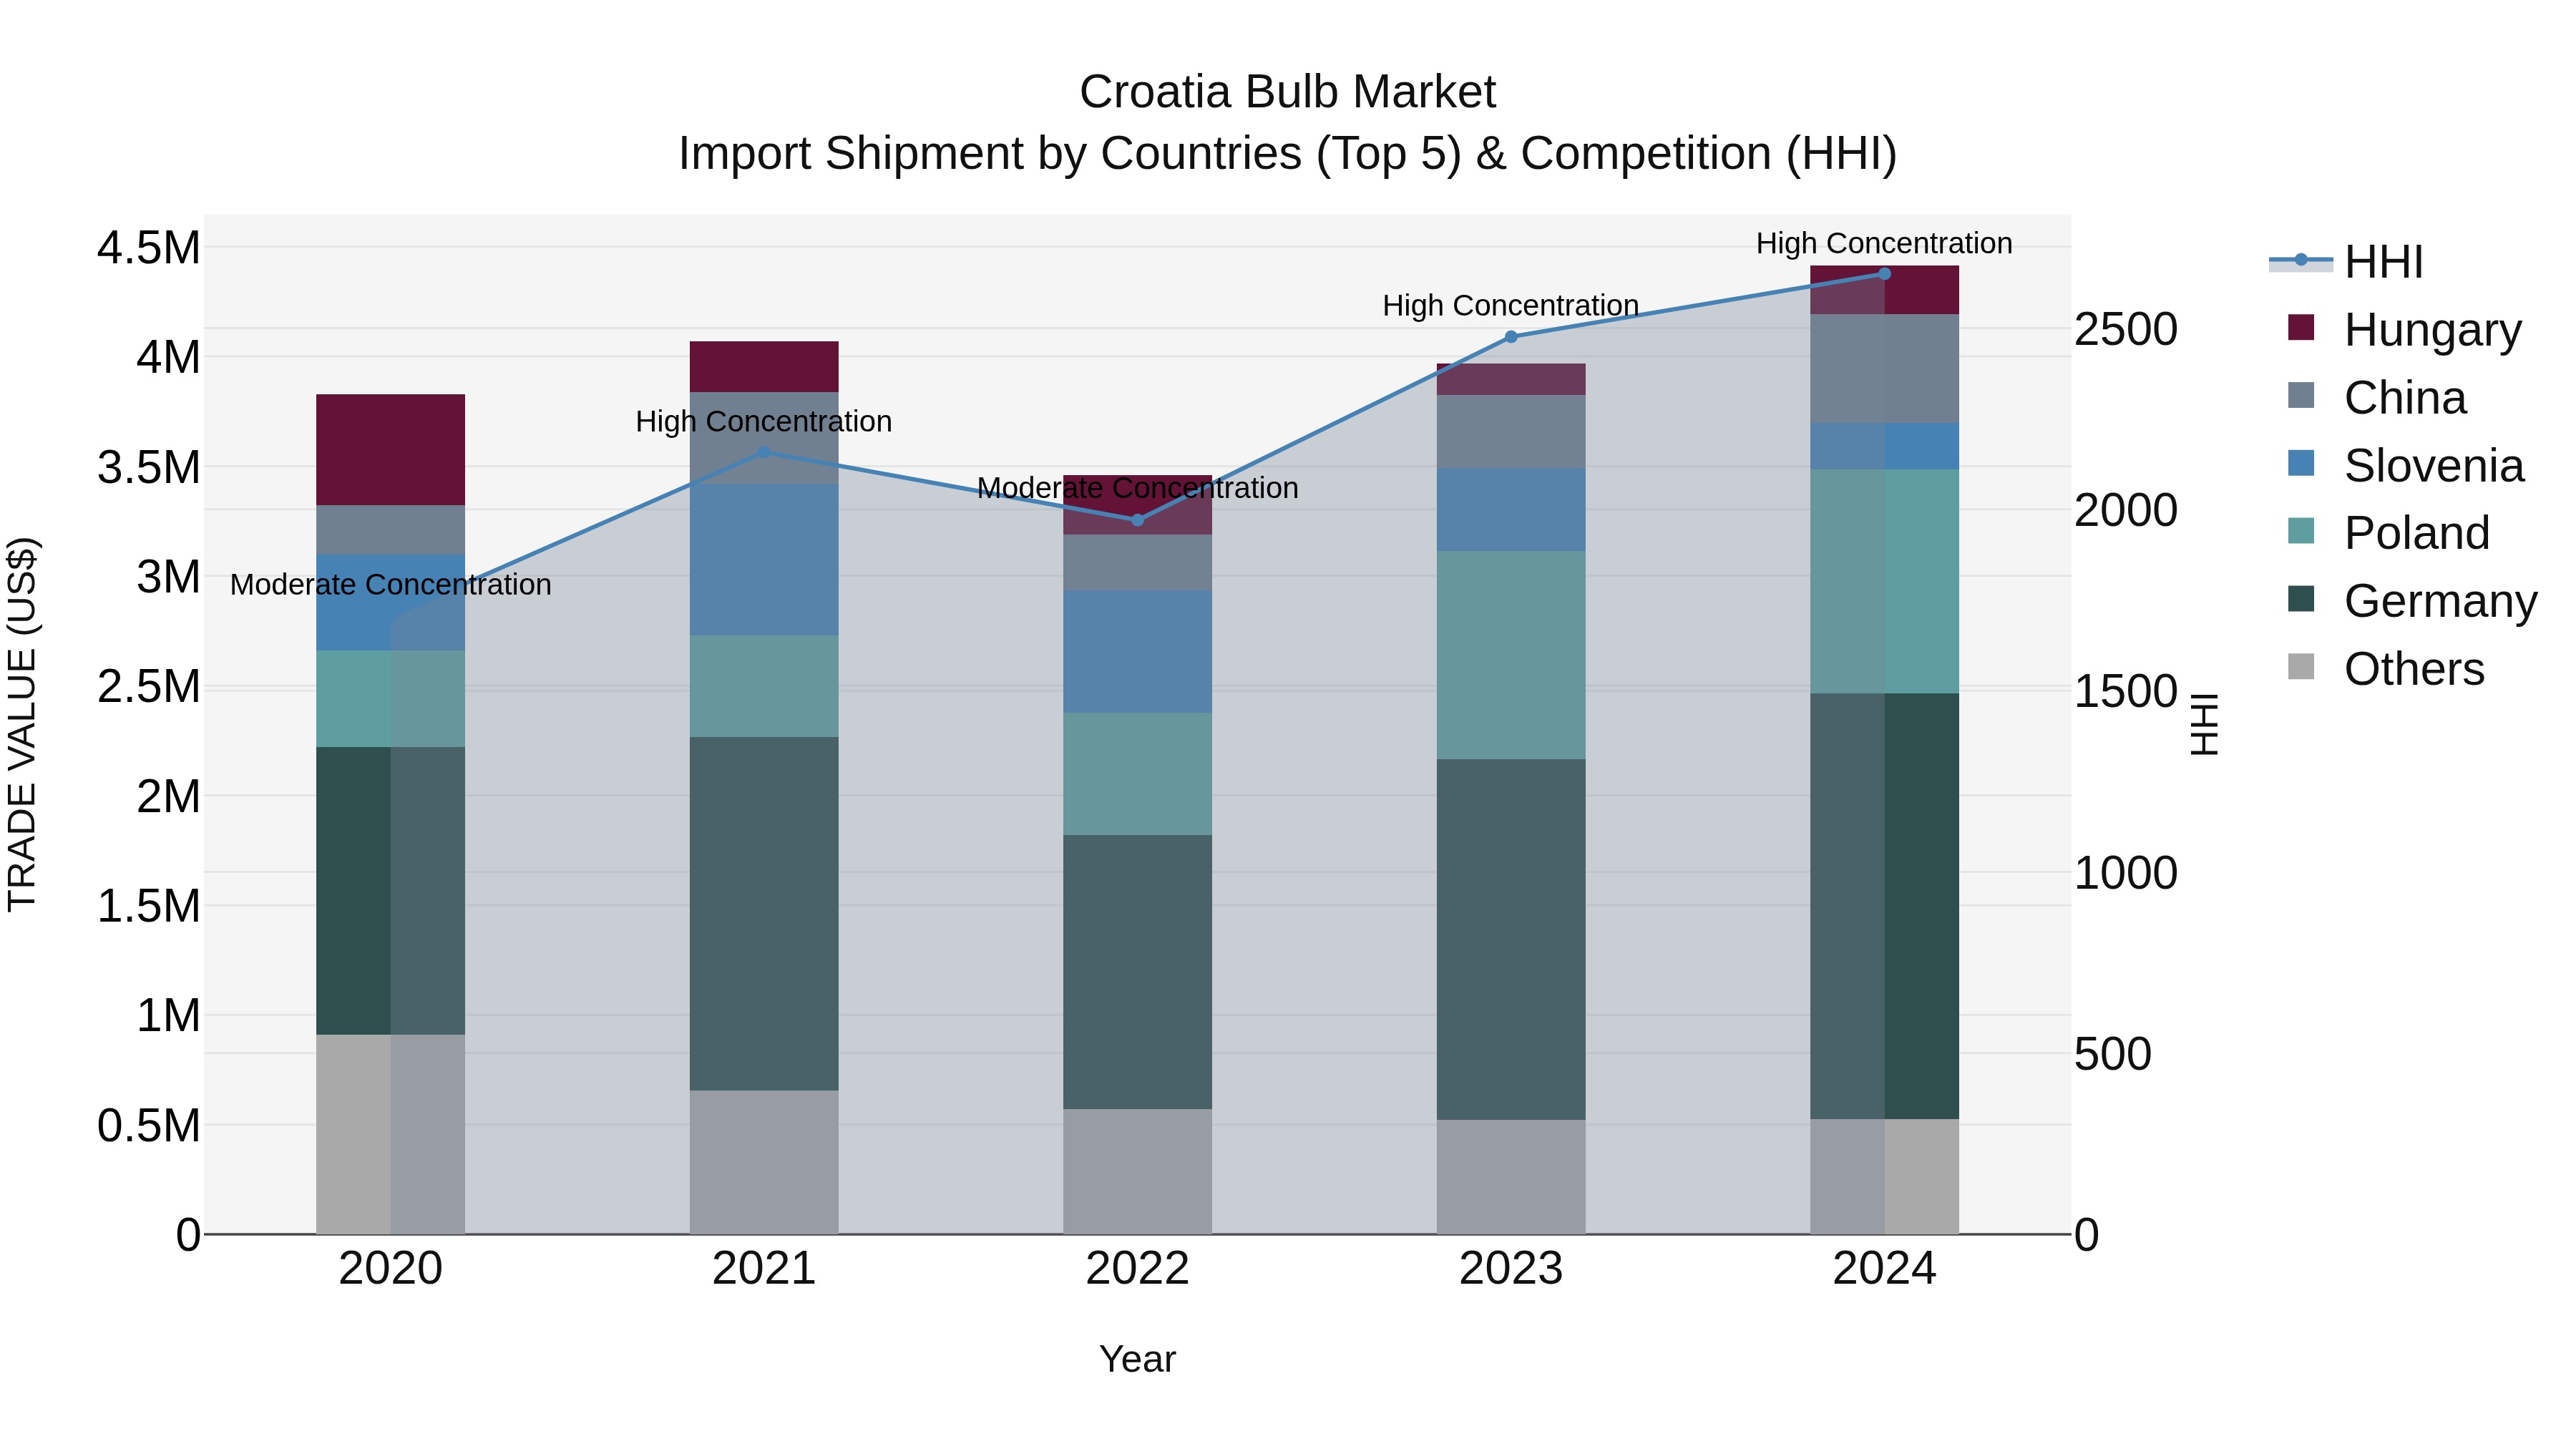
Croatia Bulb Market Top 5 Importing Countries and Market Competition (HHI) Analysis
Croatia bulb import market showed continued growth in 2024, with top exporters being Germany, Poland, China, Hungary, and Slovenia. The High Herfindahl-Hirschman Index (HHI) indicates a high concentration in the market. The compound annual growth rate (CAGR) for the period 2020-2024 was 3.62%, with a notable growth rate of 11.23% from 2023 to 2024. This data suggests a steady increase in bulb imports to Croatia, driven by key exporting countries and market concentration.
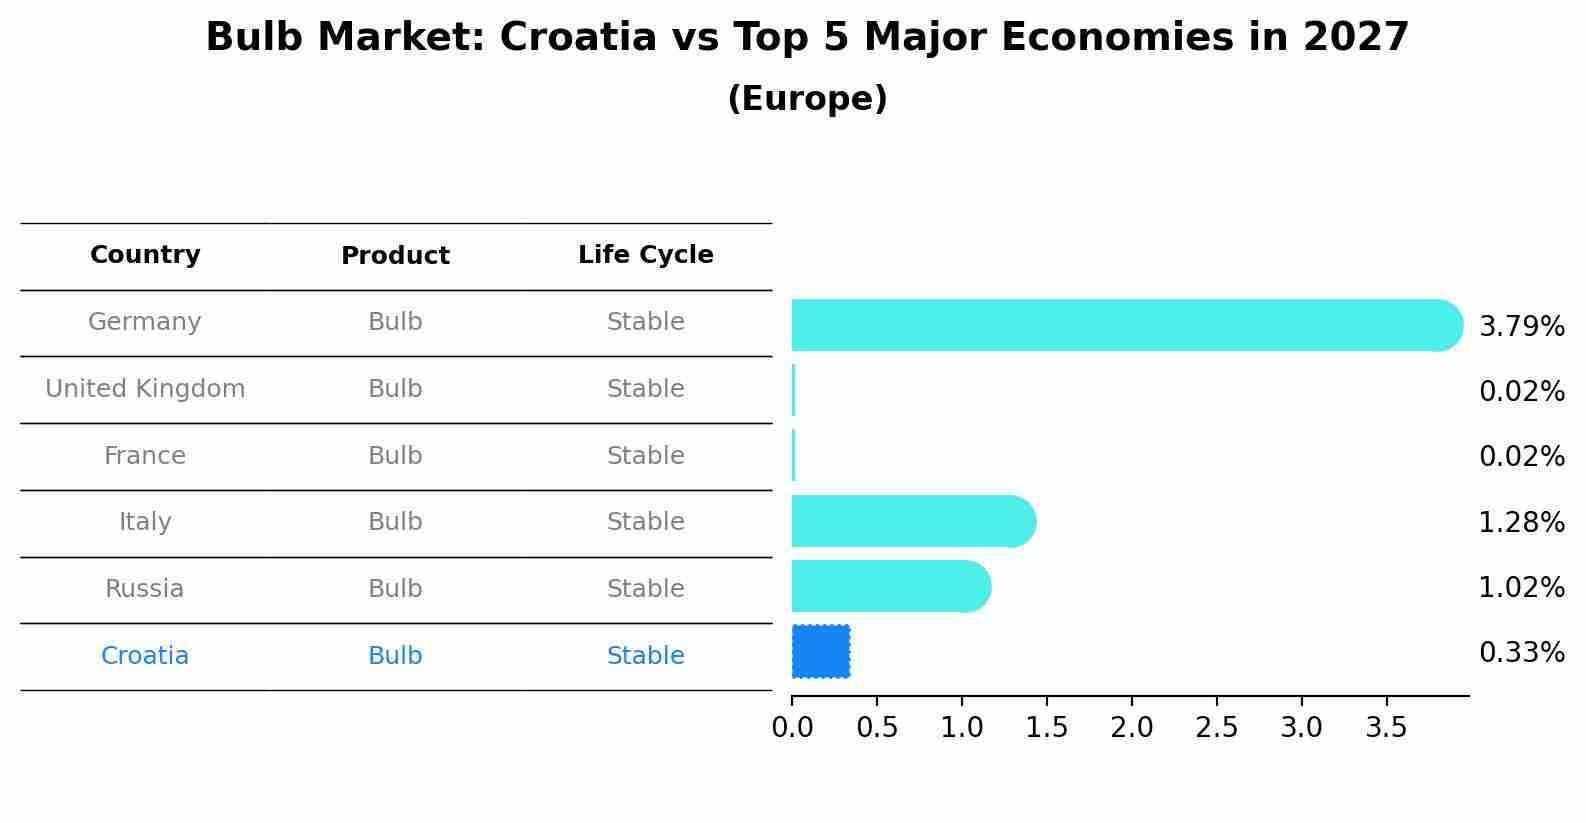
Bulb Market: Croatia vs Top 5 Major Economies in 2027 (Europe)
By 2027, Croatia's Bulb market is forecasted to achieve a stable growth rate of 0.33%, with Germany leading the Europe region, followed by United Kingdom, France, Italy and Russia.
Croatia Bulb Market Overview
The bulb market in Croatia caters to the lighting needs of households, commercial spaces, and public infrastructure. With the shift towards energy-efficient lighting, the market is witnessing increased demand for LED and compact fluorescent bulbs, replacing traditional incandescent options.
Drivers of the market
The demand for energy-efficient lighting solutions, particularly LED bulbs, drives the bulb market in Croatia. Government policies promoting energy conservation and the replacement of traditional incandescent bulbs with eco-friendly alternatives contribute to the market`s growth.
Challenges of the market
The bulb market in Croatia faces challenges related to technological advancements and regulatory compliance. The transition from traditional incandescent bulbs to energy-efficient options, such as LED and CFL bulbs, requires ongoing innovation and adaptation. Additionally, regulatory standards for energy efficiency and environmental impact are becoming more stringent, adding to production costs and complexity. The market also contends with competition from various lighting technologies and the need for continuous product development to meet changing consumer preferences and industry standards.
Government Policy of the market
The Croatian government supports the transition to energy-efficient lighting solutions, impacting the bulb market. Policies aligned with EU energy-saving initiatives, such as phasing out incandescent bulbs in favor of LED technology, drive market growth for eco-friendly lighting solutions.
Key Highlights of the Report:
- Croatia Bulb Market Outlook
- Market Size of Croatia Bulb Market, 2024
- Forecast of Croatia Bulb Market, 2031
- Historical Data and Forecast of Croatia Bulb Revenues & Volume for the Period 2021-2031
- Croatia Bulb Market Trend Evolution
- Croatia Bulb Market Drivers and Challenges
- Croatia Bulb Price Trends
- Croatia Bulb Porter`s Five Forces
- Croatia Bulb Industry Life Cycle
- Historical Data and Forecast of Croatia Bulb Market Revenues & Volume By Type for the Period 2021-2031
- Historical Data and Forecast of Croatia Bulb Market Revenues & Volume By Incandescent Bulbs for the Period 2021-2031
- Historical Data and Forecast of Croatia Bulb Market Revenues & Volume By Fluorescent Bulbs for the Period 2021-2031
- Historical Data and Forecast of Croatia Bulb Market Revenues & Volume By CFLs for the Period 2021-2031
- Historical Data and Forecast of Croatia Bulb Market Revenues & Volume By Halogens for the Period 2021-2031
- Historical Data and Forecast of Croatia Bulb Market Revenues & Volume By LEDs for the Period 2021-2031
- Historical Data and Forecast of Croatia Bulb Market Revenues & Volume By Application for the Period 2021-2031
- Historical Data and Forecast of Croatia Bulb Market Revenues & Volume By Lamps & Light Bulbs for the Period 2021-2031
- Historical Data and Forecast of Croatia Bulb Market Revenues & Volume By Operation Theatre (OT Instruments) for the Period 2021-2031
- Historical Data and Forecast of Croatia Bulb Market Revenues & Volume By Torchlights and Flashlights for the Period 2021-2031
- Historical Data and Forecast of Croatia Bulb Market Revenues & Volume By Automobile Headlights for the Period 2021-2031
- Historical Data and Forecast of Croatia Bulb Market Revenues & Volume By Mining Headgears for the Period 2021-2031
- Historical Data and Forecast of Croatia Bulb Market Revenues & Volume By Others for the Period 2021-2031
- Croatia Bulb Import Export Trade Statistics
- Market Opportunity Assessment By Type
- Market Opportunity Assessment By Application
- Croatia Bulb Top Companies Market Share
- Croatia Bulb Competitive Benchmarking By Technical and Operational Parameters
- Croatia Bulb Company Profiles
- Croatia Bulb Key Strategic Recommendations
Frequently Asked Questions About the Market Study (FAQs):
6Wresearch actively monitors the Croatia Bulb Market and publishes its comprehensive annual report, highlighting emerging trends, growth drivers, revenue analysis, and forecast outlook. Our insights help businesses to make data-backed strategic decisions with ongoing market dynamics. Our analysts track relevent industries related to the Croatia Bulb Market, allowing our clients with actionable intelligence and reliable forecasts tailored to emerging regional needs.
Yes, we provide customisation as per your requirements. To learn more, feel free to contact us on sales@6wresearch.com
1 Executive Summary |
2 Introduction |
2.1 Key Highlights of the Report |
2.2 Report Description |
2.3 Market Scope & Segmentation |
2.4 Research Methodology |
2.5 Assumptions |
3 Croatia Bulb Market Overview |
3.1 Croatia Country Macro Economic Indicators |
3.2 Croatia Bulb Market Revenues & Volume, 2021 & 2031F |
3.3 Croatia Bulb Market - Industry Life Cycle |
3.4 Croatia Bulb Market - Porter's Five Forces |
3.5 Croatia Bulb Market Revenues & Volume Share, By Type, 2021 & 2031F |
3.6 Croatia Bulb Market Revenues & Volume Share, By Application, 2021 & 2031F |
4 Croatia Bulb Market Dynamics |
4.1 Impact Analysis |
4.2 Market Drivers |
4.2.1 Increasing awareness and adoption of energy-efficient lighting solutions |
4.2.2 Growing emphasis on sustainability and environmental conservation |
4.2.3 Government initiatives promoting energy-efficient lighting technologies |
4.3 Market Restraints |
4.3.1 High initial cost of energy-efficient bulbs compared to traditional incandescent bulbs |
4.3.2 Limited consumer awareness and education about the benefits of energy-efficient bulbs |
4.3.3 Lack of infrastructure for proper disposal and recycling of used bulbs |
5 Croatia Bulb Market Trends |
6 Croatia Bulb Market Segmentations |
6.1 Croatia Bulb Market, By Type |
6.1.1 Overview and Analysis |
6.1.2 Croatia Bulb Market Revenues & Volume, By Incandescent Bulbs, 2021-2031F |
6.1.3 Croatia Bulb Market Revenues & Volume, By Fluorescent Bulbs, 2021-2031F |
6.1.4 Croatia Bulb Market Revenues & Volume, By CFLs, 2021-2031F |
6.1.5 Croatia Bulb Market Revenues & Volume, By Halogens, 2021-2031F |
6.1.6 Croatia Bulb Market Revenues & Volume, By LEDs, 2021-2031F |
6.2 Croatia Bulb Market, By Application |
6.2.1 Overview and Analysis |
6.2.2 Croatia Bulb Market Revenues & Volume, By Lamps & Light Bulbs, 2021-2031F |
6.2.3 Croatia Bulb Market Revenues & Volume, By Operation Theatre (OT Instruments), 2021-2031F |
6.2.4 Croatia Bulb Market Revenues & Volume, By Torchlights and Flashlights, 2021-2031F |
6.2.5 Croatia Bulb Market Revenues & Volume, By Automobile Headlights, 2021-2031F |
6.2.6 Croatia Bulb Market Revenues & Volume, By Mining Headgears, 2021-2031F |
6.2.7 Croatia Bulb Market Revenues & Volume, By Others, 2021-2031F |
7 Croatia Bulb Market Import-Export Trade Statistics |
7.1 Croatia Bulb Market Export to Major Countries |
7.2 Croatia Bulb Market Imports from Major Countries |
8 Croatia Bulb Market Key Performance Indicators |
8.1 Energy savings achieved through the use of energy-efficient bulbs |
8.2 Percentage of households or businesses using energy-efficient bulbs |
8.3 Number of government policies or incentives supporting energy-efficient lighting adoption |
9 Croatia Bulb Market - Opportunity Assessment |
9.1 Croatia Bulb Market Opportunity Assessment, By Type, 2021 & 2031F |
9.2 Croatia Bulb Market Opportunity Assessment, By Application, 2021 & 2031F |
10 Croatia Bulb Market - Competitive Landscape |
10.1 Croatia Bulb Market Revenue Share, By Companies, 2024 |
10.2 Croatia Bulb Market Competitive Benchmarking, By Operating and Technical Parameters |
11 Company Profiles |
12 Recommendations | 13 Disclaimer |
Export potential assessment - trade Analytics for 2030
Export potential enables firms to identify high-growth global markets with greater confidence by combining advanced trade intelligence with a structured quantitative methodology. The framework analyzes emerging demand trends and country-level import patterns while integrating macroeconomic and trade datasets such as GDP and population forecasts, bilateral import–export flows, tariff structures, elasticity differentials between developed and developing economies, geographic distance, and import demand projections. Using weighted trade values from 2020–2024 as the base period to project country-to-country export potential for 2030, these inputs are operationalized through calculated drivers such as gravity model parameters, tariff impact factors, and projected GDP per-capita growth. Through an analysis of hidden potentials, demand hotspots, and market conditions that are most favorable to success, this method enables firms to focus on target countries, maximize returns, and global expansion with data, backed by accuracy.
By factoring in the projected importer demand gap that is currently unmet and could be potential opportunity, it identifies the potential for the Exporter (Country) among 190 countries, against the general trade analysis, which identifies the biggest importer or exporter.
To discover high-growth global markets and optimize your business strategy:
Click Here
Pricing
- Single User License$ 1,995
- Department License$ 2,400
- Site License$ 3,120
- Global License$ 3,795

Search
Thought Leadership and Analyst Meet


Our Clients
Latest Reports
- Canada Cloud CFD Market (2026-2032) | Size & Revenue, Industry, Growth, Competitive Landscape, Forecast, Segmentation, Value, Outlook, Trends, Share, Analysis, Companies
- Taiwan Food Delivery Platform Market (2026-2032) | Companies, Outlook, Analysis, Trends, Value, Revenue, Segmentation, Share, Forecast, Competitive Landscape, Growth, Size & Forecast
- United Kingdom (UK) Long-term Care Insurance Market (2026-2032) | Growth, Share, Consumer Insights, Drivers, Opportunities, Competition, Pricing Analysis, Segments, Restraints, Companies, Competitive, Value, Outlook, Size, Demand, Analysis, Challenges, Strategic Insights, Investment Trends, Revenue, Trends, Supply, Forecast
- United Kingdom (UK) Long Term Care Market (2026-2032) | Companies, Outlook, Analysis, Trends, Value, Revenue, Segmentation, Share, Forecast, Competitive Landscape, Growth, Size & Forecast
- Iraq Insulation and Waterproofing Market (2026-2032) | Outlook, Drivers, Growth, Size, Share, Industry, Revenue, Trends, Demand, Competitive, Strategic Insights, Opportunities, Segments, Companies, Challenges, Strategy, Consumer Insights, Analysis, Investment Trends, Value, Segmentation, Forecast, Restraints
- India Switchgear Market Outlook (2026-2032) | Size, Share, Trends, Growth, Revenue, Forecast, Analysis, Value, Outlook
- Pakistan Contraceptive Implants Market (2025-2031) | Demand, Growth, Size, Share, Industry, Pricing Analysis, Competitive, Strategic Insights, Strategy, Consumer Insights, Analysis, Investment Trends, Opportunities, Revenue, Segments, Value, Segmentation, Supply, Forecast, Restraints, Outlook, Competition, Drivers, Trends, Companies, Challenges
- Sri Lanka Packaging Market (2026-2032) | Outlook, Competition, Drivers, Trends, Demand, Pricing Analysis, Competitive, Strategic Insights, Companies, Challenges, Strategy, Consumer Insights, Analysis, Investment Trends, Opportunities, Growth, Size, Share, Industry, Revenue, Segments, Value, Segmentation, Supply, Forecast, Restraints
- India Kids Watches Market (2026-2032) | Strategy, Consumer Insights, Analysis, Investment Trends, Opportunities, Growth, Size, Share, Industry, Revenue, Segments, Value, Segmentation, Supply, Forecast, Restraints, Outlook, Competition, Drivers, Trends, Demand, Pricing Analysis, Competitive, Strategic Insights, Companies, Challenges
- Saudi Arabia Core Assurance Service Market (2025-2031) | Strategy, Consumer Insights, Analysis, Investment Trends, Opportunities, Growth, Size, Share, Industry, Revenue, Segments, Value, Segmentation, Supply, Forecast, Restraints, Outlook, Competition, Drivers, Trends, Demand, Pricing Analysis, Competitive, Strategic Insights, Companies, Challenges
Industry Events and Analyst Meet

India EV Show 2026

EV tech India Expo 2026

Auto Tech Asia 2026

Battery Tech India 2026

Smart Production Solutions Guangzhou 2026
Whitepaper
- Middle East & Africa Commercial Security Market Click here to view more.
- Middle East & Africa Fire Safety Systems & Equipment Market Click here to view more.
- GCC Drone Market Click here to view more.
- Middle East Lighting Fixture Market Click here to view more.
- GCC Physical & Perimeter Security Market Click here to view more.
6WResearch In News
- Doha a strategic location for EV manufacturing hub: IPA Qatar
- Demand for luxury TVs surging in the GCC, says Samsung
- Empowering Growth: The Thriving Journey of Bangladesh’s Cable Industry
- Demand for luxury TVs surging in the GCC, says Samsung
- Video call with a traditional healer? Once unthinkable, it’s now common in South Africa
- Intelligent Buildings To Smooth GCC’s Path To Net Zero