Croatia Cards Market (2026-2032) | Analysis, Revenue, Forecast, Trends, Industry, Value, Size, Growth, Share, Companies, Segmentation & Outlook
Market Forecast By Type (General Purpose, Private Label), By Usage (General Purpose Re-Loadable Card, Government Benefit/Disbursement Card, Payroll Card, Others), By End-User (Retail Establishments, Corporate Institutions, Government, Financial Institutions, Others) And Competitive Landscape
| Product Code: ETC5111744 | Publication Date: Nov 2023 | Updated Date: Apr 2026 | Product Type: Market Research Report | |
| Publisher: 6Wresearch | Author: Shubham Padhi | No. of Pages: 60 | No. of Figures: 30 | No. of Tables: 5 |
Croatia Cards Market Size (2020-2030)

Croatia Cards Market has shown a remarkable growth trajectory over the years. The peak market size was recorded in 2030 at €16.83 million, with a steady increase from €1.09 million in 2020. The market experienced significant growth from 2020 to 2024, with the market size reaching €3.49 million in 2024. Forecasted market size from 2025 to 2030 is projected to continue this upward trend, with a CAGR of 30.0%. The CAGR for the period 2022-24 was an impressive 54.96%, indicating a period of rapid expansion for the market. The strong growth can be attributed to increasing consumer adoption of card payments, advancements in payment technologies, and a growing digital economy in Croatia. Looking ahead, upcoming projects in the market include the introduction of innovative payment solutions and partnerships with fintech companies to enhance customer experience and drive further market growth.
Croatia Cards Market: Production & Trade Performance (2019-2025)
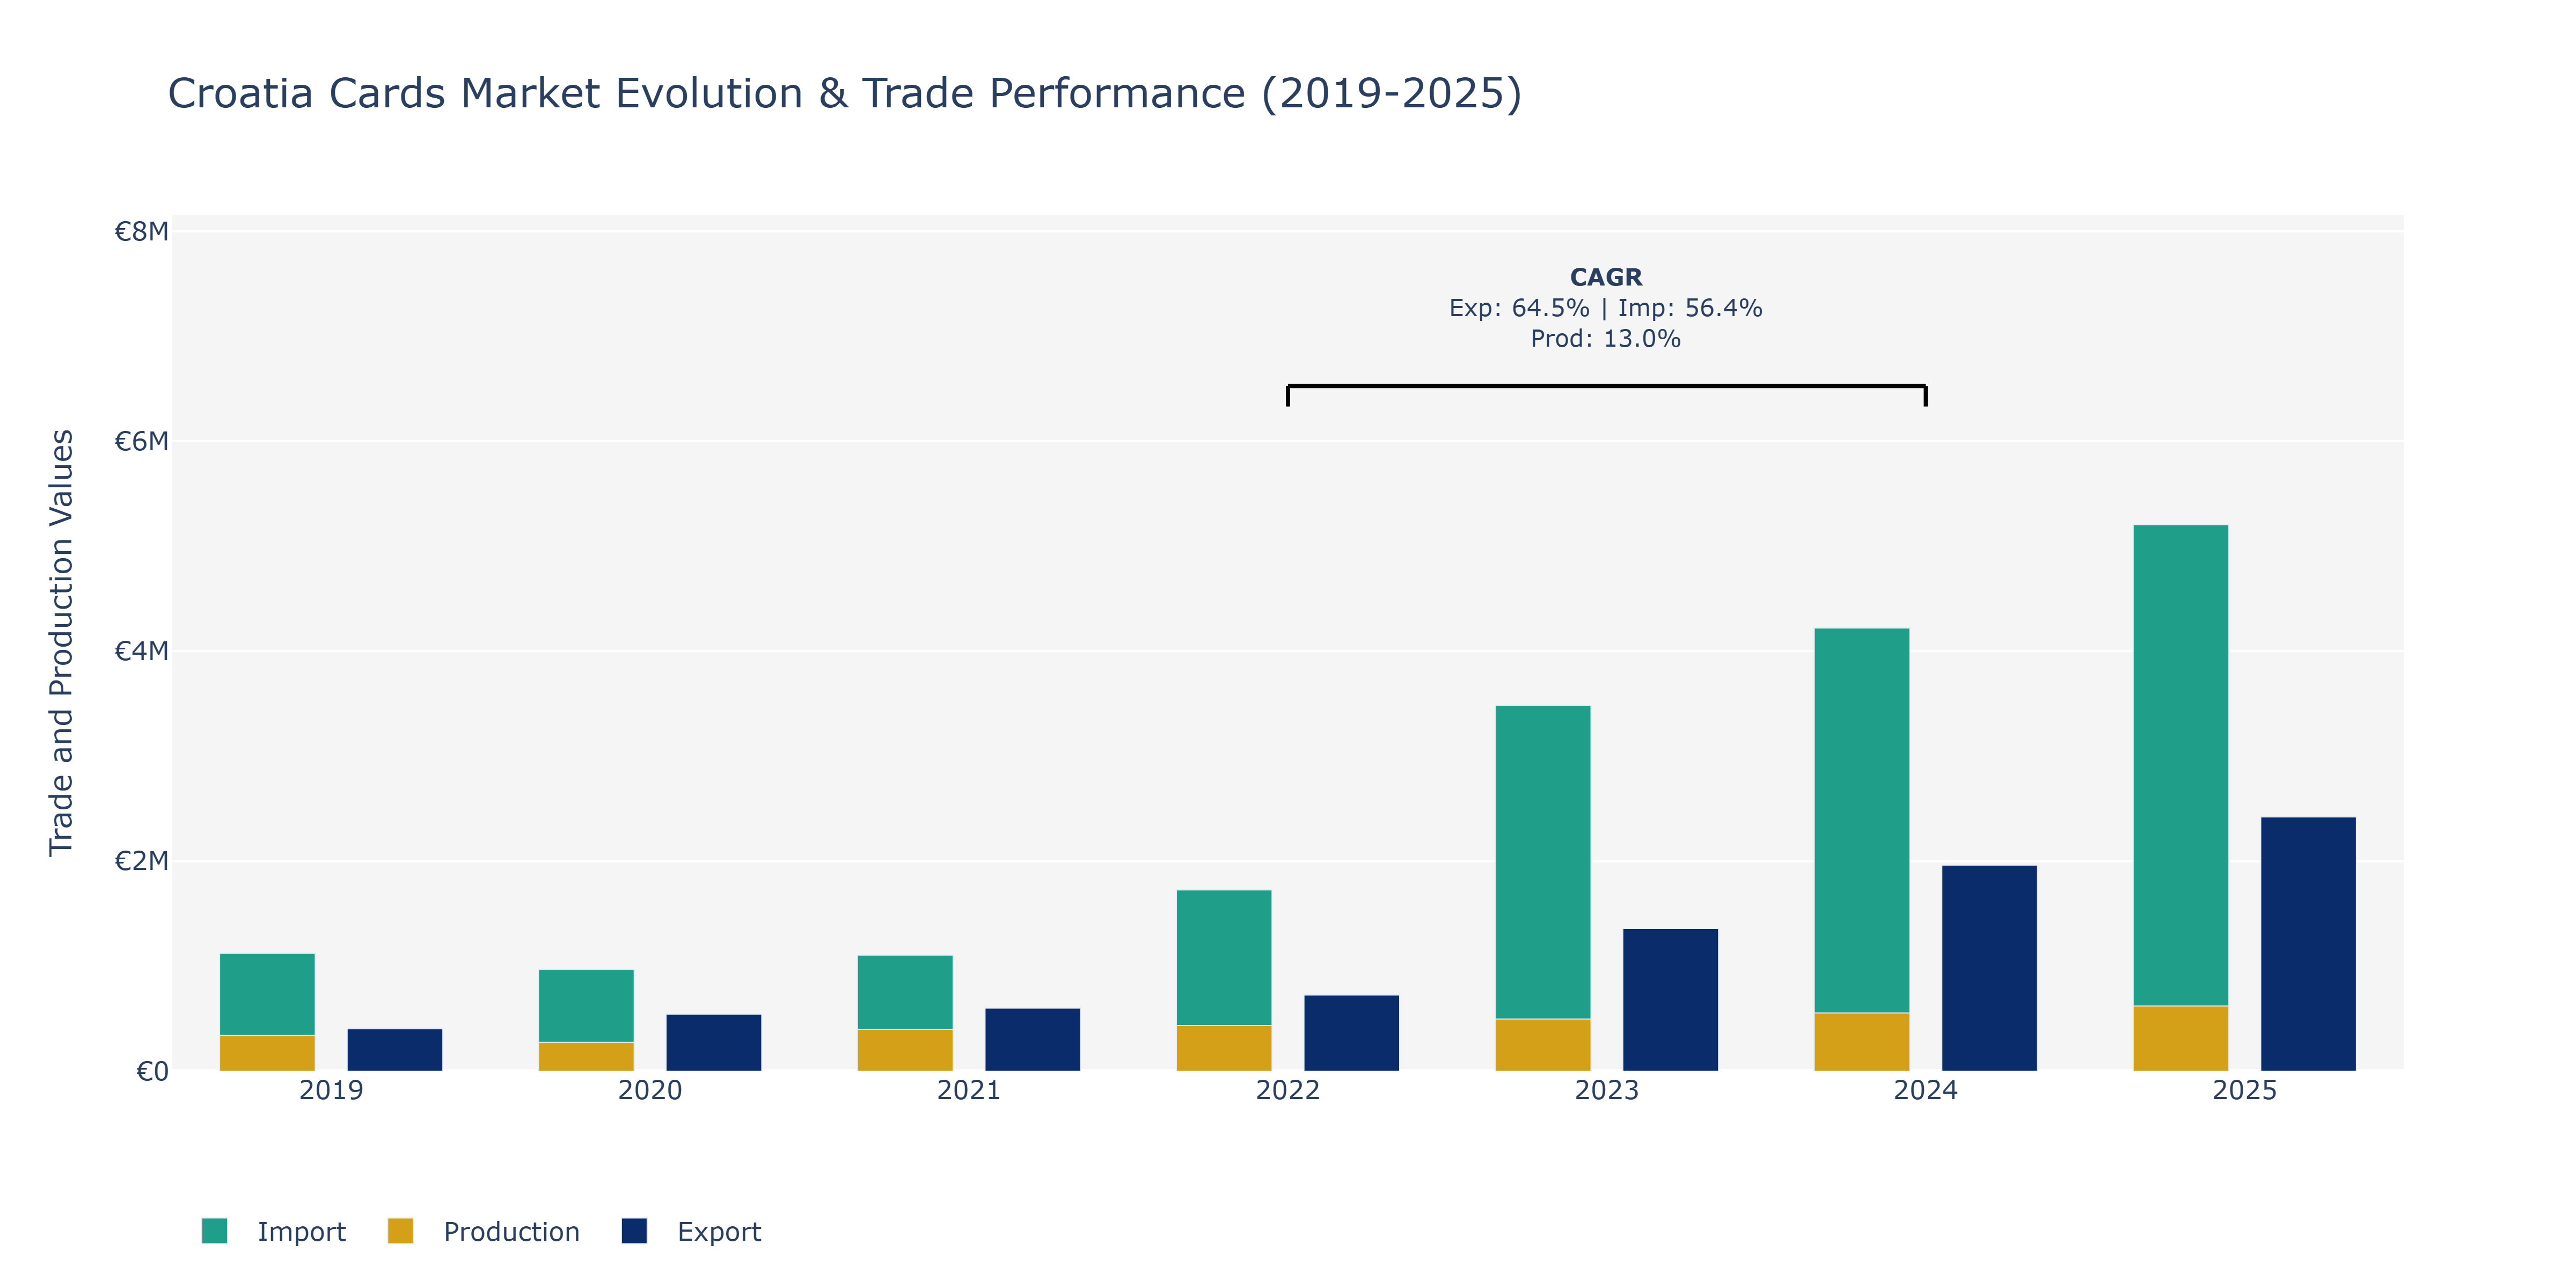
In the Croatia Cards Market, from 2019 to 2025, Exports consistently rose, reaching €2.42 million in 2025, showcasing a steady growth trajectory supported by increasing demand for Croatian card products globally. Imports mirrored this trend, growing year on year to €5.21 million in 2025, indicating a robust market with both inbound and outbound trade flourishing. Production value fluctuated, initially dropping in 2020 to €274 million but rebounding and peaking at €620 million in 2025, reflecting market adaptability and resilience. The notable CAGR for exports (64.49%) and imports (56.37%) from 2022 to 2024 underscores the market's rapid expansion and competitiveness, likely driven by innovations in card technology, strategic partnerships with international players, and government initiatives to boost the country's card industry. Such advancements align with the global trend towards digital payment systems, reinforcing Croatia's position in the evolving cards market landscape.
Key Highlights of the Report:
- Croatia Cards Market Outlook
- Market Size of Croatia Cards Market, 2025
- Forecast of Croatia Cards Market, 2032
- Historical Data and Forecast of Croatia Cards Revenues & Volume for the Period 2022 - 2032F
- Croatia Cards Market Trend Evolution
- Croatia Cards Market Drivers and Challenges
- Croatia Cards Price Trends
- Croatia Cards Porter`s Five Forces
- Croatia Cards Industry Life Cycle
- Historical Data and Forecast of Croatia Cards Market Revenues & Volume By Type for the Period 2022 - 2032F
- Historical Data and Forecast of Croatia Cards Market Revenues & Volume By General Purpose for the Period 2022 - 2032F
- Historical Data and Forecast of Croatia Cards Market Revenues & Volume By Private Label for the Period 2022 - 2032F
- Historical Data and Forecast of Croatia Cards Market Revenues & Volume By Usage for the Period 2022 - 2032F
- Historical Data and Forecast of Croatia Cards Market Revenues & Volume By General Purpose Re-Loadable Card for the Period 2022 - 2032F
- Historical Data and Forecast of Croatia Cards Market Revenues & Volume By Government Benefit/Disbursement Card for the Period 2022 - 2032F
- Historical Data and Forecast of Croatia Cards Market Revenues & Volume By Payroll Card for the Period 2022 - 2032F
- Historical Data and Forecast of Croatia Cards Market Revenues & Volume By Others for the Period 2022 - 2032F
- Historical Data and Forecast of Croatia Cards Market Revenues & Volume By End-User for the Period 2022 - 2032F
- Historical Data and Forecast of Croatia Cards Market Revenues & Volume By Retail Establishments for the Period 2022 - 2032F
- Historical Data and Forecast of Croatia Cards Market Revenues & Volume By Corporate Institutions for the Period 2022 - 2032F
- Historical Data and Forecast of Croatia Cards Market Revenues & Volume By Government for the Period 2022 - 2032F
- Historical Data and Forecast of Croatia Cards Market Revenues & Volume By Financial Institutions for the Period 2022 - 2032F
- Historical Data and Forecast of Croatia Cards Market Revenues & Volume By Others for the Period 2022 - 2032F
- Croatia Cards Import Export Trade Statistics
- Market Opportunity Assessment By Type
- Market Opportunity Assessment By Usage
- Market Opportunity Assessment By End-User
- Croatia Cards Top Companies Market Share
- Croatia Cards Competitive Benchmarking By Technical and Operational Parameters
- Croatia Cards Company Profiles
- Croatia Cards Key Strategic Recommendations
Frequently Asked Questions About the Market Study (FAQs):
6Wresearch actively monitors the Croatia Cards Market and publishes its comprehensive annual report, highlighting emerging trends, growth drivers, revenue analysis, and forecast outlook. Our insights help businesses to make data-backed strategic decisions with ongoing market dynamics. Our analysts track relevent industries related to the Croatia Cards Market, allowing our clients with actionable intelligence and reliable forecasts tailored to emerging regional needs.
Yes, we provide customisation as per your requirements. To learn more, feel free to contact us on sales@6wresearch.com
1 Executive Summary |
2 Introduction |
2.1 Key Highlights of the Report |
2.2 Report Description |
2.3 Market Scope & Segmentation |
2.4 Research Methodology |
2.5 Assumptions |
3 Croatia Cards Market Overview |
3.1 Croatia Country Macro Economic Indicators |
3.2 Croatia Cards Market Revenues & Volume, 2022 & 2032F |
3.3 Croatia Cards Market - Industry Life Cycle |
3.4 Croatia Cards Market - Porter's Five Forces |
3.5 Croatia Cards Market Revenues & Volume Share, By Type, 2022 & 2032F |
3.6 Croatia Cards Market Revenues & Volume Share, By Usage, 2022 & 2032F |
3.7 Croatia Cards Market Revenues & Volume Share, By End-User, 2022 & 2032F |
4 Croatia Cards Market Dynamics |
4.1 Impact Analysis |
4.2 Market Drivers |
4.2.1 Increasing adoption of digital payment methods in Croatia |
4.2.2 Growth in e-commerce and online shopping activities |
4.2.3 Government initiatives promoting cashless transactions |
4.3 Market Restraints |
4.3.1 Slow pace of technological advancements in the card market in Croatia |
4.3.2 High levels of credit card debt among consumers |
4.3.3 Limited merchant acceptance of card payments in certain regions |
5 Croatia Cards Market Trends |
6 Croatia Cards Market Segmentations |
6.1 Croatia Cards Market, By Type |
6.1.1 Overview and Analysis |
6.1.2 Croatia Cards Market Revenues & Volume, By General Purpose, 2022 - 2032F |
6.1.3 Croatia Cards Market Revenues & Volume, By Private Label, 2022 - 2032F |
6.2 Croatia Cards Market, By Usage |
6.2.1 Overview and Analysis |
6.2.2 Croatia Cards Market Revenues & Volume, By General Purpose Re-Loadable Card, 2022 - 2032F |
6.2.3 Croatia Cards Market Revenues & Volume, By Government Benefit/Disbursement Card, 2022 - 2032F |
6.2.4 Croatia Cards Market Revenues & Volume, By Payroll Card, 2022 - 2032F |
6.2.5 Croatia Cards Market Revenues & Volume, By Others, 2022 - 2032F |
6.3 Croatia Cards Market, By End-User |
6.3.1 Overview and Analysis |
6.3.2 Croatia Cards Market Revenues & Volume, By Retail Establishments, 2022 - 2032F |
6.3.3 Croatia Cards Market Revenues & Volume, By Corporate Institutions, 2022 - 2032F |
6.3.4 Croatia Cards Market Revenues & Volume, By Government, 2022 - 2032F |
6.3.5 Croatia Cards Market Revenues & Volume, By Financial Institutions, 2022 - 2032F |
6.3.6 Croatia Cards Market Revenues & Volume, By Others, 2022 - 2032F |
7 Croatia Cards Market Import-Export Trade Statistics |
7.1 Croatia Cards Market Export to Major Countries |
7.2 Croatia Cards Market Imports from Major Countries |
8 Croatia Cards Market Key Performance Indicators |
8.1 Average transaction value per card |
8.2 Number of contactless card transactions |
8.3 Percentage of population using cards for everyday transactions |
8.4 Number of card terminals per capita |
9 Croatia Cards Market - Opportunity Assessment |
9.1 Croatia Cards Market Opportunity Assessment, By Type, 2022 & 2032F |
9.2 Croatia Cards Market Opportunity Assessment, By Usage, 2022 & 2032F |
9.3 Croatia Cards Market Opportunity Assessment, By End-User, 2022 & 2032F |
10 Croatia Cards Market - Competitive Landscape |
10.1 Croatia Cards Market Revenue Share, By Companies, 2025 |
10.2 Croatia Cards Market Competitive Benchmarking, By Operating and Technical Parameters |
11 Company Profiles |
12 Recommendations | 13 Disclaimer |
Global Go To Market Strategy - 2030
Export potential enables firms to identify high-growth global markets with greater confidence by combining advanced trade intelligence with a structured quantitative methodology. The framework analyzes emerging demand trends and country-level import patterns while integrating macroeconomic and trade datasets such as GDP and population forecasts, bilateral import–export flows, tariff structures, elasticity differentials between developed and developing economies, geographic distance, and import demand projections. Using weighted trade values from 2020–2024 as the base period to project country-to-country export potential for 2030, these inputs are operationalized through calculated drivers such as gravity model parameters, tariff impact factors, and projected GDP per-capita growth. Through an analysis of hidden potentials, demand hotspots, and market conditions that are most favorable to success, this method enables firms to focus on target countries, maximize returns, and global expansion with data, backed by accuracy.
By factoring in the projected importer demand gap that is currently unmet and could be potential opportunity, it identifies the potential for the Exporter (Country) among 190 countries, against the general trade analysis, which identifies the biggest importer or exporter.
To discover high-growth global markets and optimize your business strategy:
Click Here
Pricing
- Single User License$ 1,995
- Department License$ 2,400
- Site License$ 3,120
- Global License$ 3,795

Leadership Perspectives from Industry Events
Search
Thought Leadership and Analyst Meet


Our Clients
6WResearch In News
- India Air Conditioner Market Set for Strong Rebound in 2026 After Weather-Led Correction and GST-Driven Recovery: 6Wresearch
- ADAS in India: How Automatic Emergency Braking, Blind Spot Detection & Driver Monitoring are Transforming Road Safety
- Doha a strategic location for EV manufacturing hub: IPA Qatar
- Demand for luxury TVs surging in the GCC, says Samsung
- Empowering Growth: The Thriving Journey of Bangladesh’s Cable Industry
- Demand for luxury TVs surging in the GCC, says Samsung
Latest Reports
- Poland Fire Protection Systems Market (2026-2032)
- Cape Verde Portable Hand-Thrown Extinguisher Market (2026-2032)
- Canada Portable Hand-Thrown Extinguisher Market (2026-2032)
- Cameroon Portable Hand-Thrown Extinguisher Market (2026-2032)
- Burundi Portable Hand-Thrown Extinguisher Market (2026-2032)
- Burkina Faso Portable Hand-Thrown Extinguisher Market (2026-2032)
- Bulgaria Portable Hand-Thrown Extinguisher Market (2026-2032)
- Brunei Portable Hand-Thrown Extinguisher Market (2026-2032)
- Botswana Portable Hand-Thrown Extinguisher Market (2026-2032)
- Bosnia and Herzegovina Portable Hand-Thrown Extinguisher Market (2026-2032)
Industry Events and Analyst Meet

HIMTEX 2026

India Refining Summit 2026

India EV Show 2026

EV tech India Expo 2026

Auto Tech Asia 2026
Whitepaper
- Middle East & Africa Commercial Security Market Click here to view more.
- Middle East & Africa Fire Safety Systems & Equipment Market Click here to view more.
- GCC Drone Market Click here to view more.
- Middle East Lighting Fixture Market Click here to view more.
- GCC Physical & Perimeter Security Market Click here to view more.