Croatia Cassava Market (2025-2031) | Companies, Share, Revenue, Value, Size, Forecast, Segmentation, Trends, Industry, Outlook, Analysis & Growth
Market Forecast By Category (Organic, Conventional), By Form (Solid, Liquid), By Application (Food & Beverages, Animal Feed, Others) And Competitive Landscape
| Product Code: ETC4839493 | Publication Date: Nov 2023 | Updated Date: Oct 2025 | Product Type: Market Research Report | |
| Publisher: 6Wresearch | Author: Sachin Kumar Rai | No. of Pages: 60 | No. of Figures: 30 | No. of Tables: 5 |
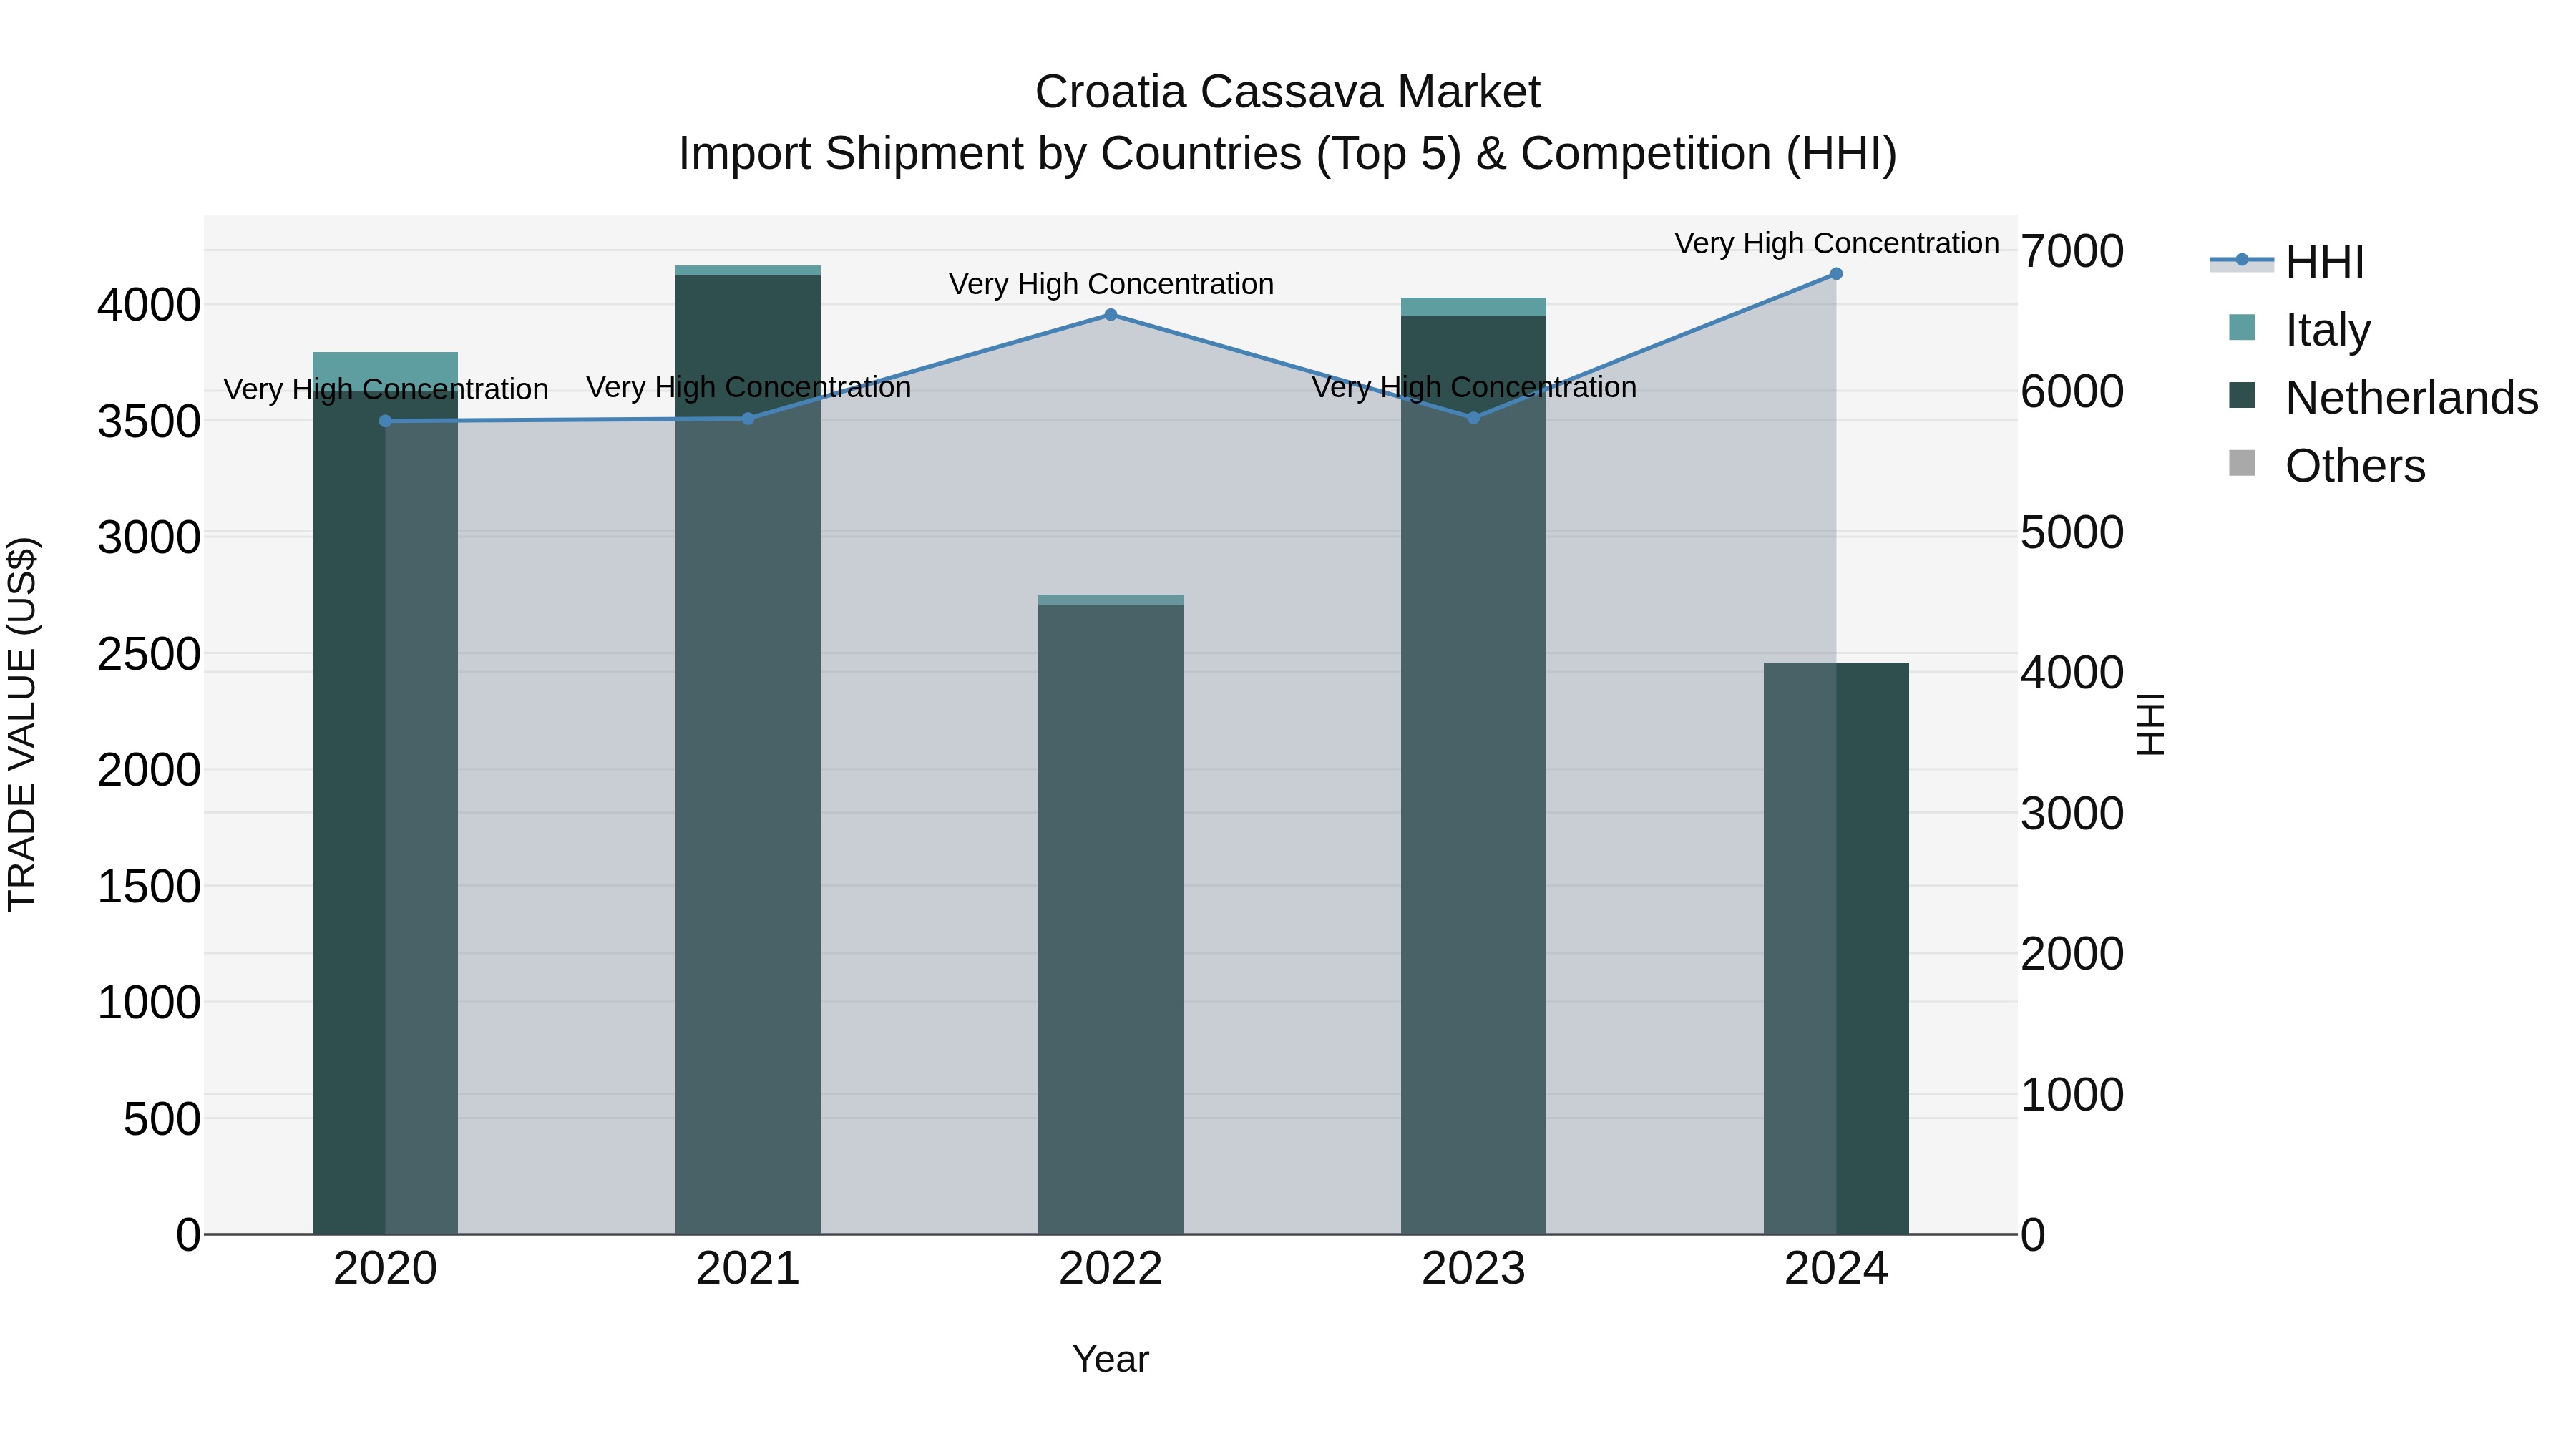
Croatia Cassava Market Top 5 Importing Countries and Market Competition (HHI) Analysis
Croatia cassava import market in 2024 continued to be dominated by the Netherlands and Italy, reflecting a high level of concentration with a high Herfindahl-Hirschman Index (HHI). The sector experienced a significant decline in compound annual growth rate (CAGR) from 2020 to 2024 at -10.28%, with a sharp downturn in growth rate in 2024 at -38.94%. These trends suggest a challenging environment for cassava importers in Croatia, possibly influenced by various factors such as market conditions, trade dynamics, and consumer preferences.
Cassava Market: Croatia vs Top 5 Major Economies in 2027 (Europe)
The Cassava market in Croatia is projected to grow at a stable growth rate of 1.46% by 2027, highlighting the country's increasing focus on advanced technologies within the Europe region, where Germany holds the dominant position, followed closely by United Kingdom, France, Italy and Russia, shaping overall regional demand.

Croatia Cassava Market Overview
The cassava market in Croatia remains niche, primarily serving the immigrant and specialty food segments. Cassava is processed into flour, starch, and other derivatives, offering a gluten-free alternative for consumers.
Drivers of the market
The cassava market in Croatia is driven by its use in food products, particularly as a gluten-free alternative to wheat flour. Cassava`s versatility and its application in ethnic and health-conscious cuisines are supporting its growing demand.
Challenges of the market
The cassava market in Croatia faces challenges related to supply chain management and market competition. Cassava production depends on agricultural factors, which can impact supply and pricing. Additionally, the market contends with competition from both local and international suppliers, affecting pricing and market share. Ensuring a stable supply of high-quality cassava while managing costs and differentiating from competitors are key challenges for the industry.
Government Policy of the market
Government policies in Croatia regarding agricultural production and food safety affect the cassava market. Although cassava is not a traditional crop in Croatia, the government supports the importation and use of cassava through regulations that ensure compliance with EU food safety standards. Policies promoting agricultural diversification and sustainable farming practices influence the availability and quality of cassava products.
Key Highlights of the Report:
- Croatia Cassava Market Outlook
- Market Size of Croatia Cassava Market, 2024
- Forecast of Croatia Cassava Market, 2031
- Historical Data and Forecast of Croatia Cassava Revenues & Volume for the Period 2021-2031
- Croatia Cassava Market Trend Evolution
- Croatia Cassava Market Drivers and Challenges
- Croatia Cassava Price Trends
- Croatia Cassava Porter`s Five Forces
- Croatia Cassava Industry Life Cycle
- Historical Data and Forecast of Croatia Cassava Market Revenues & Volume By Category for the Period 2021-2031
- Historical Data and Forecast of Croatia Cassava Market Revenues & Volume By Organic for the Period 2021-2031
- Historical Data and Forecast of Croatia Cassava Market Revenues & Volume By Conventional for the Period 2021-2031
- Historical Data and Forecast of Croatia Cassava Market Revenues & Volume By Form for the Period 2021-2031
- Historical Data and Forecast of Croatia Cassava Market Revenues & Volume By Solid for the Period 2021-2031
- Historical Data and Forecast of Croatia Cassava Market Revenues & Volume By Liquid for the Period 2021-2031
- Historical Data and Forecast of Croatia Cassava Market Revenues & Volume By Application for the Period 2021-2031
- Historical Data and Forecast of Croatia Cassava Market Revenues & Volume By Food & Beveragesfor the Period 2021-2031
- Historical Data and Forecast of Croatia Cassava Market Revenues & Volume By Animal Feed for the Period 2021-2031
- Historical Data and Forecast of Croatia Cassava Market Revenues & Volume By Others for the Period 2021-2031
- Croatia Cassava Import Export Trade Statistics
- Market Opportunity Assessment By Category
- Market Opportunity Assessment By Form
- Market Opportunity Assessment By Application
- Croatia Cassava Top Companies Market Share
- Croatia Cassava Competitive Benchmarking By Technical and Operational Parameters
- Croatia Cassava Company Profiles
- Croatia Cassava Key Strategic Recommendations
Frequently Asked Questions About the Market Study (FAQs):
6Wresearch actively monitors the Croatia Cassava Market and publishes its comprehensive annual report, highlighting emerging trends, growth drivers, revenue analysis, and forecast outlook. Our insights help businesses to make data-backed strategic decisions with ongoing market dynamics. Our analysts track relevent industries related to the Croatia Cassava Market, allowing our clients with actionable intelligence and reliable forecasts tailored to emerging regional needs.
Yes, we provide customisation as per your requirements. To learn more, feel free to contact us on sales@6wresearch.com
1 Executive Summary |
2 Introduction |
2.1 Key Highlights of the Report |
2.2 Report Description |
2.3 Market Scope & Segmentation |
2.4 Research Methodology |
2.5 Assumptions |
3 Croatia Cassava Market Overview |
3.1 Croatia Country Macro Economic Indicators |
3.2 Croatia Cassava Market Revenues & Volume, 2021 & 2031F |
3.3 Croatia Cassava Market - Industry Life Cycle |
3.4 Croatia Cassava Market - Porter's Five Forces |
3.5 Croatia Cassava Market Revenues & Volume Share, By Category, 2021 & 2031F |
3.6 Croatia Cassava Market Revenues & Volume Share, By Form, 2021 & 2031F |
3.7 Croatia Cassava Market Revenues & Volume Share, By Application, 2021 & 2031F |
4 Croatia Cassava Market Dynamics |
4.1 Impact Analysis |
4.2 Market Drivers |
4.2.1 Increasing demand for gluten-free and grain-free food products |
4.2.2 Rising awareness about the health benefits of cassava consumption |
4.2.3 Growing popularity of ethnic cuisines in Croatia |
4.3 Market Restraints |
4.3.1 Vulnerability to pests and diseases affecting cassava production |
4.3.2 Climate change impacting cassava cultivation |
4.3.3 Limited availability of skilled labor for cassava farming |
5 Croatia Cassava Market Trends |
6 Croatia Cassava Market Segmentations |
6.1 Croatia Cassava Market, By Category |
6.1.1 Overview and Analysis |
6.1.2 Croatia Cassava Market Revenues & Volume, By Organic, 2021-2031F |
6.1.3 Croatia Cassava Market Revenues & Volume, By Conventional, 2021-2031F |
6.2 Croatia Cassava Market, By Form |
6.2.1 Overview and Analysis |
6.2.2 Croatia Cassava Market Revenues & Volume, By Solid, 2021-2031F |
6.2.3 Croatia Cassava Market Revenues & Volume, By Liquid, 2021-2031F |
6.3 Croatia Cassava Market, By Application |
6.3.1 Overview and Analysis |
6.3.2 Croatia Cassava Market Revenues & Volume, By Food & Beverages? , 2021-2031F |
6.3.3 Croatia Cassava Market Revenues & Volume, By Animal Feed, 2021-2031F |
6.3.4 Croatia Cassava Market Revenues & Volume, By Others, 2021-2031F |
7 Croatia Cassava Market Import-Export Trade Statistics |
7.1 Croatia Cassava Market Export to Major Countries |
7.2 Croatia Cassava Market Imports from Major Countries |
8 Croatia Cassava Market Key Performance Indicators |
8.1 Average selling price of cassava products |
8.2 Number of new cassava-based product launches in the market |
8.3 Adoption rate of cassava farming best practices and technologies |
9 Croatia Cassava Market - Opportunity Assessment |
9.1 Croatia Cassava Market Opportunity Assessment, By Category, 2021 & 2031F |
9.2 Croatia Cassava Market Opportunity Assessment, By Form, 2021 & 2031F |
9.3 Croatia Cassava Market Opportunity Assessment, By Application, 2021 & 2031F |
10 Croatia Cassava Market - Competitive Landscape |
10.1 Croatia Cassava Market Revenue Share, By Companies, 2024 |
10.2 Croatia Cassava Market Competitive Benchmarking, By Operating and Technical Parameters |
11 Company Profiles |
12 Recommendations | 13 Disclaimer |
Global Go To Market Strategy - 2030
Export potential enables firms to identify high-growth global markets with greater confidence by combining advanced trade intelligence with a structured quantitative methodology. The framework analyzes emerging demand trends and country-level import patterns while integrating macroeconomic and trade datasets such as GDP and population forecasts, bilateral import–export flows, tariff structures, elasticity differentials between developed and developing economies, geographic distance, and import demand projections. Using weighted trade values from 2020–2024 as the base period to project country-to-country export potential for 2030, these inputs are operationalized through calculated drivers such as gravity model parameters, tariff impact factors, and projected GDP per-capita growth. Through an analysis of hidden potentials, demand hotspots, and market conditions that are most favorable to success, this method enables firms to focus on target countries, maximize returns, and global expansion with data, backed by accuracy.
By factoring in the projected importer demand gap that is currently unmet and could be potential opportunity, it identifies the potential for the Exporter (Country) among 190 countries, against the general trade analysis, which identifies the biggest importer or exporter.
To discover high-growth global markets and optimize your business strategy:
Click Here
Pricing
- Single User License$ 1,995
- Department License$ 2,400
- Site License$ 3,120
- Global License$ 3,795

Leadership Perspectives from Industry Events
Search
Thought Leadership and Analyst Meet


Our Clients
6WResearch In News
- Doha a strategic location for EV manufacturing hub: IPA Qatar
- Demand for luxury TVs surging in the GCC, says Samsung
- Empowering Growth: The Thriving Journey of Bangladesh’s Cable Industry
- Demand for luxury TVs surging in the GCC, says Samsung
- Video call with a traditional healer? Once unthinkable, it’s now common in South Africa
- Intelligent Buildings To Smooth GCC’s Path To Net Zero
Latest Reports
- Poland Fire Protection Systems Market (2026-2032)
- Cape Verde Portable Hand-Thrown Extinguisher Market (2026-2032)
- Canada Portable Hand-Thrown Extinguisher Market (2026-2032)
- Cameroon Portable Hand-Thrown Extinguisher Market (2026-2032)
- Burundi Portable Hand-Thrown Extinguisher Market (2026-2032)
- Burkina Faso Portable Hand-Thrown Extinguisher Market (2026-2032)
- Bulgaria Portable Hand-Thrown Extinguisher Market (2026-2032)
- Brunei Portable Hand-Thrown Extinguisher Market (2026-2032)
- Botswana Portable Hand-Thrown Extinguisher Market (2026-2032)
- Bosnia and Herzegovina Portable Hand-Thrown Extinguisher Market (2026-2032)
Industry Events and Analyst Meet

HIMTEX 2026

India Refining Summit 2026

India EV Show 2026

EV tech India Expo 2026

Auto Tech Asia 2026
Whitepaper
- Middle East & Africa Commercial Security Market Click here to view more.
- Middle East & Africa Fire Safety Systems & Equipment Market Click here to view more.
- GCC Drone Market Click here to view more.
- Middle East Lighting Fixture Market Click here to view more.
- GCC Physical & Perimeter Security Market Click here to view more.