Croatia Decanter Market (2026-2032) | Investment Trends, Value, Strategy, Demand, Supply, Outlook, Share, Segmentation, Trends, Analysis, Competition, Size, Pricing Analysis, Growth, Industry, Forecast, Revenue, Segments, Companies, Strategic Insights, Drivers, Challenges, Consumer Insights, Competitive, Restraints, Opportunities
Market Forecast By Type (Glass, Stainless, Steel, Plastic), By Application (Wine, Water, Spirits), By End User (Residential, Commercial), By Distribution (Retail, Online) And Competitive Landscape
| Product Code: ETC11960213 | Publication Date: Apr 2025 | Updated Date: Apr 2026 | Product Type: Market Research Report | |
| Publisher: 6Wresearch | Author: Sachin Kumar Rai | No. of Pages: 65 | No. of Figures: 34 | No. of Tables: 19 |
Croatia Decanter Market Size (2020-2030)
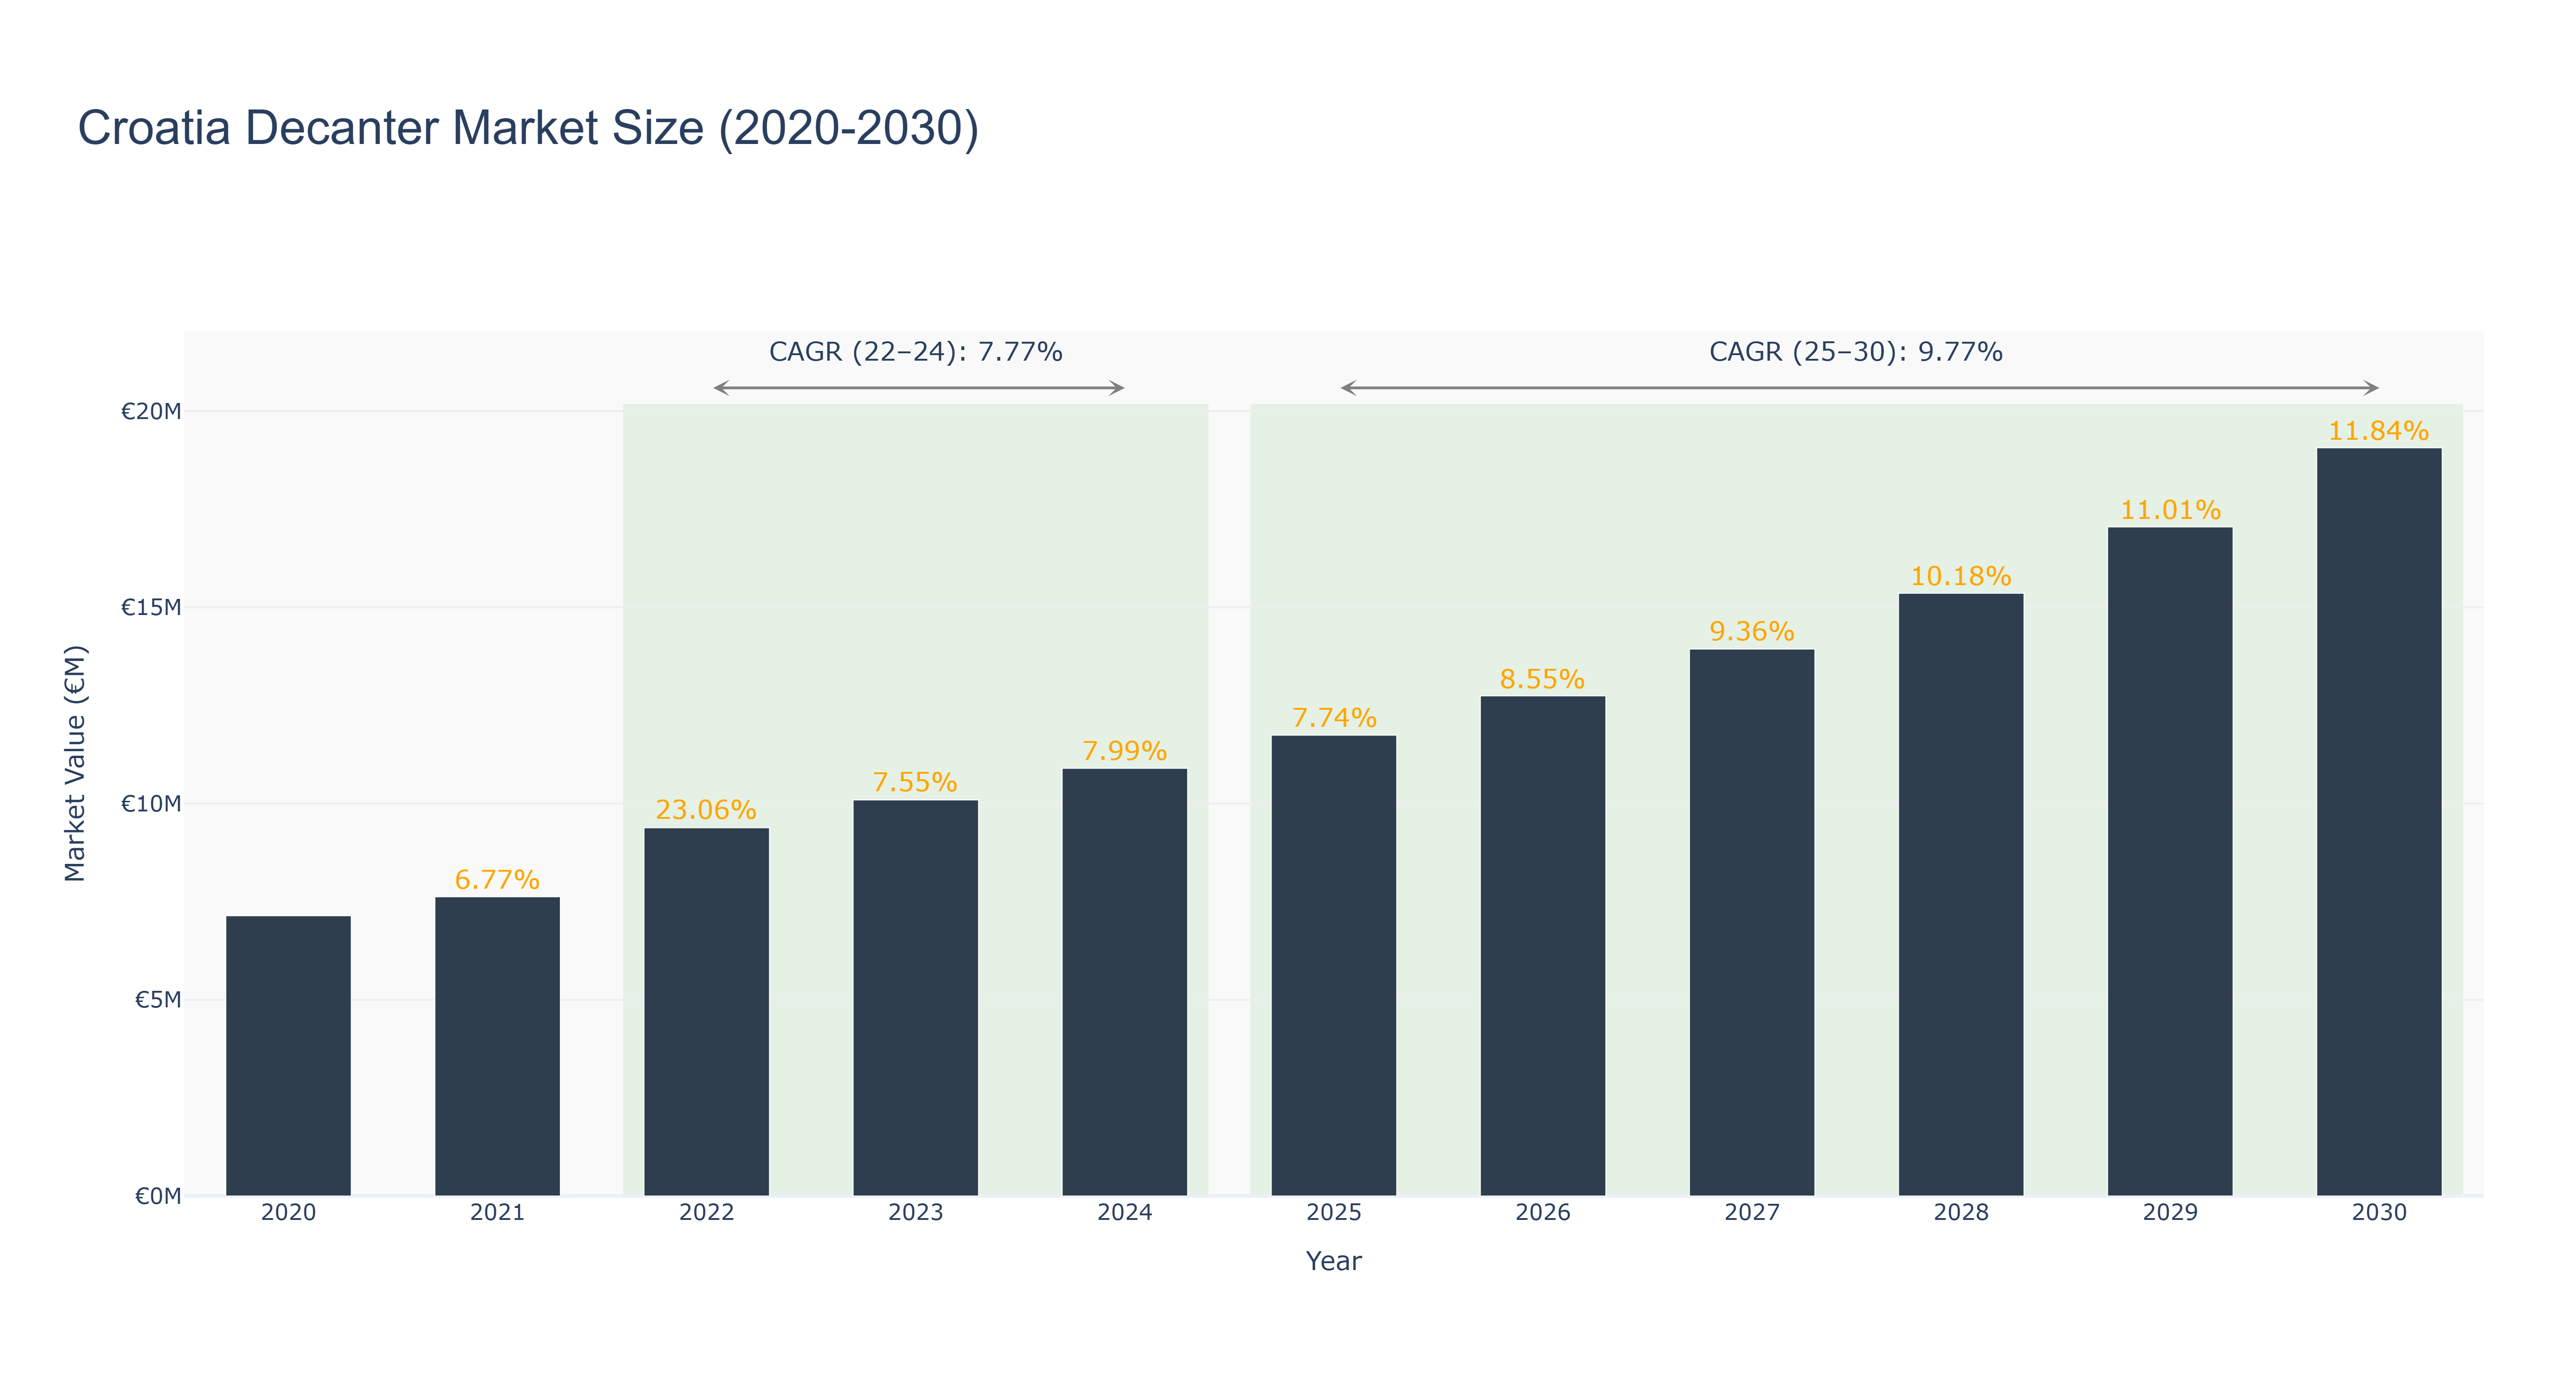
The Croatia Decanter Market has shown robust growth from 2020 to 2024, with market size expanding from €7.14 million in 2020 to €10.90 million in 2024, reflecting an impressive Compound Annual Growth Rate (CAGR) of 7.77% during this actual period. The peak in market size occurred in 2022 at €9.38 million, driven by increased consumer interest in premium beverage experiences and a rise in tourism. Looking ahead, the forecasted period from 2025 to 2030 anticipates further expansion, with projected market sizes reaching €19.07 million by 2030, corresponding to a CAGR of 9.77%. This growth is expected to be fueled by ongoing investments in hospitality and gastronomy, alongside a rising trend of home entertaining. Additionally, the growing awareness of wine culture in Croatia is likely to bolster demand for decanters, positioning the market for sustained advancement in the coming years.
Croatia Decanter Market: Production & Trade Performance (2019-2025)
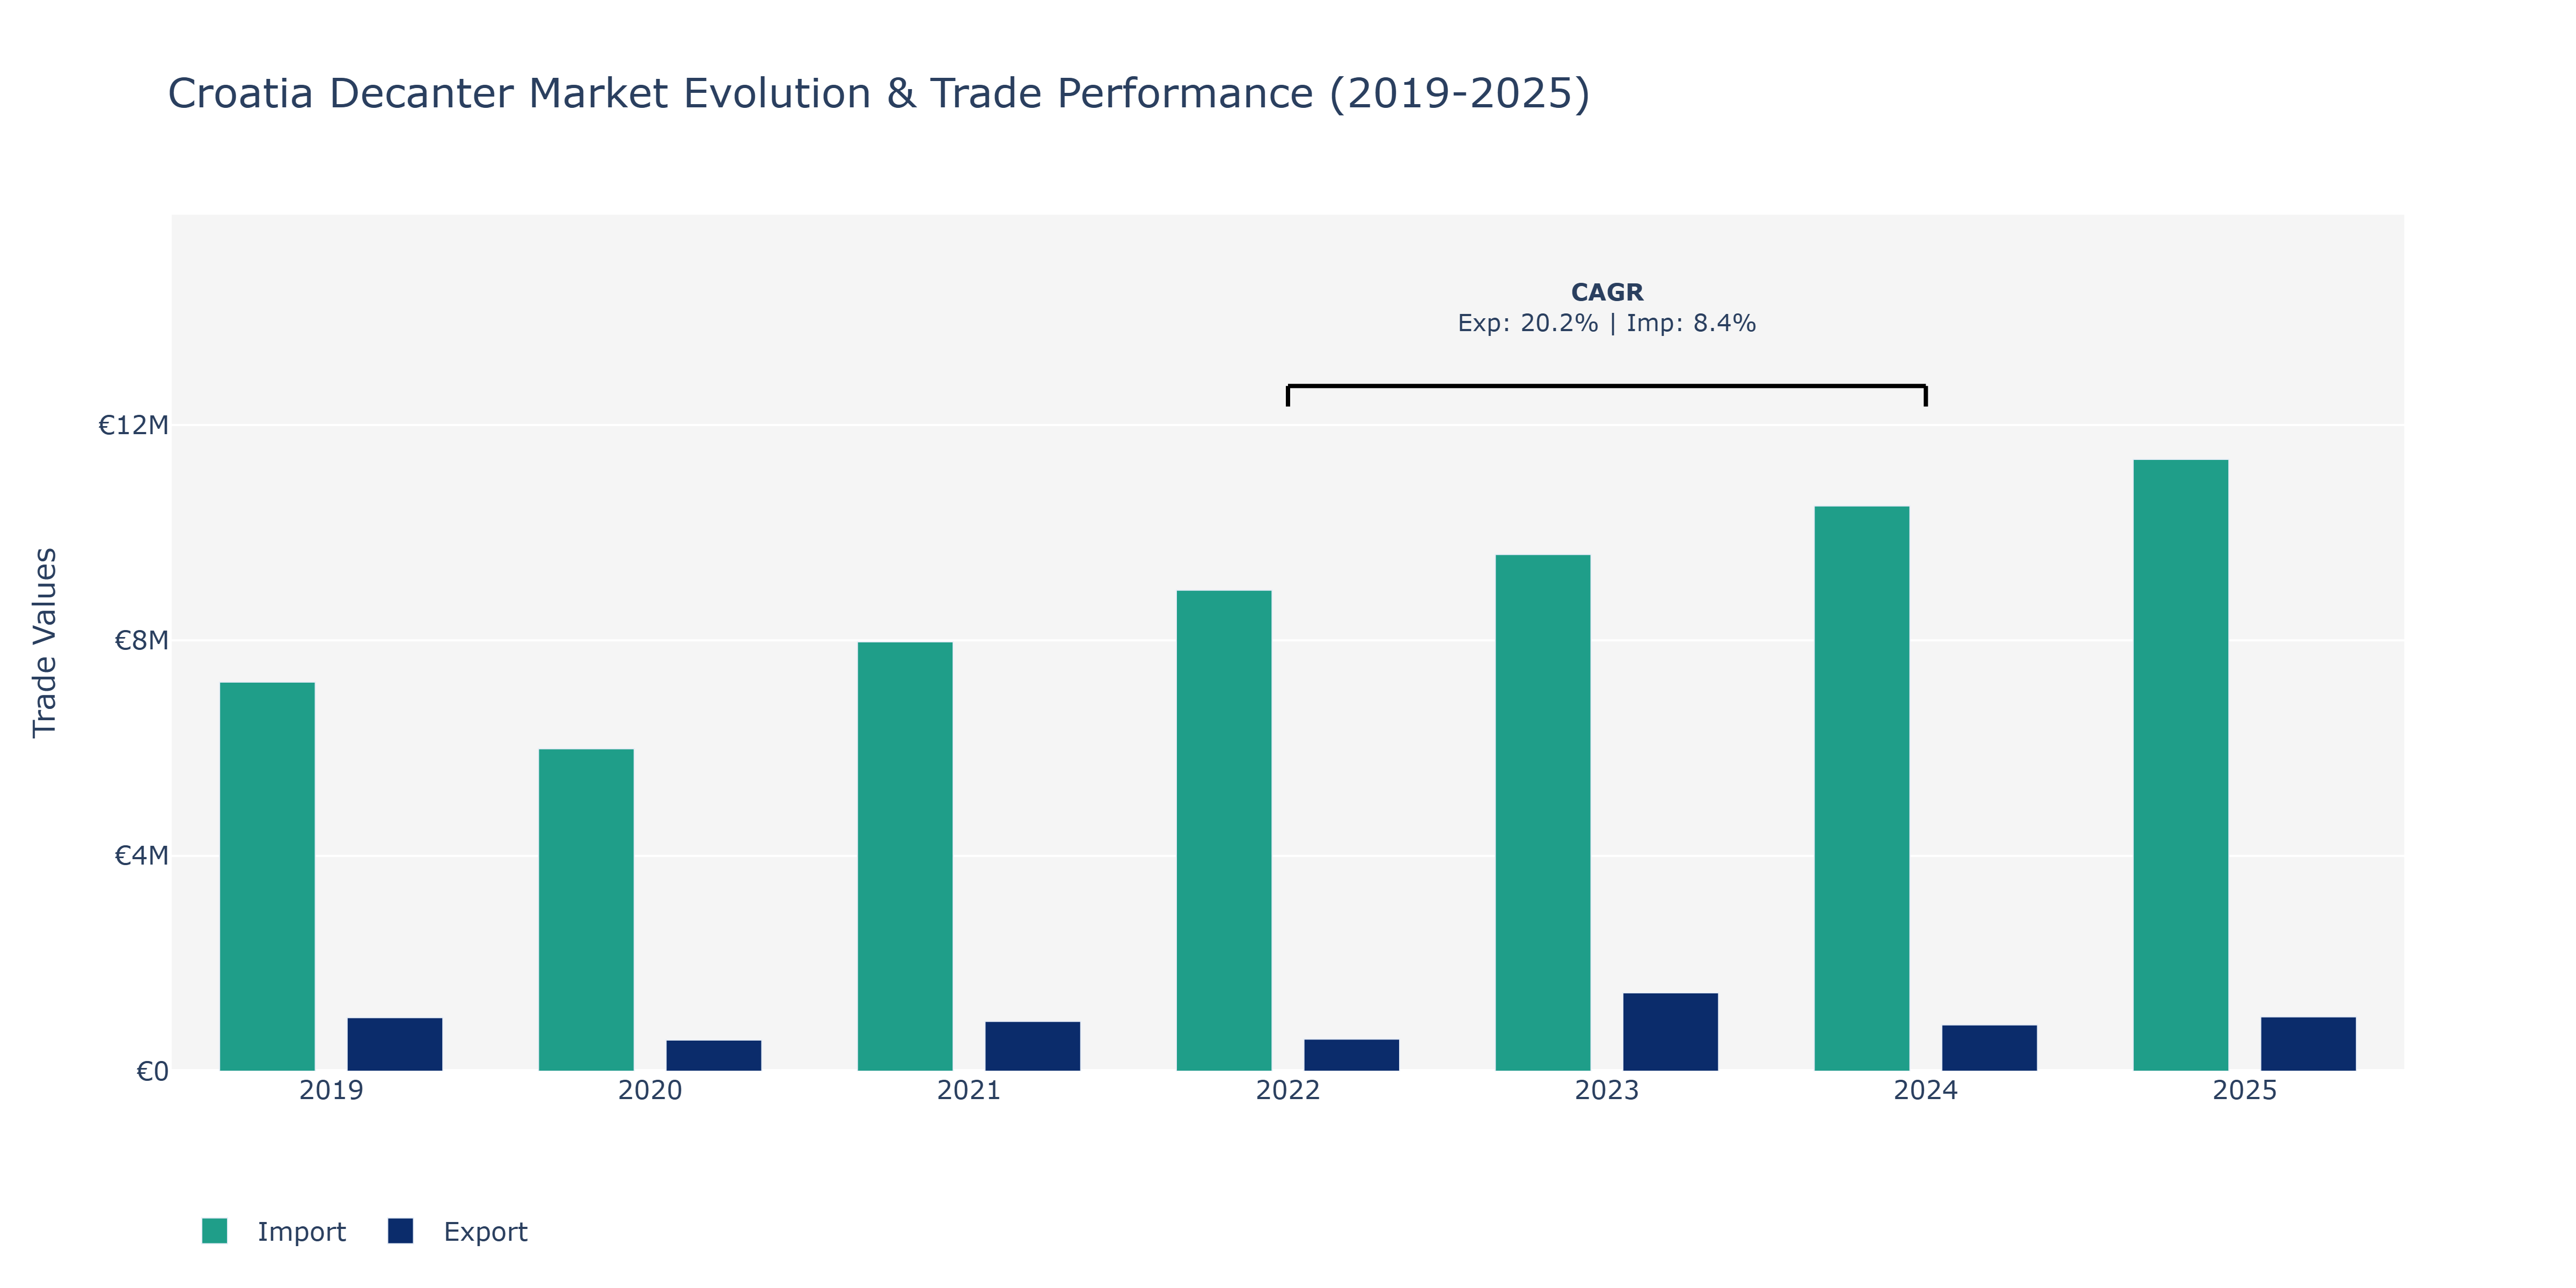
During the period under review, the Croatia Decanter Market witnessed notable fluctuations in both Exports and Imports. Exports started at €994.9 thousand in 2019, dipped to €578.16 thousand in 2020, then surged to €1.45 million in 2023 before slightly declining to €1.01 million in 2025. In contrast, Imports followed a consistent upward trajectory from €7.23 million in 2019 to €11.36 million in 2025. The peak point for Exports was 2023, while Imports showed steady growth annually. These shifts in trade dynamics can be attributed to various factors such as changes in global demand for decanters, fluctuations in currency exchange rates affecting pricing competitiveness, as well as evolving trade agreements impacting market access. The increase in exports post-2020 aligns with the recovery of global markets post-pandemic, reflected in the rebounding demand for luxury goods like decanters. On the import side, the steady growth signifies Croatia's reliance on imported components or finished decanter products to meet domestic demand. To sustain market competitiveness, local decanter manufacturers may need to focus on product innovation, quality enhancement, and strategic pricing strategies amidst evolving global trade conditions.
Key Highlights of the Report:
- Croatia Decanter Market Outlook
- Market Size of Croatia Decanter Market, 2025
- Forecast of Croatia Decanter Market, 2032
- Historical Data and Forecast of Croatia Decanter Revenues & Volume for the Period 2022 - 2032F
- Croatia Decanter Market Trend Evolution
- Croatia Decanter Market Drivers and Challenges
- Croatia Decanter Price Trends
- Croatia Decanter Porter's Five Forces
- Croatia Decanter Industry Life Cycle
- Historical Data and Forecast of Croatia Decanter Market Revenues & Volume By Type for the Period 2022 - 2032F
- Historical Data and Forecast of Croatia Decanter Market Revenues & Volume By Glass for the Period 2022 - 2032F
- Historical Data and Forecast of Croatia Decanter Market Revenues & Volume By Stainless for the Period 2022 - 2032F
- Historical Data and Forecast of Croatia Decanter Market Revenues & Volume By Steel for the Period 2022 - 2032F
- Historical Data and Forecast of Croatia Decanter Market Revenues & Volume By Plastic for the Period 2022 - 2032F
- Historical Data and Forecast of Croatia Decanter Market Revenues & Volume By Application for the Period 2022 - 2032F
- Historical Data and Forecast of Croatia Decanter Market Revenues & Volume By Wine for the Period 2022 - 2032F
- Historical Data and Forecast of Croatia Decanter Market Revenues & Volume By Water for the Period 2022 - 2032F
- Historical Data and Forecast of Croatia Decanter Market Revenues & Volume By Spirits for the Period 2022 - 2032F
- Historical Data and Forecast of Croatia Decanter Market Revenues & Volume By End User for the Period 2022 - 2032F
- Historical Data and Forecast of Croatia Decanter Market Revenues & Volume By Residential for the Period 2022 - 2032F
- Historical Data and Forecast of Croatia Decanter Market Revenues & Volume By Commercial for the Period 2022 - 2032F
- Historical Data and Forecast of Croatia Decanter Market Revenues & Volume By Distribution for the Period 2022 - 2032F
- Historical Data and Forecast of Croatia Decanter Market Revenues & Volume By Retail for the Period 2022 - 2032F
- Historical Data and Forecast of Croatia Decanter Market Revenues & Volume By Online for the Period 2022 - 2032F
- Croatia Decanter Import Export Trade Statistics
- Market Opportunity Assessment By Type
- Market Opportunity Assessment By Application
- Market Opportunity Assessment By End User
- Market Opportunity Assessment By Distribution
- Croatia Decanter Top Companies Market Share
- Croatia Decanter Competitive Benchmarking By Technical and Operational Parameters
- Croatia Decanter Company Profiles
- Croatia Decanter Key Strategic Recommendations
Frequently Asked Questions About the Market Study (FAQs):
6Wresearch actively monitors the Croatia Decanter Market and publishes its comprehensive annual report, highlighting emerging trends, growth drivers, revenue analysis, and forecast outlook. Our insights help businesses to make data-backed strategic decisions with ongoing market dynamics. Our analysts track relevent industries related to the Croatia Decanter Market, allowing our clients with actionable intelligence and reliable forecasts tailored to emerging regional needs.
Yes, we provide customisation as per your requirements. To learn more, feel free to contact us on sales@6wresearch.com
1 Executive Summary |
2 Introduction |
2.1 Key Highlights of the Report |
2.2 Report Description |
2.3 Market Scope & Segmentation |
2.4 Research Methodology |
2.5 Assumptions |
3 Croatia Decanter Market Overview |
3.1 Croatia Country Macro Economic Indicators |
3.2 Croatia Decanter Market Revenues & Volume, 2022 & 2032F |
3.3 Croatia Decanter Market - Industry Life Cycle |
3.4 Croatia Decanter Market - Porter's Five Forces |
3.5 Croatia Decanter Market Revenues & Volume Share, By Type, 2022 & 2032F |
3.6 Croatia Decanter Market Revenues & Volume Share, By Application, 2022 & 2032F |
3.7 Croatia Decanter Market Revenues & Volume Share, By End User, 2022 & 2032F |
3.8 Croatia Decanter Market Revenues & Volume Share, By Distribution, 2022 & 2032F |
4 Croatia Decanter Market Dynamics |
4.1 Impact Analysis |
4.2 Market Drivers |
4.3 Market Restraints |
5 Croatia Decanter Market Trends |
6 Croatia Decanter Market, By Types |
6.1 Croatia Decanter Market, By Type |
6.1.1 Overview and Analysis |
6.1.2 Croatia Decanter Market Revenues & Volume, By Type, 2022 - 2032F |
6.1.3 Croatia Decanter Market Revenues & Volume, By Glass, 2022 - 2032F |
6.1.4 Croatia Decanter Market Revenues & Volume, By Stainless, 2022 - 2032F |
6.1.5 Croatia Decanter Market Revenues & Volume, By Steel, 2022 - 2032F |
6.1.6 Croatia Decanter Market Revenues & Volume, By Plastic, 2022 - 2032F |
6.2 Croatia Decanter Market, By Application |
6.2.1 Overview and Analysis |
6.2.2 Croatia Decanter Market Revenues & Volume, By Wine, 2022 - 2032F |
6.2.3 Croatia Decanter Market Revenues & Volume, By Water, 2022 - 2032F |
6.2.4 Croatia Decanter Market Revenues & Volume, By Spirits, 2022 - 2032F |
6.3 Croatia Decanter Market, By End User |
6.3.1 Overview and Analysis |
6.3.2 Croatia Decanter Market Revenues & Volume, By Residential, 2022 - 2032F |
6.3.3 Croatia Decanter Market Revenues & Volume, By Commercial, 2022 - 2032F |
6.4 Croatia Decanter Market, By Distribution |
6.4.1 Overview and Analysis |
6.4.2 Croatia Decanter Market Revenues & Volume, By Retail, 2022 - 2032F |
6.4.3 Croatia Decanter Market Revenues & Volume, By Online, 2022 - 2032F |
7 Croatia Decanter Market Import-Export Trade Statistics |
7.1 Croatia Decanter Market Export to Major Countries |
7.2 Croatia Decanter Market Imports from Major Countries |
8 Croatia Decanter Market Key Performance Indicators |
9 Croatia Decanter Market - Opportunity Assessment |
9.1 Croatia Decanter Market Opportunity Assessment, By Type, 2022 & 2032F |
9.2 Croatia Decanter Market Opportunity Assessment, By Application, 2022 & 2032F |
9.3 Croatia Decanter Market Opportunity Assessment, By End User, 2022 & 2032F |
9.4 Croatia Decanter Market Opportunity Assessment, By Distribution, 2022 & 2032F |
10 Croatia Decanter Market - Competitive Landscape |
10.1 Croatia Decanter Market Revenue Share, By Companies, 2025 |
10.2 Croatia Decanter Market Competitive Benchmarking, By Operating and Technical Parameters |
11 Company Profiles |
12 Recommendations |
13 Disclaimer |
Global Go To Market Strategy - 2030
Export potential enables firms to identify high-growth global markets with greater confidence by combining advanced trade intelligence with a structured quantitative methodology. The framework analyzes emerging demand trends and country-level import patterns while integrating macroeconomic and trade datasets such as GDP and population forecasts, bilateral import–export flows, tariff structures, elasticity differentials between developed and developing economies, geographic distance, and import demand projections. Using weighted trade values from 2020–2024 as the base period to project country-to-country export potential for 2030, these inputs are operationalized through calculated drivers such as gravity model parameters, tariff impact factors, and projected GDP per-capita growth. Through an analysis of hidden potentials, demand hotspots, and market conditions that are most favorable to success, this method enables firms to focus on target countries, maximize returns, and global expansion with data, backed by accuracy.
By factoring in the projected importer demand gap that is currently unmet and could be potential opportunity, it identifies the potential for the Exporter (Country) among 190 countries, against the general trade analysis, which identifies the biggest importer or exporter.
To discover high-growth global markets and optimize your business strategy:
Click Here
Pricing
- Single User License$ 1,995
- Department License$ 2,400
- Site License$ 3,120
- Global License$ 3,795

Leadership Perspectives from Industry Events
Search
Thought Leadership and Analyst Meet


Our Clients
6WResearch In News
- India Air Conditioner Market Set for Strong Rebound in 2026 After Weather-Led Correction and GST-Driven Recovery: 6Wresearch
- ADAS in India: How Automatic Emergency Braking, Blind Spot Detection & Driver Monitoring are Transforming Road Safety
- Doha a strategic location for EV manufacturing hub: IPA Qatar
- Demand for luxury TVs surging in the GCC, says Samsung
- Empowering Growth: The Thriving Journey of Bangladesh’s Cable Industry
- Demand for luxury TVs surging in the GCC, says Samsung
Latest Reports
- Poland Fire Protection Systems Market (2026-2032)
- Cape Verde Portable Hand-Thrown Extinguisher Market (2026-2032)
- Canada Portable Hand-Thrown Extinguisher Market (2026-2032)
- Cameroon Portable Hand-Thrown Extinguisher Market (2026-2032)
- Burundi Portable Hand-Thrown Extinguisher Market (2026-2032)
- Burkina Faso Portable Hand-Thrown Extinguisher Market (2026-2032)
- Bulgaria Portable Hand-Thrown Extinguisher Market (2026-2032)
- Brunei Portable Hand-Thrown Extinguisher Market (2026-2032)
- Botswana Portable Hand-Thrown Extinguisher Market (2026-2032)
- Bosnia and Herzegovina Portable Hand-Thrown Extinguisher Market (2026-2032)
Industry Events and Analyst Meet

HIMTEX 2026

India Refining Summit 2026

India EV Show 2026

EV tech India Expo 2026

Auto Tech Asia 2026
Whitepaper
- Middle East & Africa Commercial Security Market Click here to view more.
- Middle East & Africa Fire Safety Systems & Equipment Market Click here to view more.
- GCC Drone Market Click here to view more.
- Middle East Lighting Fixture Market Click here to view more.
- GCC Physical & Perimeter Security Market Click here to view more.