Croatia Direct Drive Wind Turbine Market (2025-2031) | Companies, Forecast, Trends, Growth, Segmentation, Size & Revenue, Outlook, Analysis, Industry, Competitive Landscape, Value, Share
Market Forecast By Capacity (Less than 1MW, 1MW to 3MW, More than 3MW), By Technology (Electrically Excited Synchronous Generator, Permanent Magnet Synchronous Generator) And Competitive Landscape
| Product Code: ETC6849605 | Publication Date: Sep 2024 | Updated Date: Apr 2026 | Product Type: Market Research Report | |
| Publisher: 6Wresearch | Author: Sumit Sagar | No. of Pages: 75 | No. of Figures: 35 | No. of Tables: 20 |
Croatia Direct Drive Wind Turbine Market Size (2020-2030)
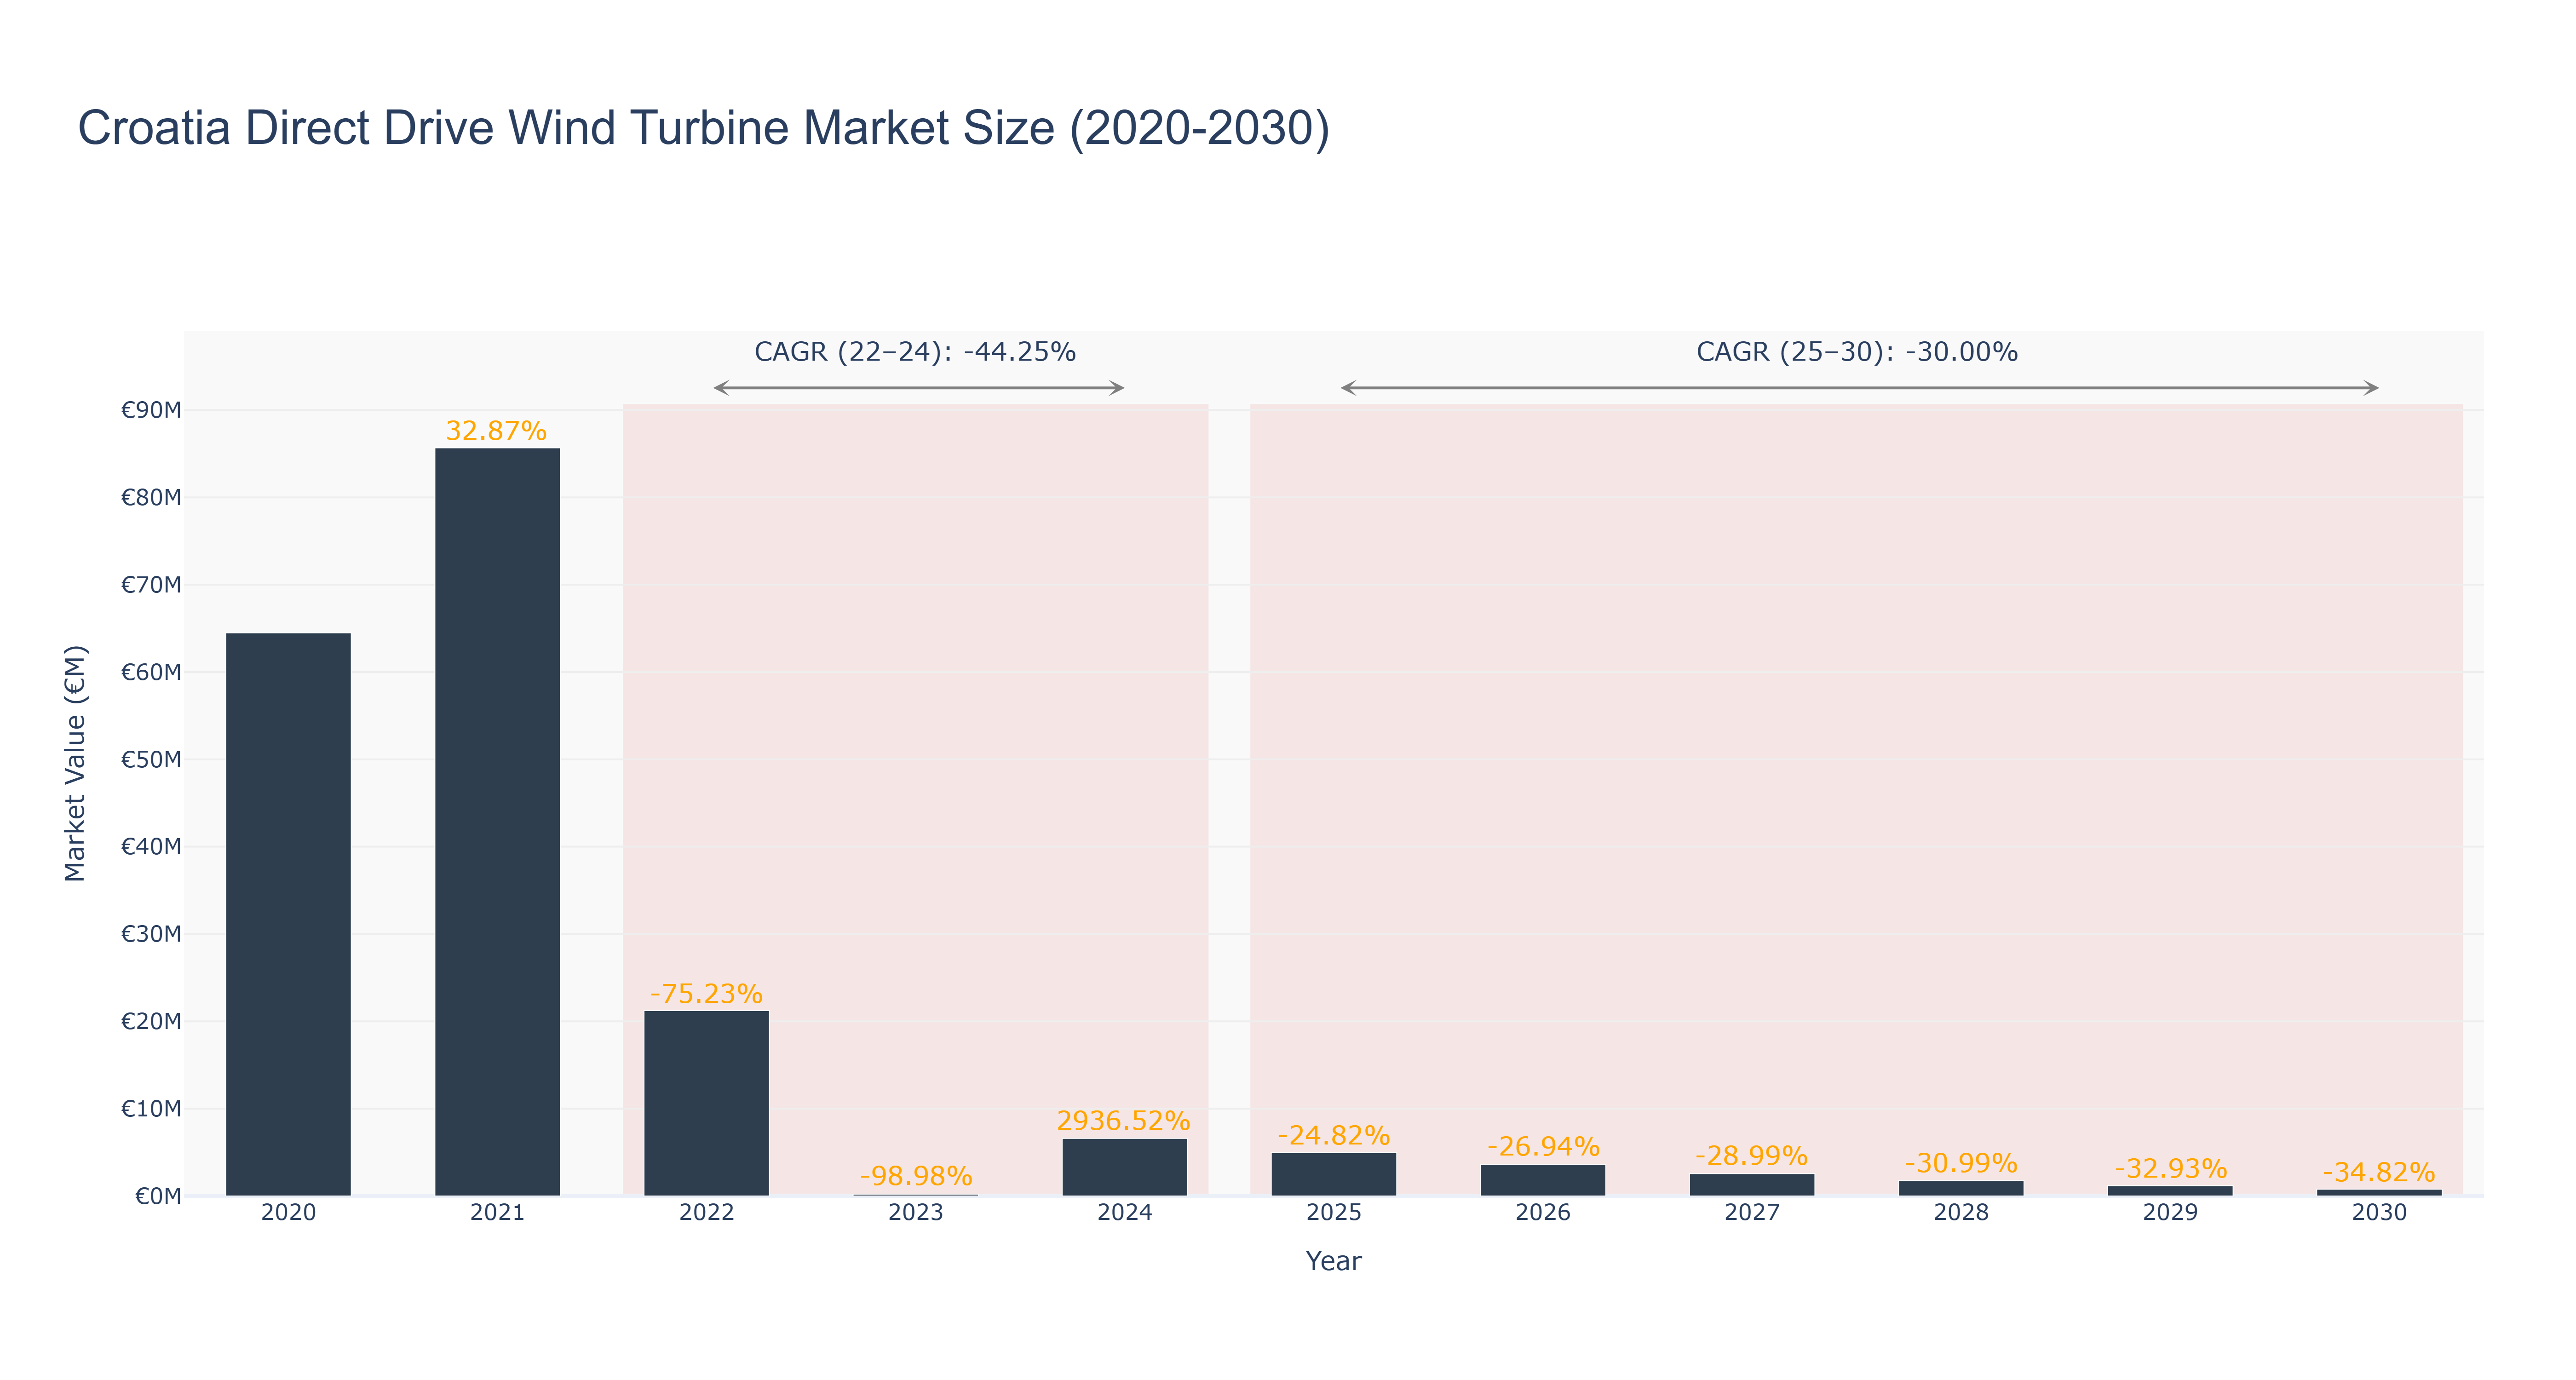
Croatia Direct Drive Wind Turbine Market has shown a significant decline in market size over the years. The peak market size was €64.48 million in 2020, followed by a sharp decrease to €21.22 million in 2022. The market continued to shrink to €0.22 million in 2023 before experiencing a sudden spike to €6.60 million in 2024. The forecasted trend indicates a further decrease in market size, with an expected size of €0.78 million in 2030. The CAGR for the period 2022-24 was -44.25%, while for 2025-30, it is projected at -30.0%. The downfall in market size can be attributed to regulatory uncertainties, changing government policies, and economic challenges. Looking ahead, Croatia is set to invest in renewable energy projects, including the expansion of wind energy infrastructure and collaboration with international partners to enhance the country's green energy capabilities.
Croatia Direct Drive Wind Turbine Market: Production & Trade Performance (2019-2025)
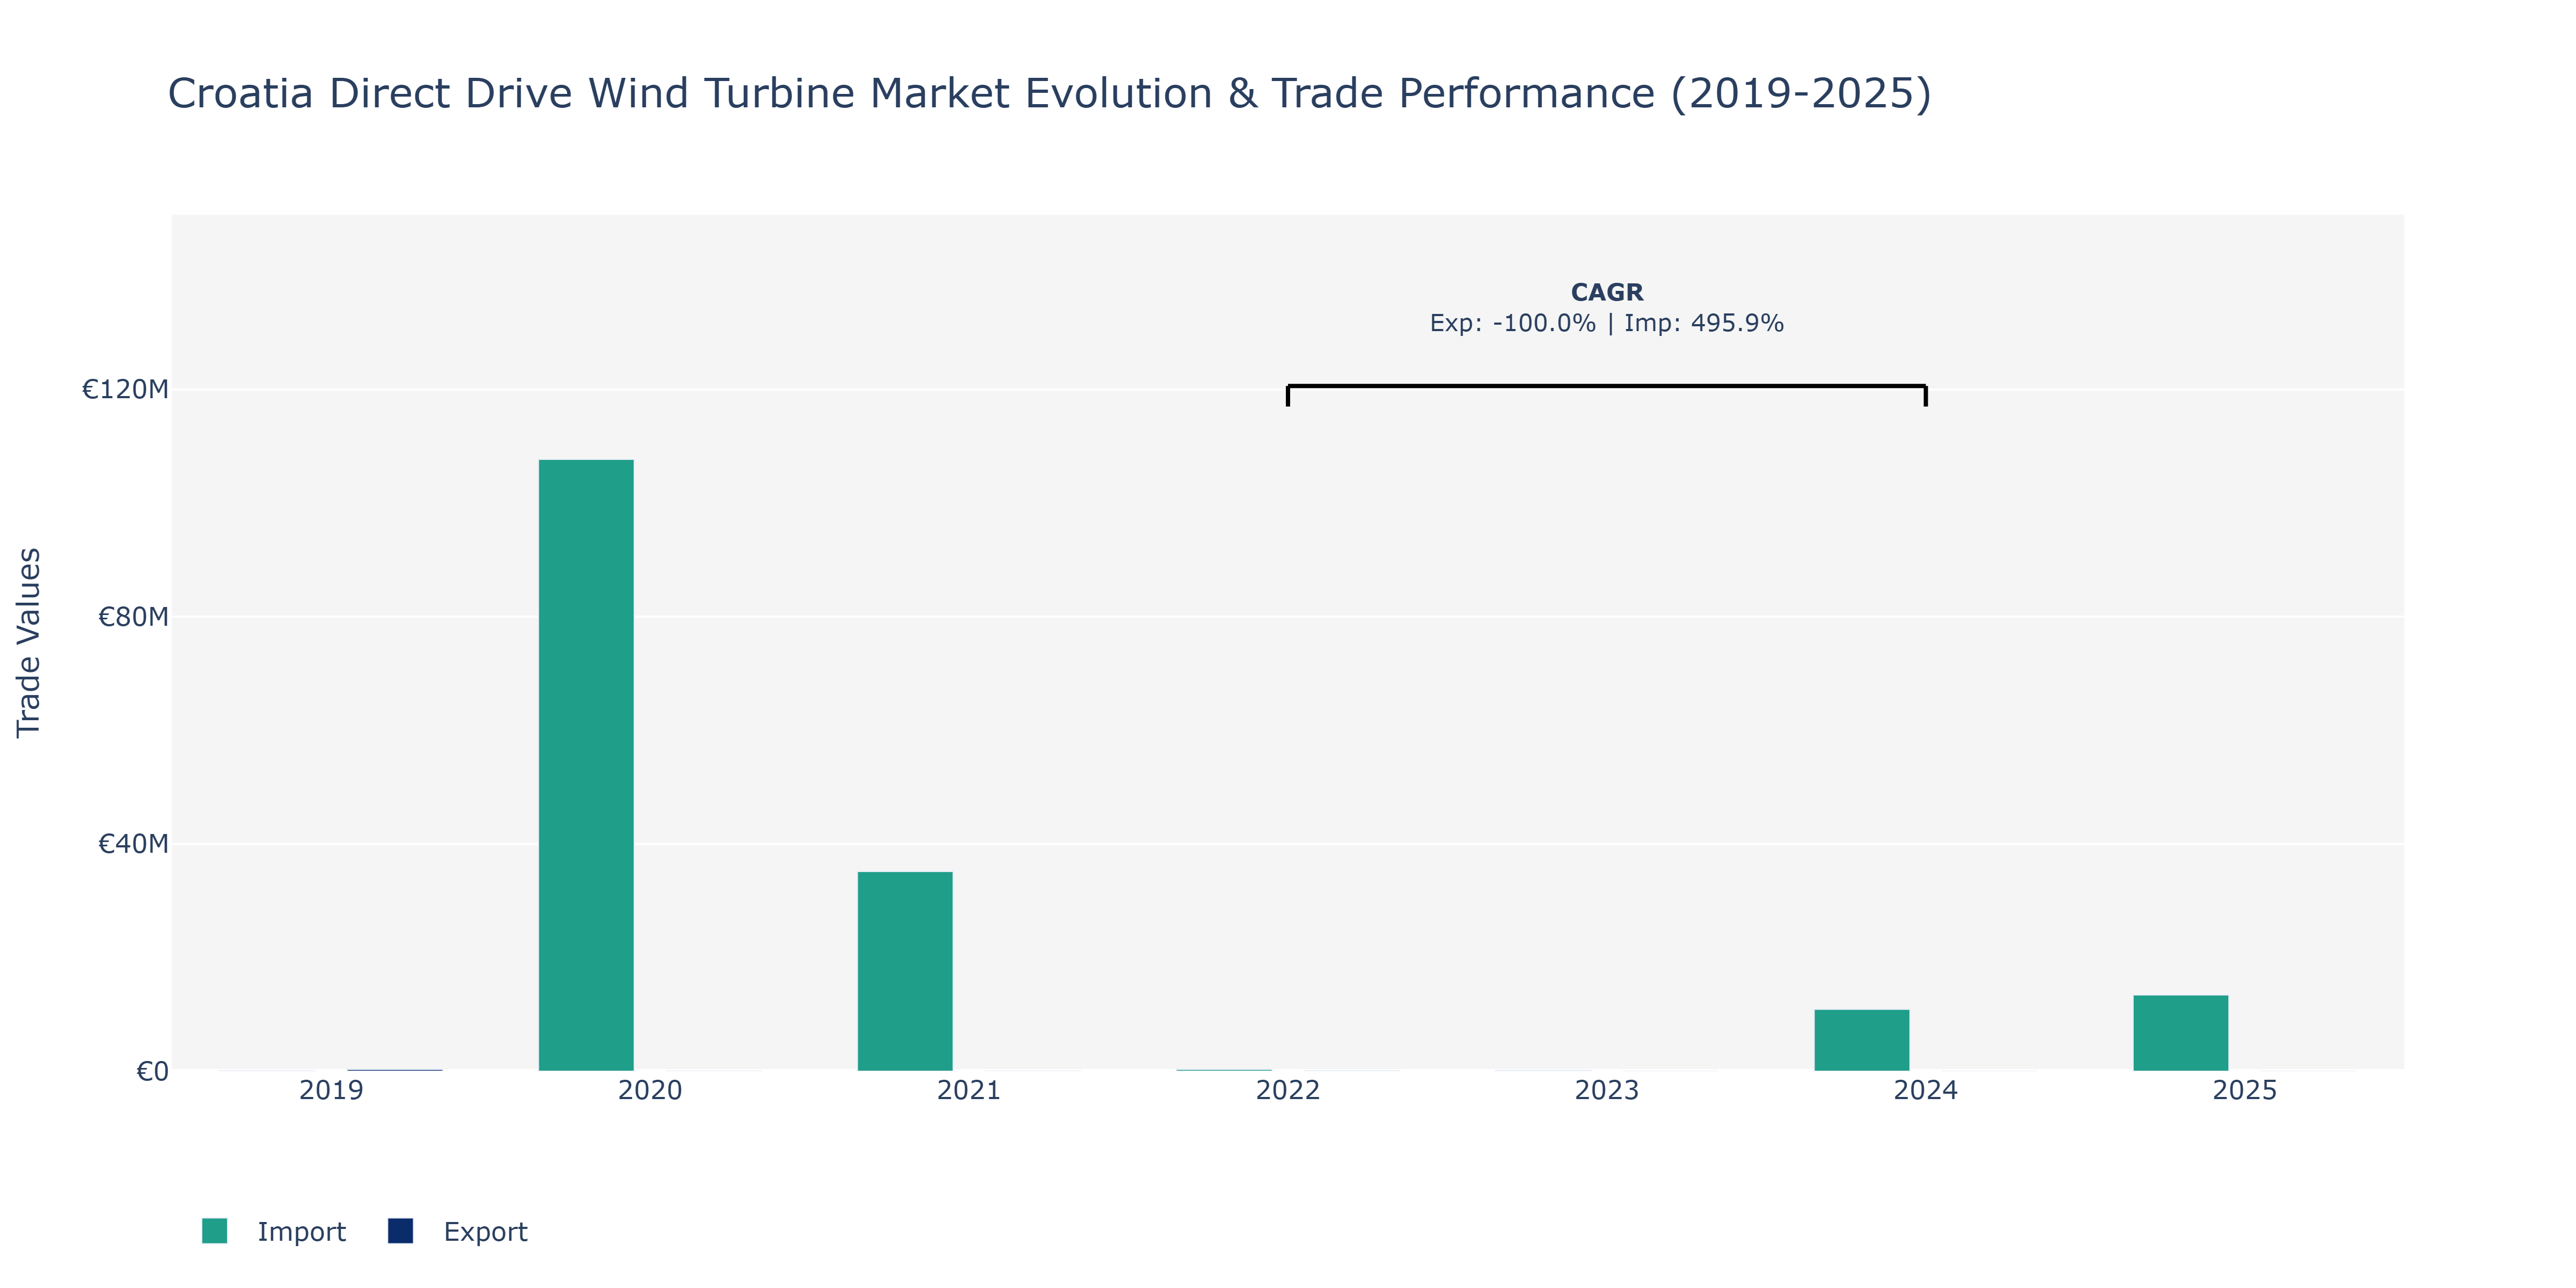
Between 2019 and 2025, Croatia's Direct Drive Wind Turbine Market witnessed notable fluctuations in Exports and Imports. In 2019, Exports were at €301.76 thousand, experiencing a substantial decline to €19.21 thousand in 2020, followed by a recovery to €66.15 thousand in 2022. This recovery trend indicates potential market stabilization. Imports, on the other hand, surged from €50.24 thousand in 2019 to €108.83 million in 2024, marking a significant peak. The spike in Imports could be attributed to Croatia's efforts to enhance its renewable energy infrastructure by importing Direct Drive Wind Turbines. The year 2021 saw a notable increase in both Exports and Imports, possibly indicating growing market demand and expansion opportunities in the renewable energy sector. The surge in Imports in 2020 and subsequent years suggests Croatia's commitment to transitioning towards sustainable energy sources, aligning with global environmental initiatives and regulations.
Key Highlights of the Report:
- Croatia Direct Drive Wind Turbine Market Outlook
- Market Size of Croatia Direct Drive Wind Turbine Market, 2024
- Forecast of Croatia Direct Drive Wind Turbine Market, 2031
- Historical Data and Forecast of Croatia Direct Drive Wind Turbine Revenues & Volume for the Period 2021- 2031
- Croatia Direct Drive Wind Turbine Market Trend Evolution
- Croatia Direct Drive Wind Turbine Market Drivers and Challenges
- Croatia Direct Drive Wind Turbine Price Trends
- Croatia Direct Drive Wind Turbine Porter's Five Forces
- Croatia Direct Drive Wind Turbine Industry Life Cycle
- Historical Data and Forecast of Croatia Direct Drive Wind Turbine Market Revenues & Volume By Capacity for the Period 2021- 2031
- Historical Data and Forecast of Croatia Direct Drive Wind Turbine Market Revenues & Volume By Less than 1MW for the Period 2021- 2031
- Historical Data and Forecast of Croatia Direct Drive Wind Turbine Market Revenues & Volume By 1MW to 3MW for the Period 2021- 2031
- Historical Data and Forecast of Croatia Direct Drive Wind Turbine Market Revenues & Volume By More than 3MW for the Period 2021- 2031
- Historical Data and Forecast of Croatia Direct Drive Wind Turbine Market Revenues & Volume By Technology for the Period 2021- 2031
- Historical Data and Forecast of Croatia Direct Drive Wind Turbine Market Revenues & Volume By Electrically Excited Synchronous Generator for the Period 2021- 2031
- Historical Data and Forecast of Croatia Direct Drive Wind Turbine Market Revenues & Volume By Permanent Magnet Synchronous Generator for the Period 2021- 2031
- Croatia Direct Drive Wind Turbine Import Export Trade Statistics
- Market Opportunity Assessment By Capacity
- Market Opportunity Assessment By Technology
- Croatia Direct Drive Wind Turbine Top Companies Market Share
- Croatia Direct Drive Wind Turbine Competitive Benchmarking By Technical and Operational Parameters
- Croatia Direct Drive Wind Turbine Company Profiles
- Croatia Direct Drive Wind Turbine Key Strategic Recommendations
Frequently Asked Questions About the Market Study (FAQs):
6Wresearch actively monitors the Croatia Direct Drive Wind Turbine Market and publishes its comprehensive annual report, highlighting emerging trends, growth drivers, revenue analysis, and forecast outlook. Our insights help businesses to make data-backed strategic decisions with ongoing market dynamics. Our analysts track relevent industries related to the Croatia Direct Drive Wind Turbine Market, allowing our clients with actionable intelligence and reliable forecasts tailored to emerging regional needs.
Yes, we provide customisation as per your requirements. To learn more, feel free to contact us on sales@6wresearch.com
1 Executive Summary |
2 Introduction |
2.1 Key Highlights of the Report |
2.2 Report Description |
2.3 Market Scope & Segmentation |
2.4 Research Methodology |
2.5 Assumptions |
3 Croatia Direct Drive Wind Turbine Market Overview |
3.1 Croatia Country Macro Economic Indicators |
3.2 Croatia Direct Drive Wind Turbine Market Revenues & Volume, 2021 & 2031F |
3.3 Croatia Direct Drive Wind Turbine Market - Industry Life Cycle |
3.4 Croatia Direct Drive Wind Turbine Market - Porter's Five Forces |
3.5 Croatia Direct Drive Wind Turbine Market Revenues & Volume Share, By Capacity, 2021 & 2031F |
3.6 Croatia Direct Drive Wind Turbine Market Revenues & Volume Share, By Technology, 2021 & 2031F |
4 Croatia Direct Drive Wind Turbine Market Dynamics |
4.1 Impact Analysis |
4.2 Market Drivers |
4.2.1 Increasing focus on renewable energy sources in Croatia |
4.2.2 Government support and incentives for wind energy projects |
4.2.3 Technological advancements in direct drive wind turbines |
4.3 Market Restraints |
4.3.1 High initial investment costs for direct drive wind turbines |
4.3.2 Limited land availability for wind farm development in Croatia |
4.3.3 Regulatory challenges and permitting processes for wind energy projects |
5 Croatia Direct Drive Wind Turbine Market Trends |
6 Croatia Direct Drive Wind Turbine Market, By Types |
6.1 Croatia Direct Drive Wind Turbine Market, By Capacity |
6.1.1 Overview and Analysis |
6.1.2 Croatia Direct Drive Wind Turbine Market Revenues & Volume, By Capacity, 2021- 2031F |
6.1.3 Croatia Direct Drive Wind Turbine Market Revenues & Volume, By Less than 1MW, 2021- 2031F |
6.1.4 Croatia Direct Drive Wind Turbine Market Revenues & Volume, By 1MW to 3MW, 2021- 2031F |
6.1.5 Croatia Direct Drive Wind Turbine Market Revenues & Volume, By More than 3MW, 2021- 2031F |
6.2 Croatia Direct Drive Wind Turbine Market, By Technology |
6.2.1 Overview and Analysis |
6.2.2 Croatia Direct Drive Wind Turbine Market Revenues & Volume, By Electrically Excited Synchronous Generator, 2021- 2031F |
6.2.3 Croatia Direct Drive Wind Turbine Market Revenues & Volume, By Permanent Magnet Synchronous Generator, 2021- 2031F |
7 Croatia Direct Drive Wind Turbine Market Import-Export Trade Statistics |
7.1 Croatia Direct Drive Wind Turbine Market Export to Major Countries |
7.2 Croatia Direct Drive Wind Turbine Market Imports from Major Countries |
8 Croatia Direct Drive Wind Turbine Market Key Performance Indicators |
8.1 Average capacity factor of direct drive wind turbines in Croatia |
8.2 Number of new wind energy projects approved by regulatory authorities |
8.3 Levelized cost of electricity (LCOE) for direct drive wind turbines in Croatia |
9 Croatia Direct Drive Wind Turbine Market - Opportunity Assessment |
9.1 Croatia Direct Drive Wind Turbine Market Opportunity Assessment, By Capacity, 2021 & 2031F |
9.2 Croatia Direct Drive Wind Turbine Market Opportunity Assessment, By Technology, 2021 & 2031F |
10 Croatia Direct Drive Wind Turbine Market - Competitive Landscape |
10.1 Croatia Direct Drive Wind Turbine Market Revenue Share, By Companies, 2024 |
10.2 Croatia Direct Drive Wind Turbine Market Competitive Benchmarking, By Operating and Technical Parameters |
11 Company Profiles |
12 Recommendations |
13 Disclaimer |
Export potential assessment - trade Analytics for 2030
Export potential enables firms to identify high-growth global markets with greater confidence by combining advanced trade intelligence with a structured quantitative methodology. The framework analyzes emerging demand trends and country-level import patterns while integrating macroeconomic and trade datasets such as GDP and population forecasts, bilateral import–export flows, tariff structures, elasticity differentials between developed and developing economies, geographic distance, and import demand projections. Using weighted trade values from 2020–2024 as the base period to project country-to-country export potential for 2030, these inputs are operationalized through calculated drivers such as gravity model parameters, tariff impact factors, and projected GDP per-capita growth. Through an analysis of hidden potentials, demand hotspots, and market conditions that are most favorable to success, this method enables firms to focus on target countries, maximize returns, and global expansion with data, backed by accuracy.
By factoring in the projected importer demand gap that is currently unmet and could be potential opportunity, it identifies the potential for the Exporter (Country) among 190 countries, against the general trade analysis, which identifies the biggest importer or exporter.
To discover high-growth global markets and optimize your business strategy:
Click Here
Pricing
- Single User License$ 1,995
- Department License$ 2,400
- Site License$ 3,120
- Global License$ 3,795

Search
Thought Leadership and Analyst Meet


Our Clients
Latest Reports
- France Thermally Conductive Filler Dispersants Market (2026-2032) | Challenges, Restraints, Value, Share, Size, segmentation, Analysis, Trends, Investment Opportunities, Outlook, Pricing, Demand, Forecast, Revenue, Companies, Growth, Drivers, Strategy, Insights, Competition
- Egypt Thermally Conductive Filler Dispersants Market (2026-2032) | Competition, Forecast, Strategy, Value, Insights, Outlook, Investment Opportunities, Pricing, Demand, Share, segmentation, Drivers, Size, Companies, Restraints, Growth, Trends, Revenue, Challenges, Analysis
- Czech Republic Thermally Conductive Filler Dispersants Market (2026-2032) | Forecast, Pricing, Analysis, Drivers, Insights, Size, Demand, Growth, Challenges, segmentation, Competition, Outlook, Trends, Investment Opportunities, Companies, Strategy, Revenue, Share, Value, Restraints
- Colombia Thermally Conductive Filler Dispersants Market (2026-2032) | segmentation, Trends, Share, Drivers, Strategy, Companies, Demand, Insights, Size, Challenges, Value, Competition, Analysis, Growth, Revenue, Restraints, Forecast, Pricing, Outlook, Investment Opportunities
- China Thermally Conductive Filler Dispersants Market (2026-2032) | Restraints, Investment Opportunities, Pricing, Companies, Share, Size, Challenges, Trends, Outlook, Value, Analysis, Competition, Revenue, Drivers, Forecast, Demand, Insights, Growth, Strategy, segmentation
- Chile Thermally Conductive Filler Dispersants Market (2026-2032) | Investment Opportunities, Trends, Value, Restraints, Share, Companies, Forecast, segmentation, Pricing, Challenges, Demand, Size, Analysis, Drivers, Outlook, Growth, Competition, Strategy, Revenue, Insights
- Cambodia Thermally Conductive Filler Dispersants Market (2026-2032) | Analysis, Share, Outlook, Strategy, Pricing, Demand, Size, Growth, segmentation, Insights, Revenue, Forecast, Challenges, Competition, Companies, Investment Opportunities, Trends, Restraints, Value, Drivers
- Brazil Thermally Conductive Filler Dispersants Market (2026-2032) | Restraints, Forecast, Competition, Size, Revenue, Value, Investment Opportunities, Trends, Insights, Outlook, Growth, Analysis, Drivers, segmentation, Pricing, Challenges, Strategy, Share, Companies, Demand
- Bangladesh Thermally Conductive Filler Dispersants Market (2026-2032) | Restraints, Trends, Analysis, Competition, Insights, Forecast, Value, Investment Opportunities, Pricing, Share, Demand, Outlook, Revenue, segmentation, Companies, Drivers, Growth, Size, Challenges, Strategy
- Bahrain Thermally Conductive Filler Dispersants Market (2026-2032) | Trends, Outlook, Pricing, Demand, Value, Competition, Forecast, Growth, segmentation, Revenue, Companies, Analysis, Insights, Size, Drivers, Challenges, Strategy, Investment Opportunities, Share, Restraints
Industry Events and Analyst Meet

HIMTEX 2026

India Refining Summit 2026

India EV Show 2026

EV tech India Expo 2026

Auto Tech Asia 2026
Whitepaper
- Middle East & Africa Commercial Security Market Click here to view more.
- Middle East & Africa Fire Safety Systems & Equipment Market Click here to view more.
- GCC Drone Market Click here to view more.
- Middle East Lighting Fixture Market Click here to view more.
- GCC Physical & Perimeter Security Market Click here to view more.
6WResearch In News
- Doha a strategic location for EV manufacturing hub: IPA Qatar
- Demand for luxury TVs surging in the GCC, says Samsung
- Empowering Growth: The Thriving Journey of Bangladesh’s Cable Industry
- Demand for luxury TVs surging in the GCC, says Samsung
- Video call with a traditional healer? Once unthinkable, it’s now common in South Africa
- Intelligent Buildings To Smooth GCC’s Path To Net Zero