Croatia Epichlorohydrin (ECH) Market (2025-2031) | Companies, Analysis, Value, Growth, Size, Outlook, Segmentation, Revenue, Industry, Share, Trends & Forecast
Market Forecast By Applications (Epoxy Resins, Synthetic Glycerin, Water Treatment Chemicals, Pharmaceuticals), By End Use (Paints & Applications, Electrical & Electronics, Construction, Wind Turbine, Composites, Adhesives, Others) And Competitive Landscape
| Product Code: ETC5690275 | Publication Date: Nov 2023 | Updated Date: Apr 2026 | Product Type: Market Research Report | |
| Publisher: 6Wresearch | Author: Ravi Bhandari | No. of Pages: 60 | No. of Figures: 30 | No. of Tables: 5 |
Croatia Epichlorohydrin (Ech) Market Size (2020-2030)
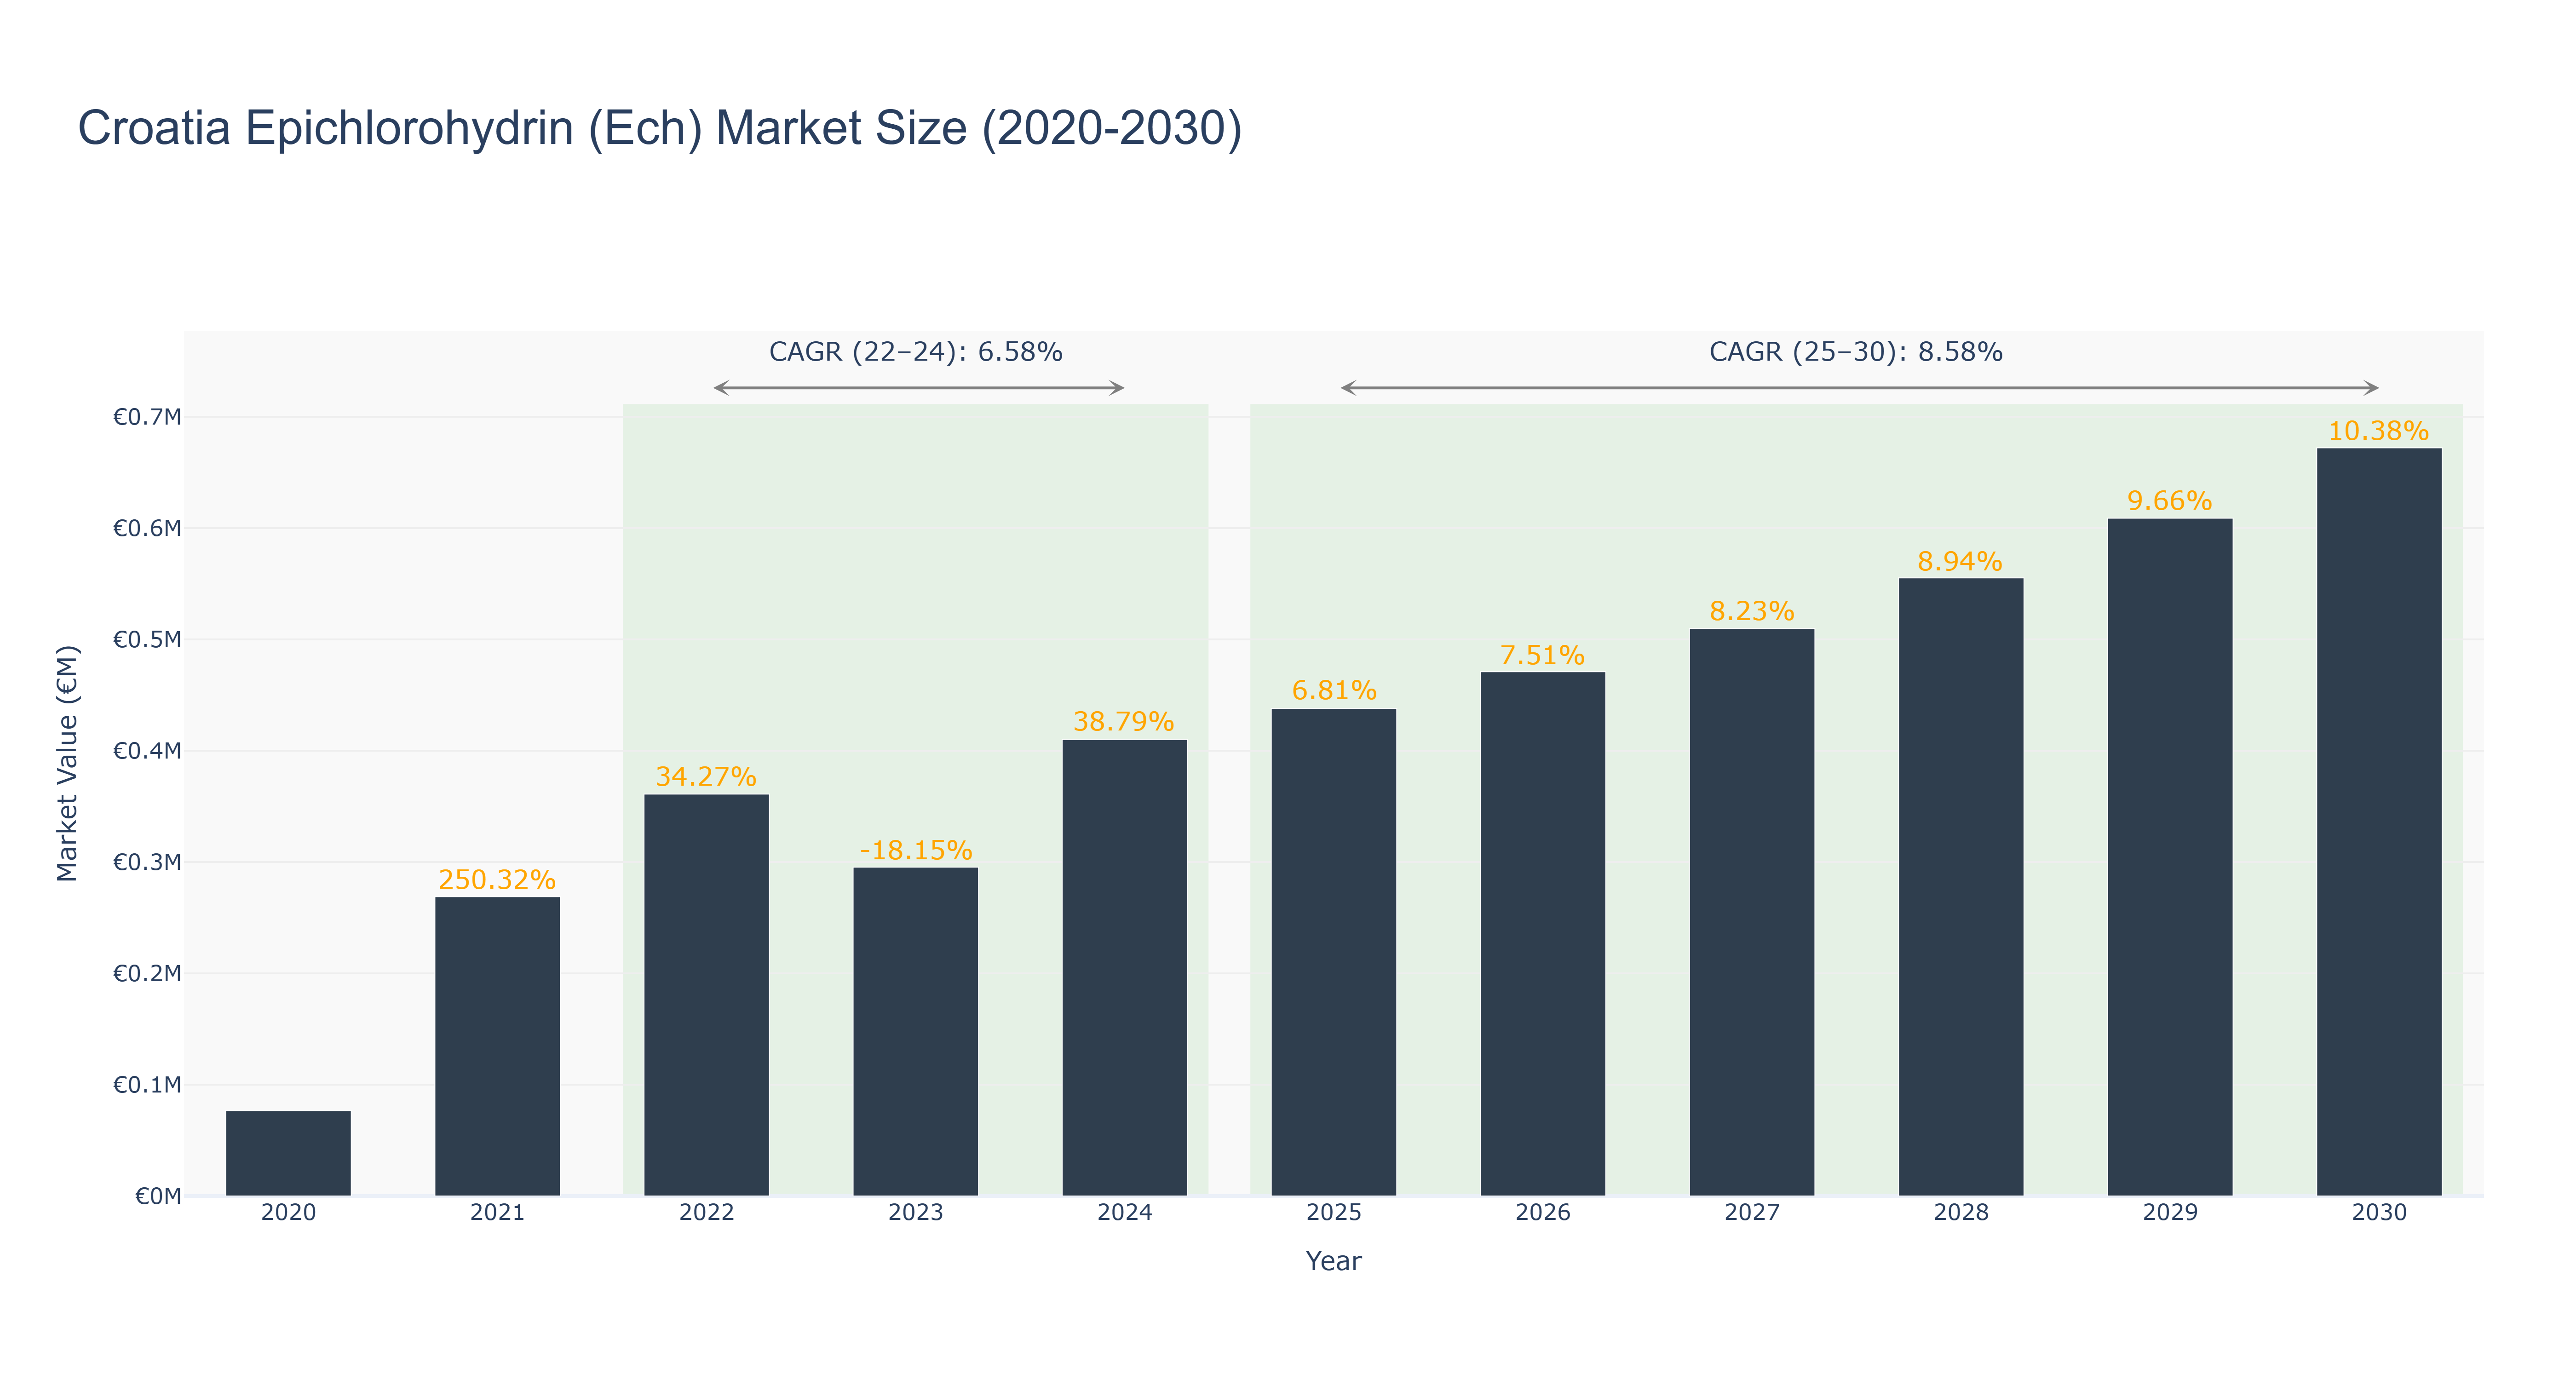
Croatia's Epichlorohydrin (Ech) Market has shown a steady growth trajectory over the years. The market peaked at €0.67 million in 2030 with a consistent upward trend in market size. From 2020 to 2024, the market witnessed an impressive growth, reaching €0.41 million in 2024. However, a slight dip was observed in 2023 due to external economic factors. Looking ahead, the market is forecasted to continue its growth momentum from 2025 to 2030, with a CAGR of 8.58%. This growth can be attributed to increasing demand from various industries and ongoing technological advancements in the sector. Recent developments in Croatia's Ech market include plans for enhanced production facilities to meet the rising demand for Epichlorohydrin in the region, indicating a promising future for the market.
Croatia Epichlorohydrin (Ech) Market: Production & Trade Performance (2019-2025)
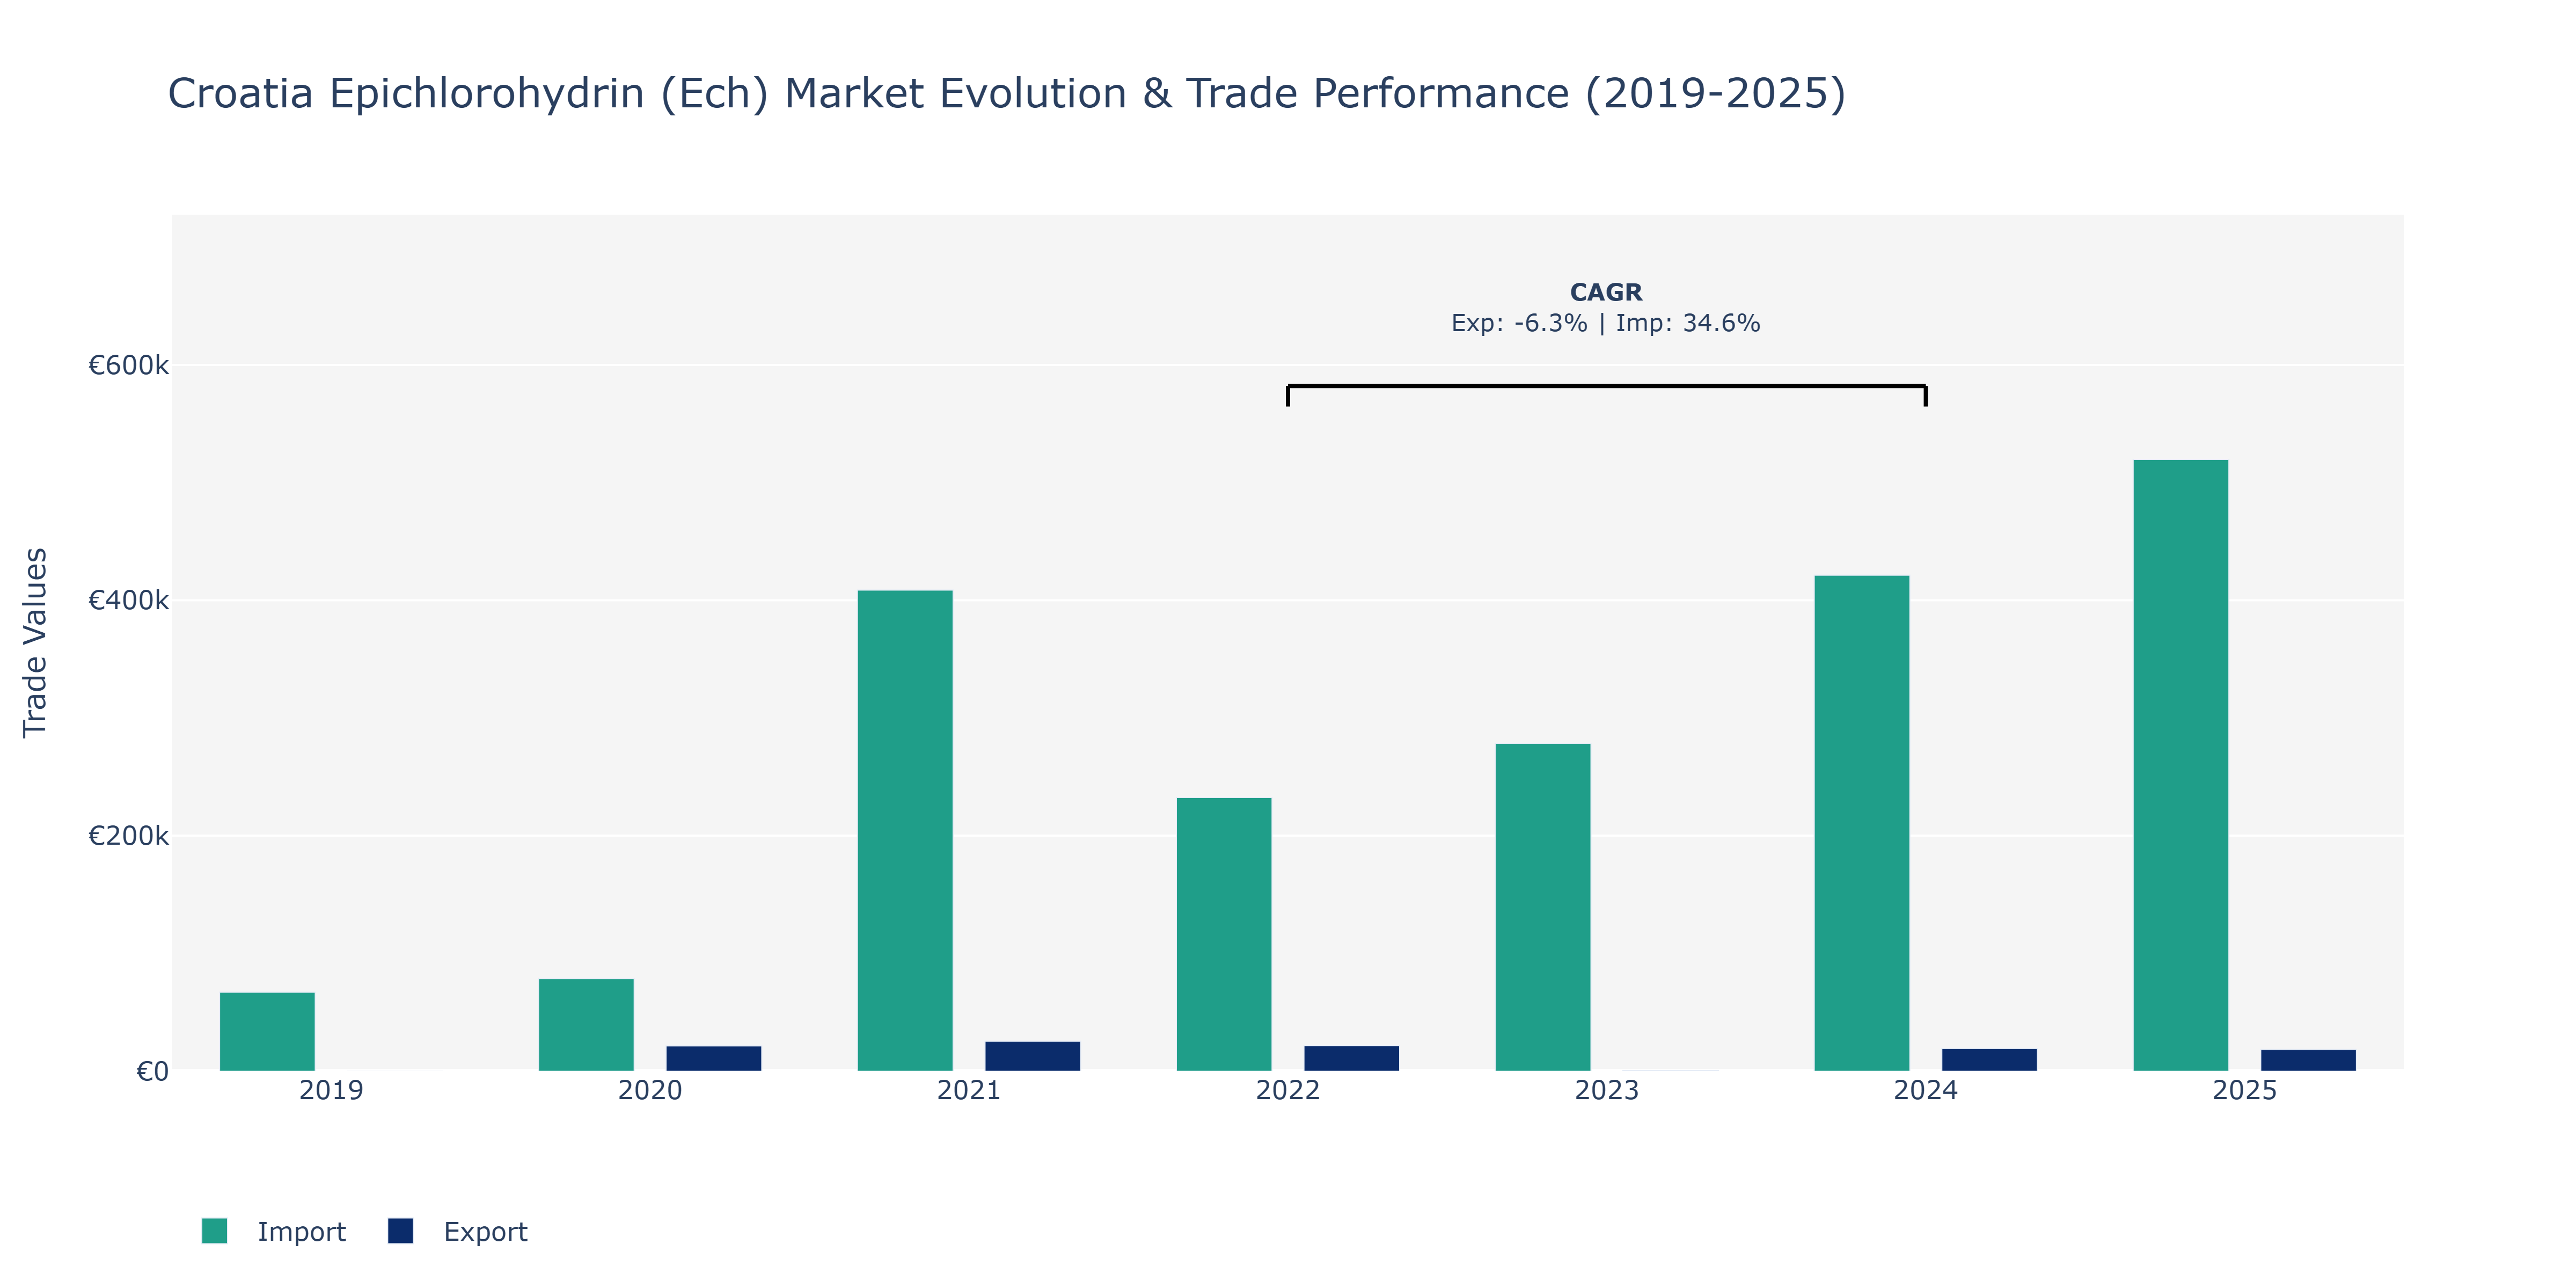
The Croatia Epichlorohydrin (Ech) Market exhibited varying trends in Exports and Imports over the analyzed years. Exports saw fluctuations, starting at €21.54 thousand in 2020, peaking at €42.13 thousand in 2024, and then decreasing slightly to €18.45 thousand in 2025. Conversely, Imports demonstrated a consistent upward trajectory, increasing from €78.73 thousand in 2020 to €519.71 thousand in 2025. The substantial spike in Imports in 2021, amounting to €408.71 thousand, could be attributed to increased demand for raw materials or machinery related to Ech production. The overall growth in Imports aligns with Croatia's industrial sector development, potentially reflecting the country's expanding manufacturing capabilities or its role as a regional trade hub. However, the decline in Exports in 2025 may signal intensified competition in the global Ech market, necessitating strategic marketing initiatives or product diversification to enhance export competitiveness.
Key Highlights of the Report:
- Croatia Epichlorohydrin (ECH) Market Outlook
- Market Size of Croatia Epichlorohydrin (ECH) Market, 2024
- Forecast of Croatia Epichlorohydrin (ECH) Market, 2031
- Historical Data and Forecast of Croatia Epichlorohydrin (ECH) Revenues & Volume for the Period 2021-2031
- Croatia Epichlorohydrin (ECH) Market Trend Evolution
- Croatia Epichlorohydrin (ECH) Market Drivers and Challenges
- Croatia Epichlorohydrin (ECH) Price Trends
- Croatia Epichlorohydrin (ECH) Porter`s Five Forces
- Croatia Epichlorohydrin (ECH) Industry Life Cycle
- Historical Data and Forecast of Croatia Epichlorohydrin (ECH) Market Revenues & Volume By Applications for the Period 2021-2031
- Historical Data and Forecast of Croatia Epichlorohydrin (ECH) Market Revenues & Volume By Epoxy Resins for the Period 2021-2031
- Historical Data and Forecast of Croatia Epichlorohydrin (ECH) Market Revenues & Volume By Synthetic Glycerin for the Period 2021-2031
- Historical Data and Forecast of Croatia Epichlorohydrin (ECH) Market Revenues & Volume By Water Treatment Chemicals for the Period 2021-2031
- Historical Data and Forecast of Croatia Epichlorohydrin (ECH) Market Revenues & Volume By Pharmaceuticals for the Period 2021-2031
- Historical Data and Forecast of Croatia Epichlorohydrin (ECH) Market Revenues & Volume By End Use for the Period 2021-2031
- Historical Data and Forecast of Croatia Epichlorohydrin (ECH) Market Revenues & Volume By Paints & Applications for the Period 2021-2031
- Historical Data and Forecast of Croatia Epichlorohydrin (ECH) Market Revenues & Volume By Electrical & Electronics for the Period 2021-2031
- Historical Data and Forecast of Croatia Epichlorohydrin (ECH) Market Revenues & Volume By Construction for the Period 2021-2031
- Historical Data and Forecast of Croatia Epichlorohydrin (ECH) Market Revenues & Volume By Wind Turbine for the Period 2021-2031
- Historical Data and Forecast of Croatia Epichlorohydrin (ECH) Market Revenues & Volume By Composites for the Period 2021-2031
- Historical Data and Forecast of Croatia Epichlorohydrin (ECH) Market Revenues & Volume By Adhesives for the Period 2021-2031
- Historical Data and Forecast of Croatia Epichlorohydrin (ECH) Market Revenues & Volume By Others for the Period 2021-2031
- Croatia Epichlorohydrin (ECH) Import Export Trade Statistics
- Market Opportunity Assessment By Applications
- Market Opportunity Assessment By End Use
- Croatia Epichlorohydrin (ECH) Top Companies Market Share
- Croatia Epichlorohydrin (ECH) Competitive Benchmarking By Technical and Operational Parameters
- Croatia Epichlorohydrin (ECH) Company Profiles
- Croatia Epichlorohydrin (ECH) Key Strategic Recommendations
Frequently Asked Questions About the Market Study (FAQs):
6Wresearch actively monitors the Croatia Epichlorohydrin (ECH) Market and publishes its comprehensive annual report, highlighting emerging trends, growth drivers, revenue analysis, and forecast outlook. Our insights help businesses to make data-backed strategic decisions with ongoing market dynamics. Our analysts track relevent industries related to the Croatia Epichlorohydrin (ECH) Market, allowing our clients with actionable intelligence and reliable forecasts tailored to emerging regional needs.
Yes, we provide customisation as per your requirements. To learn more, feel free to contact us on sales@6wresearch.com
1 Executive Summary |
2 Introduction |
2.1 Key Highlights of the Report |
2.2 Report Description |
2.3 Market Scope & Segmentation |
2.4 Research Methodology |
2.5 Assumptions |
3 Croatia Epichlorohydrin (ECH) Market Overview |
3.1 Croatia Country Macro Economic Indicators |
3.2 Croatia Epichlorohydrin (ECH) Market Revenues & Volume, 2021 & 2031F |
3.3 Croatia Epichlorohydrin (ECH) Market - Industry Life Cycle |
3.4 Croatia Epichlorohydrin (ECH) Market - Porter's Five Forces |
3.5 Croatia Epichlorohydrin (ECH) Market Revenues & Volume Share, By Applications, 2021 & 2031F |
3.6 Croatia Epichlorohydrin (ECH) Market Revenues & Volume Share, By End Use, 2021 & 2031F |
4 Croatia Epichlorohydrin (ECH) Market Dynamics |
4.1 Impact Analysis |
4.2 Market Drivers |
4.2.1 Growth in end-use industries such as automotive, electronics, and construction |
4.2.2 Increasing demand for epoxy resins, which are derived from epichlorohydrin |
4.2.3 Technological advancements leading to improved production efficiency and product quality |
4.3 Market Restraints |
4.3.1 Fluctuating raw material prices, such as propylene and chlorine |
4.3.2 Stringent environmental regulations impacting production processes and costs |
4.3.3 Intense competition from alternative products in the market |
5 Croatia Epichlorohydrin (ECH) Market Trends |
6 Croatia Epichlorohydrin (ECH) Market Segmentations |
6.1 Croatia Epichlorohydrin (ECH) Market, By Applications |
6.1.1 Overview and Analysis |
6.1.2 Croatia Epichlorohydrin (ECH) Market Revenues & Volume, By Epoxy Resins, 2021-2031F |
6.1.3 Croatia Epichlorohydrin (ECH) Market Revenues & Volume, By Synthetic Glycerin, 2021-2031F |
6.1.4 Croatia Epichlorohydrin (ECH) Market Revenues & Volume, By Water Treatment Chemicals, 2021-2031F |
6.1.5 Croatia Epichlorohydrin (ECH) Market Revenues & Volume, By Pharmaceuticals, 2021-2031F |
6.2 Croatia Epichlorohydrin (ECH) Market, By End Use |
6.2.1 Overview and Analysis |
6.2.2 Croatia Epichlorohydrin (ECH) Market Revenues & Volume, By Paints & Applications, 2021-2031F |
6.2.3 Croatia Epichlorohydrin (ECH) Market Revenues & Volume, By Electrical & Electronics, 2021-2031F |
6.2.4 Croatia Epichlorohydrin (ECH) Market Revenues & Volume, By Construction, 2021-2031F |
6.2.5 Croatia Epichlorohydrin (ECH) Market Revenues & Volume, By Wind Turbine, 2021-2031F |
6.2.6 Croatia Epichlorohydrin (ECH) Market Revenues & Volume, By Composites, 2021-2031F |
6.2.7 Croatia Epichlorohydrin (ECH) Market Revenues & Volume, By Adhesives, 2021-2031F |
7 Croatia Epichlorohydrin (ECH) Market Import-Export Trade Statistics |
7.1 Croatia Epichlorohydrin (ECH) Market Export to Major Countries |
7.2 Croatia Epichlorohydrin (ECH) Market Imports from Major Countries |
8 Croatia Epichlorohydrin (ECH) Market Key Performance Indicators |
8.1 Average selling price of epichlorohydrin in Croatia |
8.2 Research and development investment in new epichlorohydrin applications |
8.3 Percentage of capacity utilization in epichlorohydrin manufacturing plants |
9 Croatia Epichlorohydrin (ECH) Market - Opportunity Assessment |
9.1 Croatia Epichlorohydrin (ECH) Market Opportunity Assessment, By Applications, 2021 & 2031F |
9.2 Croatia Epichlorohydrin (ECH) Market Opportunity Assessment, By End Use, 2021 & 2031F |
10 Croatia Epichlorohydrin (ECH) Market - Competitive Landscape |
10.1 Croatia Epichlorohydrin (ECH) Market Revenue Share, By Companies, 2024 |
10.2 Croatia Epichlorohydrin (ECH) Market Competitive Benchmarking, By Operating and Technical Parameters |
11 Company Profiles |
12 Recommendations | 13 Disclaimer |
Export potential assessment - trade Analytics for 2030
Export potential enables firms to identify high-growth global markets with greater confidence by combining advanced trade intelligence with a structured quantitative methodology. The framework analyzes emerging demand trends and country-level import patterns while integrating macroeconomic and trade datasets such as GDP and population forecasts, bilateral import–export flows, tariff structures, elasticity differentials between developed and developing economies, geographic distance, and import demand projections. Using weighted trade values from 2020–2024 as the base period to project country-to-country export potential for 2030, these inputs are operationalized through calculated drivers such as gravity model parameters, tariff impact factors, and projected GDP per-capita growth. Through an analysis of hidden potentials, demand hotspots, and market conditions that are most favorable to success, this method enables firms to focus on target countries, maximize returns, and global expansion with data, backed by accuracy.
By factoring in the projected importer demand gap that is currently unmet and could be potential opportunity, it identifies the potential for the Exporter (Country) among 190 countries, against the general trade analysis, which identifies the biggest importer or exporter.
To discover high-growth global markets and optimize your business strategy:
Click Here
Pricing
- Single User License$ 1,995
- Department License$ 2,400
- Site License$ 3,120
- Global License$ 3,795

Search
Thought Leadership and Analyst Meet


Our Clients
Latest Reports
- Philippines Polyhydroxybutyrate-co-Hydroxyvalerate Market (2026-2032) | Trends, Insights, Challenges, Restraints, Competition, Size, Value, Forecast, Pricing, Share, Outlook, Revenue, Investment Opportunities, Strategy, Drivers, Demand, Growth, segmentation, Analysis, Companies
- Peru Polyhydroxybutyrate-co-Hydroxyvalerate Market (2026-2032) | Growth, Demand, Challenges, Share, Trends, Analysis, Pricing, Investment Opportunities, Drivers, Value, Forecast, Competition, Size, Companies, Insights, Outlook, Restraints, segmentation, Revenue, Strategy
- Pakistan Polyhydroxybutyrate-co-Hydroxyvalerate Market (2026-2032) | Restraints, segmentation, Pricing, Forecast, Share, Strategy, Competition, Trends, Insights, Drivers, Challenges, Growth, Revenue, Outlook, Value, Investment Opportunities, Companies, Size, Analysis, Demand
- Oman Polyhydroxybutyrate-co-Hydroxyvalerate Market (2026-2032) | Drivers, segmentation, Insights, Competition, Pricing, Outlook, Size, Revenue, Challenges, Forecast, Analysis, Growth, Value, Share, Trends, Investment Opportunities, Strategy, Restraints, Companies, Demand
- Nigeria Polyhydroxybutyrate-co-Hydroxyvalerate Market (2026-2032) | Value, Investment Opportunities, Analysis, Revenue, Restraints, Pricing, Outlook, Competition, Demand, Growth, Forecast, Companies, Trends, Challenges, segmentation, Drivers, Insights, Share, Size, Strategy
- Nepal Polyhydroxybutyrate-co-Hydroxyvalerate Market (2026-2032) | Insights, Analysis, Drivers, Share, Revenue, Demand, segmentation, Investment Opportunities, Competition, Forecast, Growth, Pricing, Companies, Strategy, Trends, Restraints, Challenges, Outlook, Size, Value
- Myanmar Polyhydroxybutyrate-co-Hydroxyvalerate Market (2026-2032) | Outlook, Revenue, Strategy, Restraints, Drivers, segmentation, Share, Forecast, Competition, Insights, Growth, Pricing, Size, Demand, Value, Companies, Trends, Challenges, Investment Opportunities, Analysis
- Morocco Polyhydroxybutyrate-co-Hydroxyvalerate Market (2026-2032) | Outlook, Investment Opportunities, Restraints, Strategy, Forecast, Challenges, Drivers, Growth, Companies, segmentation, Trends, Size, Competition, Revenue, Demand, Insights, Share, Analysis, Value, Pricing
- Mexico Polyhydroxybutyrate-co-Hydroxyvalerate Market (2026-2032) | Size, Drivers, Outlook, Share, Strategy, Growth, Pricing, Challenges, Companies, Demand, Value, Investment Opportunities, Restraints, Trends, Forecast, segmentation, Analysis, Insights, Competition, Revenue
- Malaysia Polyhydroxybutyrate-co-Hydroxyvalerate Market (2026-2032) | Share, segmentation, Size, Companies, Analysis, Insights, Forecast, Value, Revenue, Drivers, Restraints, Challenges, Investment Opportunities, Trends, Competition, Strategy, Demand, Growth, Outlook, Pricing
Industry Events and Analyst Meet

HIMTEX 2026

India Refining Summit 2026

India EV Show 2026

EV tech India Expo 2026

Auto Tech Asia 2026
Whitepaper
- Middle East & Africa Commercial Security Market Click here to view more.
- Middle East & Africa Fire Safety Systems & Equipment Market Click here to view more.
- GCC Drone Market Click here to view more.
- Middle East Lighting Fixture Market Click here to view more.
- GCC Physical & Perimeter Security Market Click here to view more.
6WResearch In News
- Doha a strategic location for EV manufacturing hub: IPA Qatar
- Demand for luxury TVs surging in the GCC, says Samsung
- Empowering Growth: The Thriving Journey of Bangladesh’s Cable Industry
- Demand for luxury TVs surging in the GCC, says Samsung
- Video call with a traditional healer? Once unthinkable, it’s now common in South Africa
- Intelligent Buildings To Smooth GCC’s Path To Net Zero