Croatia Ethyl acetate Market (2026-2032) | Revenue, Share, Value, Segmentation, Industry, Analysis, Trends, Outlook, Companies, Forecast, Growth & Size
Market Forecast By Application (Adhesives & Sealants, Coatings Formulations, Pigments, Flavor Enhancer, Process Solvents, Intermediates, Others), By End-Use Industry (Food & Beverage, Paints & Coatings, Pharmaceuticals, Automotive, Artificial Leather, Packaging, Others) And Competitive Landscape
| Product Code: ETC4682819 | Publication Date: Nov 2023 | Updated Date: Apr 2026 | Product Type: Market Research Report | |
| Publisher: 6Wresearch | Author: Shubham Padhi | No. of Pages: 60 | No. of Figures: 30 | No. of Tables: 5 |
Croatia Ethyl Acetate Market Size (2020-2030)
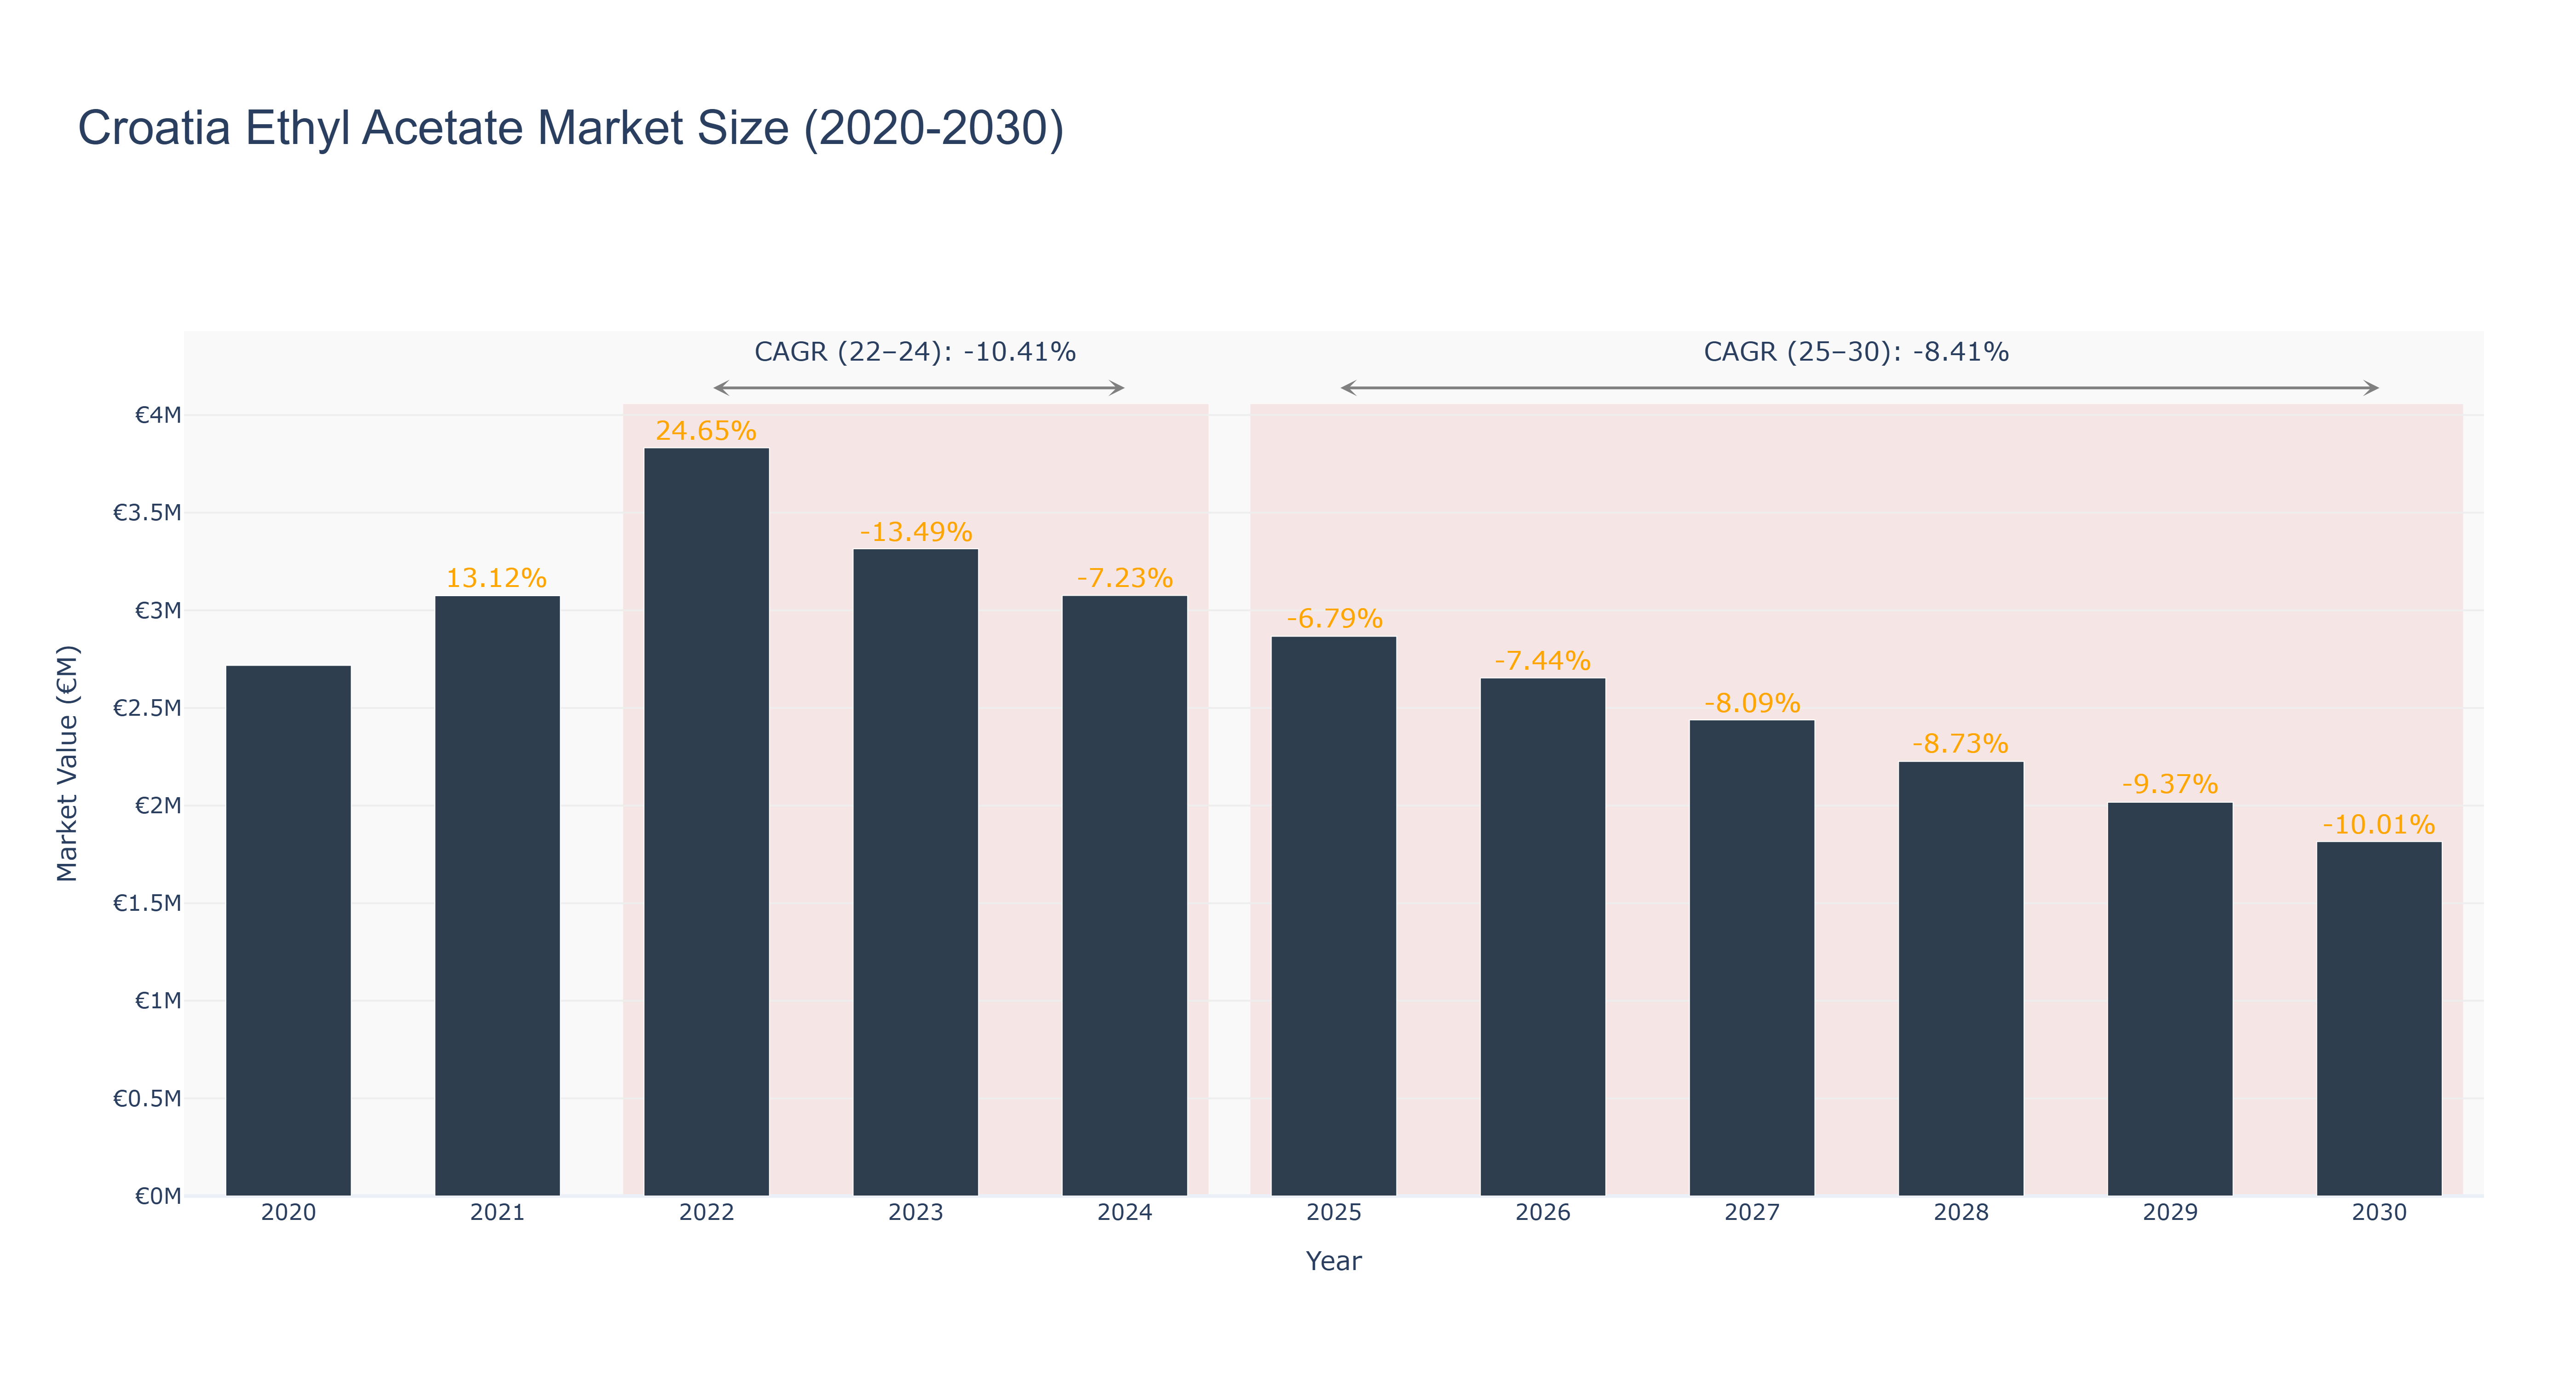
Croatia's Ethyl Acetate Market has seen a decline in market size from €3.83 million in 2022 to €2.65 million in 2026, with a CAGR of -10.41% between 2022-2024. The forecasted trend indicates a further decrease to €1.82 million by 2030, with a CAGR of -8.41% from 2025-2030. The market's downfall can be attributed to factors such as changing consumer preferences towards eco-friendly alternatives and economic uncertainties impacting industrial demand. Looking ahead, the market is expected to witness a shift towards sustainable production practices and increased focus on product innovation to meet evolving regulatory standards. Recent developments in Croatia's chemical industry include investments in research and development for green technologies, aiming to enhance competitiveness and sustainability in the Ethyl Acetate market.
Croatia Ethyl Acetate Market: Production & Trade Performance (2019-2025)
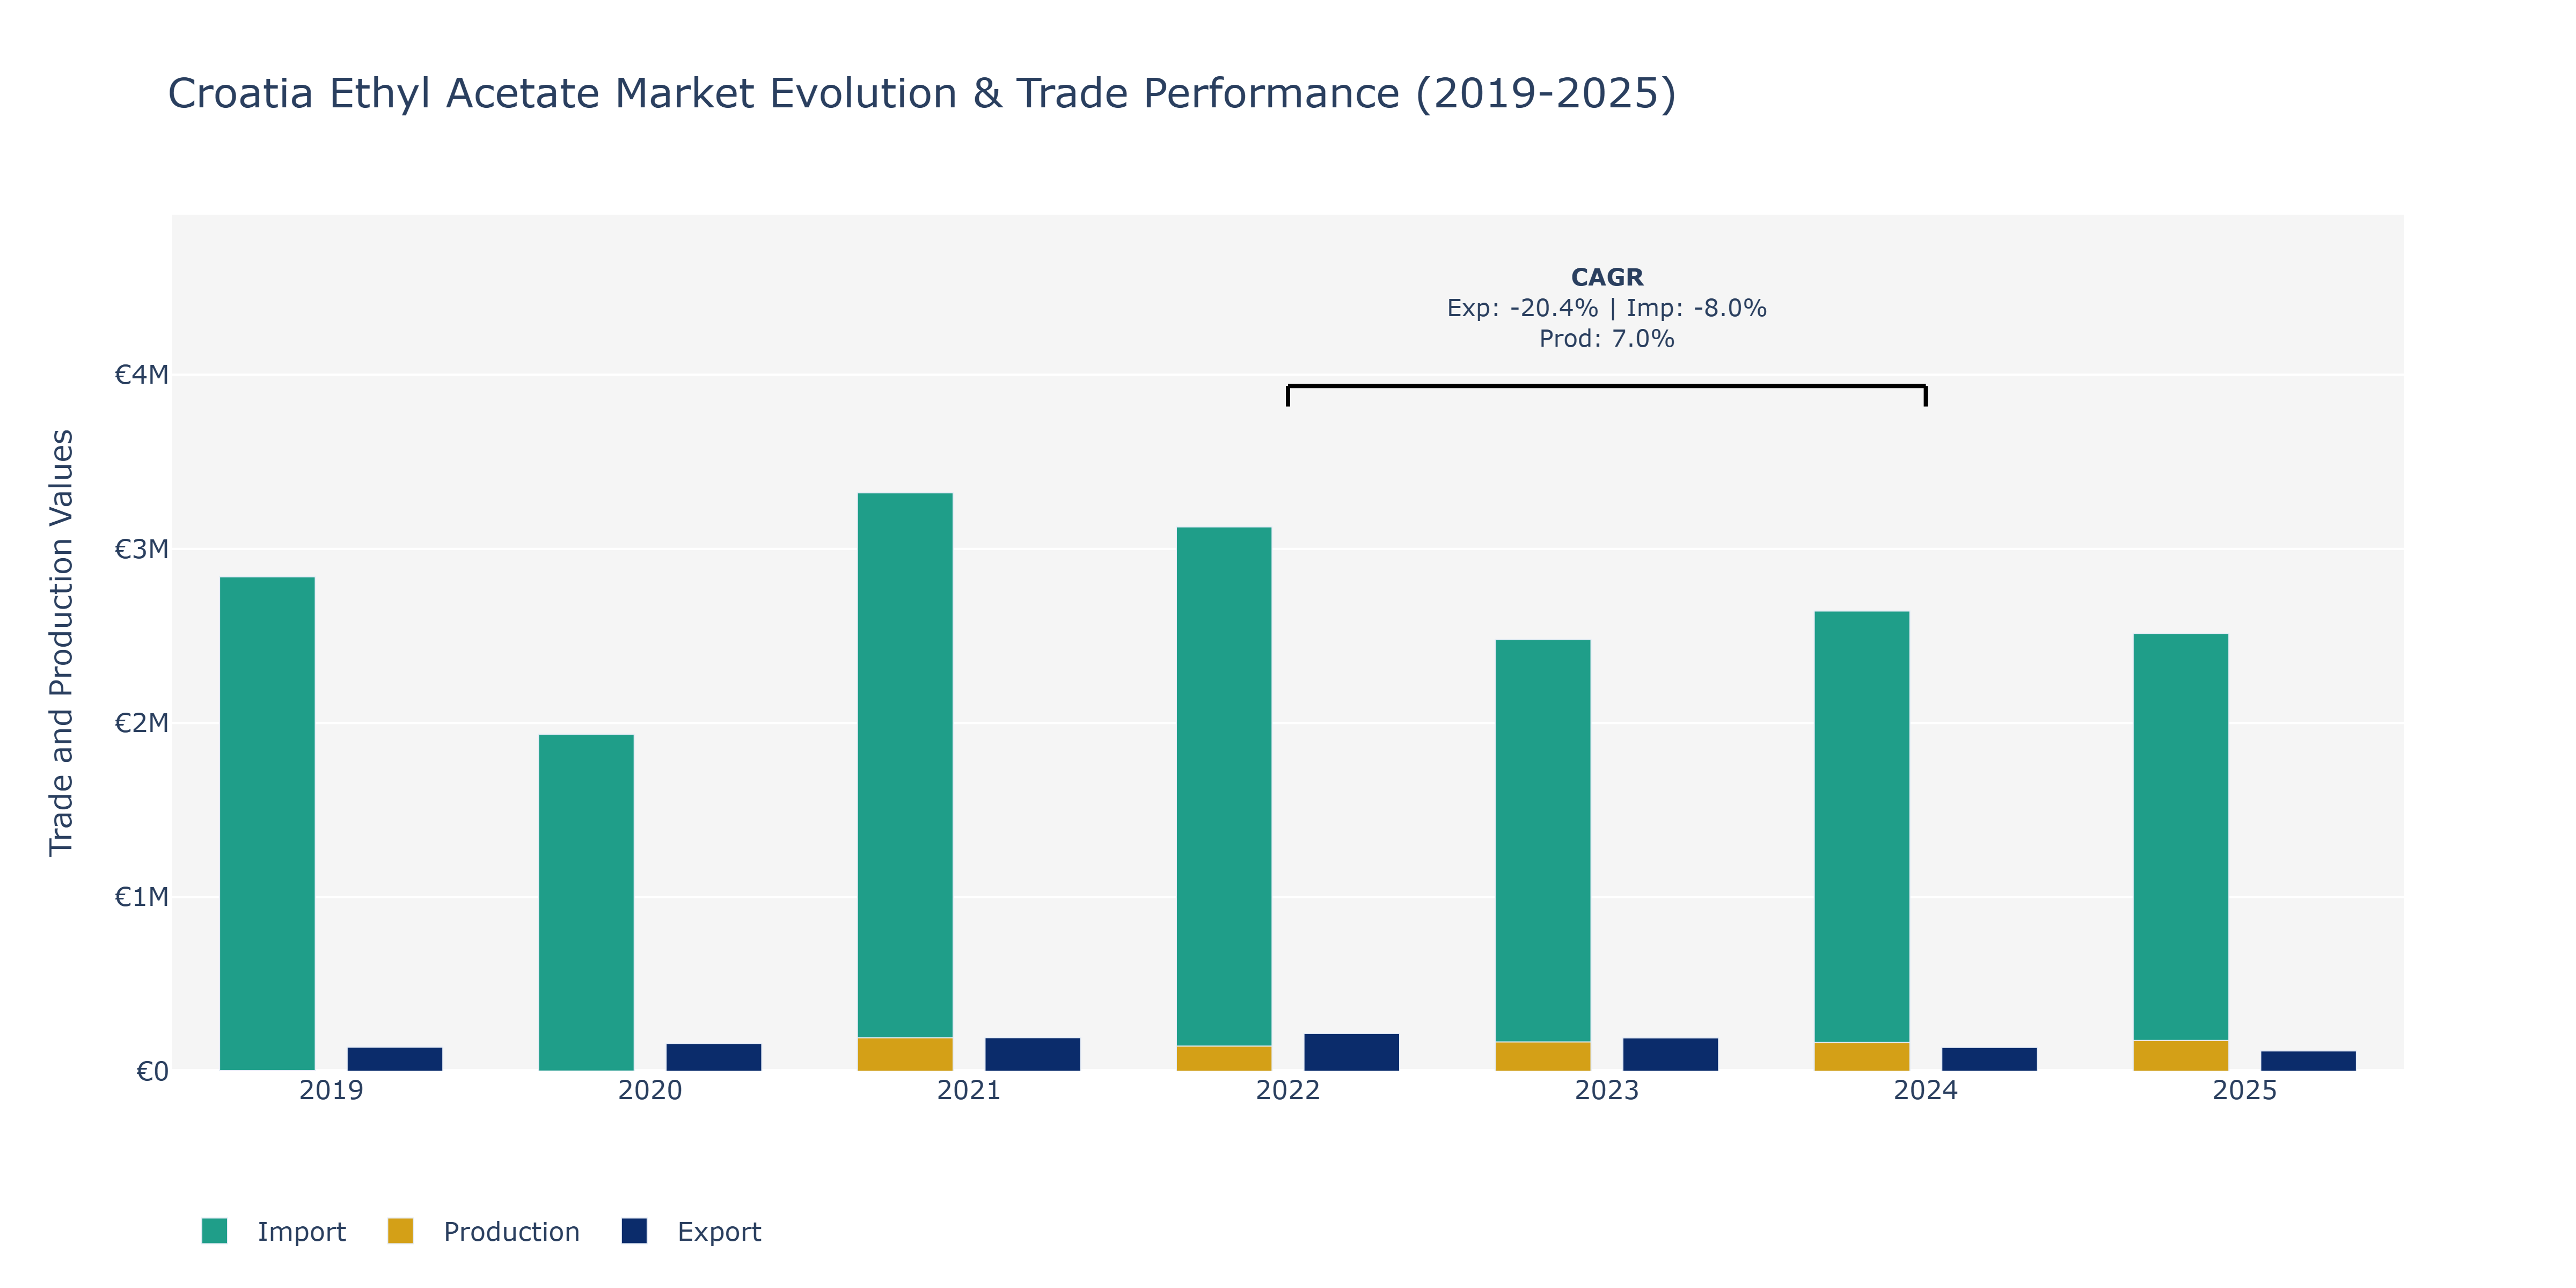
In the Croatia Ethyl Acetate market, exports showed a fluctuating trend over the years. Starting at €138.18 thousand in 2019, they peaked in 2022 at €215.9 thousand before declining to €116.08 thousand in 2025. This decline could be attributed to various factors such as changing global demand, geopolitical uncertainties affecting trade, or shifts in market competitiveness. On the other hand, imports experienced a more consistent pattern, with a notable decrease from €2.84 million in 2019 to €1.93 million in 2020, followed by a gradual increase to €2.51 million in 2025. Such fluctuations might be influenced by changes in production costs, currency exchange rates, or trade agreements. Production levels, on the contrary, demonstrated a steady rise from €2.70 million in 2019 to €1.77 million in 2025, showcasing an upward trajectory likely driven by increased domestic consumption or technological advancements enhancing efficiency within the industry.
Key Highlights of the Report:
- Croatia Ethyl acetate Market Outlook
- Market Size of Croatia Ethyl acetate Market, 2025
- Forecast of Croatia Ethyl acetate Market, 2032
- Historical Data and Forecast of Croatia Ethyl acetate Revenues & Volume for the Period 2022 - 2032F
- Croatia Ethyl acetate Market Trend Evolution
- Croatia Ethyl acetate Market Drivers and Challenges
- Croatia Ethyl acetate Price Trends
- Croatia Ethyl acetate Porter`s Five Forces
- Croatia Ethyl acetate Industry Life Cycle
- Historical Data and Forecast of Croatia Ethyl acetate Market Revenues & Volume By Application for the Period 2022 - 2032F
- Historical Data and Forecast of Croatia Ethyl acetate Market Revenues & Volume By Adhesives & Sealants for the Period 2022 - 2032F
- Historical Data and Forecast of Croatia Ethyl acetate Market Revenues & Volume By Coatings Formulations for the Period 2022 - 2032F
- Historical Data and Forecast of Croatia Ethyl acetate Market Revenues & Volume By Pigments for the Period 2022 - 2032F
- Historical Data and Forecast of Croatia Ethyl acetate Market Revenues & Volume By Flavor Enhancer for the Period 2022 - 2032F
- Historical Data and Forecast of Croatia Ethyl acetate Market Revenues & Volume By Process Solvents for the Period 2022 - 2032F
- Historical Data and Forecast of Croatia Ethyl acetate Market Revenues & Volume By Intermediates for the Period 2022 - 2032F
- Historical Data and Forecast of Croatia Ethyl acetate Market Revenues & Volume By Others for the Period 2022 - 2032F
- Historical Data and Forecast of Croatia Ethyl acetate Market Revenues & Volume By End-Use Industry for the Period 2022 - 2032F
- Historical Data and Forecast of Croatia Ethyl acetate Market Revenues & Volume By Food & Beverage for the Period 2022 - 2032F
- Historical Data and Forecast of Croatia Ethyl acetate Market Revenues & Volume By Paints & Coatings for the Period 2022 - 2032F
- Historical Data and Forecast of Croatia Ethyl acetate Market Revenues & Volume By Pharmaceuticals for the Period 2022 - 2032F
- Historical Data and Forecast of Croatia Ethyl acetate Market Revenues & Volume By Automotive for the Period 2022 - 2032F
- Historical Data and Forecast of Croatia Ethyl acetate Market Revenues & Volume By Artificial Leather for the Period 2022 - 2032F
- Historical Data and Forecast of Croatia Ethyl acetate Market Revenues & Volume By Packaging for the Period 2022 - 2032F
- Historical Data and Forecast of Croatia Ethyl acetate Market Revenues & Volume By Others for the Period 2022 - 2032F
- Croatia Ethyl acetate Import Export Trade Statistics
- Market Opportunity Assessment By Application
- Market Opportunity Assessment By End-Use Industry
- Croatia Ethyl acetate Top Companies Market Share
- Croatia Ethyl acetate Competitive Benchmarking By Technical and Operational Parameters
- Croatia Ethyl acetate Company Profiles
- Croatia Ethyl acetate Key Strategic Recommendations
Frequently Asked Questions About the Market Study (FAQs):
6Wresearch actively monitors the Croatia Ethyl acetate Market and publishes its comprehensive annual report, highlighting emerging trends, growth drivers, revenue analysis, and forecast outlook. Our insights help businesses to make data-backed strategic decisions with ongoing market dynamics. Our analysts track relevent industries related to the Croatia Ethyl acetate Market, allowing our clients with actionable intelligence and reliable forecasts tailored to emerging regional needs.
Yes, we provide customisation as per your requirements. To learn more, feel free to contact us on sales@6wresearch.com
1 Executive Summary |
2 Introduction |
2.1 Key Highlights of the Report |
2.2 Report Description |
2.3 Market Scope & Segmentation |
2.4 Research Methodology |
2.5 Assumptions |
3 Croatia Ethyl acetate Market Overview |
3.1 Croatia Country Macro Economic Indicators |
3.2 Croatia Ethyl acetate Market Revenues & Volume, 2022 & 2032F |
3.3 Croatia Ethyl acetate Market - Industry Life Cycle |
3.4 Croatia Ethyl acetate Market - Porter's Five Forces |
3.5 Croatia Ethyl acetate Market Revenues & Volume Share, By Application, 2022 & 2032F |
3.6 Croatia Ethyl acetate Market Revenues & Volume Share, By End-Use Industry, 2022 & 2032F |
4 Croatia Ethyl acetate Market Dynamics |
4.1 Impact Analysis |
4.2 Market Drivers |
4.2.1 Growth in the food and beverage industry, leading to increased demand for ethyl acetate as a solvent and flavoring agent. |
4.2.2 Expansion of the pharmaceutical sector, driving the need for ethyl acetate in the production of medicines and coatings. |
4.2.3 Rising adoption of eco-friendly solvents, with ethyl acetate being considered a more sustainable alternative to other chemicals. |
4.3 Market Restraints |
4.3.1 Fluctuations in raw material prices, such as ethanol and acetic acid, impacting the production cost of ethyl acetate. |
4.3.2 Stringent regulations on chemical emissions and waste disposal, which may increase compliance costs for ethyl acetate manufacturers. |
5 Croatia Ethyl acetate Market Trends |
6 Croatia Ethyl acetate Market Segmentations |
6.1 Croatia Ethyl acetate Market, By Application |
6.1.1 Overview and Analysis |
6.1.2 Croatia Ethyl acetate Market Revenues & Volume, By Adhesives & Sealants, 2022 - 2032F |
6.1.3 Croatia Ethyl acetate Market Revenues & Volume, By Coatings Formulations, 2022 - 2032F |
6.1.4 Croatia Ethyl acetate Market Revenues & Volume, By Pigments, 2022 - 2032F |
6.1.5 Croatia Ethyl acetate Market Revenues & Volume, By Flavor Enhancer, 2022 - 2032F |
6.1.6 Croatia Ethyl acetate Market Revenues & Volume, By Process Solvents, 2022 - 2032F |
6.1.7 Croatia Ethyl acetate Market Revenues & Volume, By Intermediates, 2022 - 2032F |
6.2 Croatia Ethyl acetate Market, By End-Use Industry |
6.2.1 Overview and Analysis |
6.2.2 Croatia Ethyl acetate Market Revenues & Volume, By Food & Beverage, 2022 - 2032F |
6.2.3 Croatia Ethyl acetate Market Revenues & Volume, By Paints & Coatings, 2022 - 2032F |
6.2.4 Croatia Ethyl acetate Market Revenues & Volume, By Pharmaceuticals, 2022 - 2032F |
6.2.5 Croatia Ethyl acetate Market Revenues & Volume, By Automotive, 2022 - 2032F |
6.2.6 Croatia Ethyl acetate Market Revenues & Volume, By Artificial Leather, 2022 - 2032F |
6.2.7 Croatia Ethyl acetate Market Revenues & Volume, By Packaging, 2022 - 2032F |
7 Croatia Ethyl acetate Market Import-Export Trade Statistics |
7.1 Croatia Ethyl acetate Market Export to Major Countries |
7.2 Croatia Ethyl acetate Market Imports from Major Countries |
8 Croatia Ethyl acetate Market Key Performance Indicators |
8.1 Percentage of ethyl acetate production derived from renewable sources. |
8.2 Number of research and development initiatives focused on enhancing ethyl acetate production efficiency and sustainability. |
8.3 Adoption rate of ethyl acetate in emerging applications, such as in the cosmetics and automotive industries. |
9 Croatia Ethyl acetate Market - Opportunity Assessment |
9.1 Croatia Ethyl acetate Market Opportunity Assessment, By Application, 2022 & 2032F |
9.2 Croatia Ethyl acetate Market Opportunity Assessment, By End-Use Industry, 2022 & 2032F |
10 Croatia Ethyl acetate Market - Competitive Landscape |
10.1 Croatia Ethyl acetate Market Revenue Share, By Companies, 2025 |
10.2 Croatia Ethyl acetate Market Competitive Benchmarking, By Operating and Technical Parameters |
11 Company Profiles |
12 Recommendations | 13 Disclaimer |
Export potential assessment - trade Analytics for 2030
Export potential enables firms to identify high-growth global markets with greater confidence by combining advanced trade intelligence with a structured quantitative methodology. The framework analyzes emerging demand trends and country-level import patterns while integrating macroeconomic and trade datasets such as GDP and population forecasts, bilateral import–export flows, tariff structures, elasticity differentials between developed and developing economies, geographic distance, and import demand projections. Using weighted trade values from 2020–2024 as the base period to project country-to-country export potential for 2030, these inputs are operationalized through calculated drivers such as gravity model parameters, tariff impact factors, and projected GDP per-capita growth. Through an analysis of hidden potentials, demand hotspots, and market conditions that are most favorable to success, this method enables firms to focus on target countries, maximize returns, and global expansion with data, backed by accuracy.
By factoring in the projected importer demand gap that is currently unmet and could be potential opportunity, it identifies the potential for the Exporter (Country) among 190 countries, against the general trade analysis, which identifies the biggest importer or exporter.
To discover high-growth global markets and optimize your business strategy:
Click Here
Pricing
- Single User License$ 1,995
- Department License$ 2,400
- Site License$ 3,120
- Global License$ 3,795

Search
Thought Leadership and Analyst Meet


Our Clients
Latest Reports
- China Electric Appliance Rental Market (2026-2032) | Trends, Revenue, Growth, Challenges, Size, Value, Outlook, Pricing, Strategy, Insights, Restraints, segmentation, Companies, Investment Opportunities, Analysis, Demand, Drivers, Competition, Forecast, Share
- Chile Electric Appliance Rental Market (2026-2032) | Outlook, Competition, Drivers, Strategy, Revenue, Analysis, Value, Pricing, Restraints, Size, Demand, Share, Growth, Forecast, Challenges, Insights, Investment Opportunities, Companies, Trends, segmentation
- Cambodia Electric Appliance Rental Market (2026-2032) | Companies, Analysis, Restraints, Pricing, Insights, Challenges, Outlook, Strategy, Forecast, Trends, Competition, Value, Revenue, Investment Opportunities, segmentation, Drivers, Size, Demand, Growth, Share
- Brazil Electric Appliance Rental Market (2026-2032) | Revenue, Strategy, Forecast, Companies, segmentation, Competition, Size, Investment Opportunities, Pricing, Restraints, Outlook, Challenges, Analysis, Drivers, Value, Demand, Insights, Trends, Growth, Share
- Bangladesh Electric Appliance Rental Market (2026-2032) | Drivers, Forecast, Investment Opportunities, Strategy, Insights, Demand, Challenges, Outlook, Trends, Competition, Value, Revenue, Size, Pricing, Analysis, Companies, Restraints, segmentation, Share, Growth
- Bahrain Electric Appliance Rental Market (2026-2032) | Outlook, Size, Competition, Restraints, Drivers, Value, Trends, Investment Opportunities, Insights, Forecast, Revenue, Strategy, Growth, Share, Demand, Analysis, Challenges, Companies, segmentation, Pricing
- Azerbaijan Electric Appliance Rental Market (2026-2032) | Trends, Investment Opportunities, Restraints, Insights, Strategy, Competition, Value, Growth, Demand, Drivers, Analysis, Forecast, Size, Share, Outlook, segmentation, Pricing, Challenges, Revenue, Companies
- Australia Electric Appliance Rental Market (2026-2032) | Challenges, Restraints, Forecast, Demand, Size, Competition, Pricing, Investment Opportunities, Revenue, Trends, Drivers, Growth, Outlook, Analysis, Strategy, Value, segmentation, Insights, Companies, Share
- Argentina Electric Appliance Rental Market (2026-2032) | Growth, Trends, Insights, Outlook, Forecast, Size, Drivers, Analysis, Restraints, Challenges, Share, Revenue, Investment Opportunities, Strategy, Demand, Value, Companies, segmentation, Competition, Pricing
- Algeria Electric Appliance Rental Market (2026-2032) | Share, Size, Value, Strategy, Competition, Outlook, Challenges, Companies, Trends, Pricing, Insights, Forecast, Investment Opportunities, Revenue, Growth, Restraints, segmentation, Analysis, Demand, Drivers
Industry Events and Analyst Meet

HIMTEX 2026

India Refining Summit 2026

India EV Show 2026

EV tech India Expo 2026

Auto Tech Asia 2026
Whitepaper
- Middle East & Africa Commercial Security Market Click here to view more.
- Middle East & Africa Fire Safety Systems & Equipment Market Click here to view more.
- GCC Drone Market Click here to view more.
- Middle East Lighting Fixture Market Click here to view more.
- GCC Physical & Perimeter Security Market Click here to view more.
6WResearch In News
- Doha a strategic location for EV manufacturing hub: IPA Qatar
- Demand for luxury TVs surging in the GCC, says Samsung
- Empowering Growth: The Thriving Journey of Bangladesh’s Cable Industry
- Demand for luxury TVs surging in the GCC, says Samsung
- Video call with a traditional healer? Once unthinkable, it’s now common in South Africa
- Intelligent Buildings To Smooth GCC’s Path To Net Zero