Croatia Flanges Market (2026-2032) | Industry, Trends, Segmentation, Outlook, Value, Share, Size, Companies, Growth, Revenue, Analysis & Forecast
Market Forecast By Type (Welding Neck, Long Welding Neck, Slip-On, Socket Weld, Lap Joint, Others), By Material (Carbon Steel, Stainless Steel, Aluminum, Polymer, Others), By End Use Industry (Aviation and Aerospace, Petrochemical, Architectural Decoration, Food & Beverages Processing, Construction) And Competitive Landscape
| Product Code: ETC4925145 | Publication Date: Nov 2023 | Updated Date: Apr 2026 | Product Type: Market Research Report | |
| Publisher: 6Wresearch | Author: Shubham Padhi | No. of Pages: 60 | No. of Figures: 30 | No. of Tables: 5 |
Croatia Flanges Market Size (2020-2030)
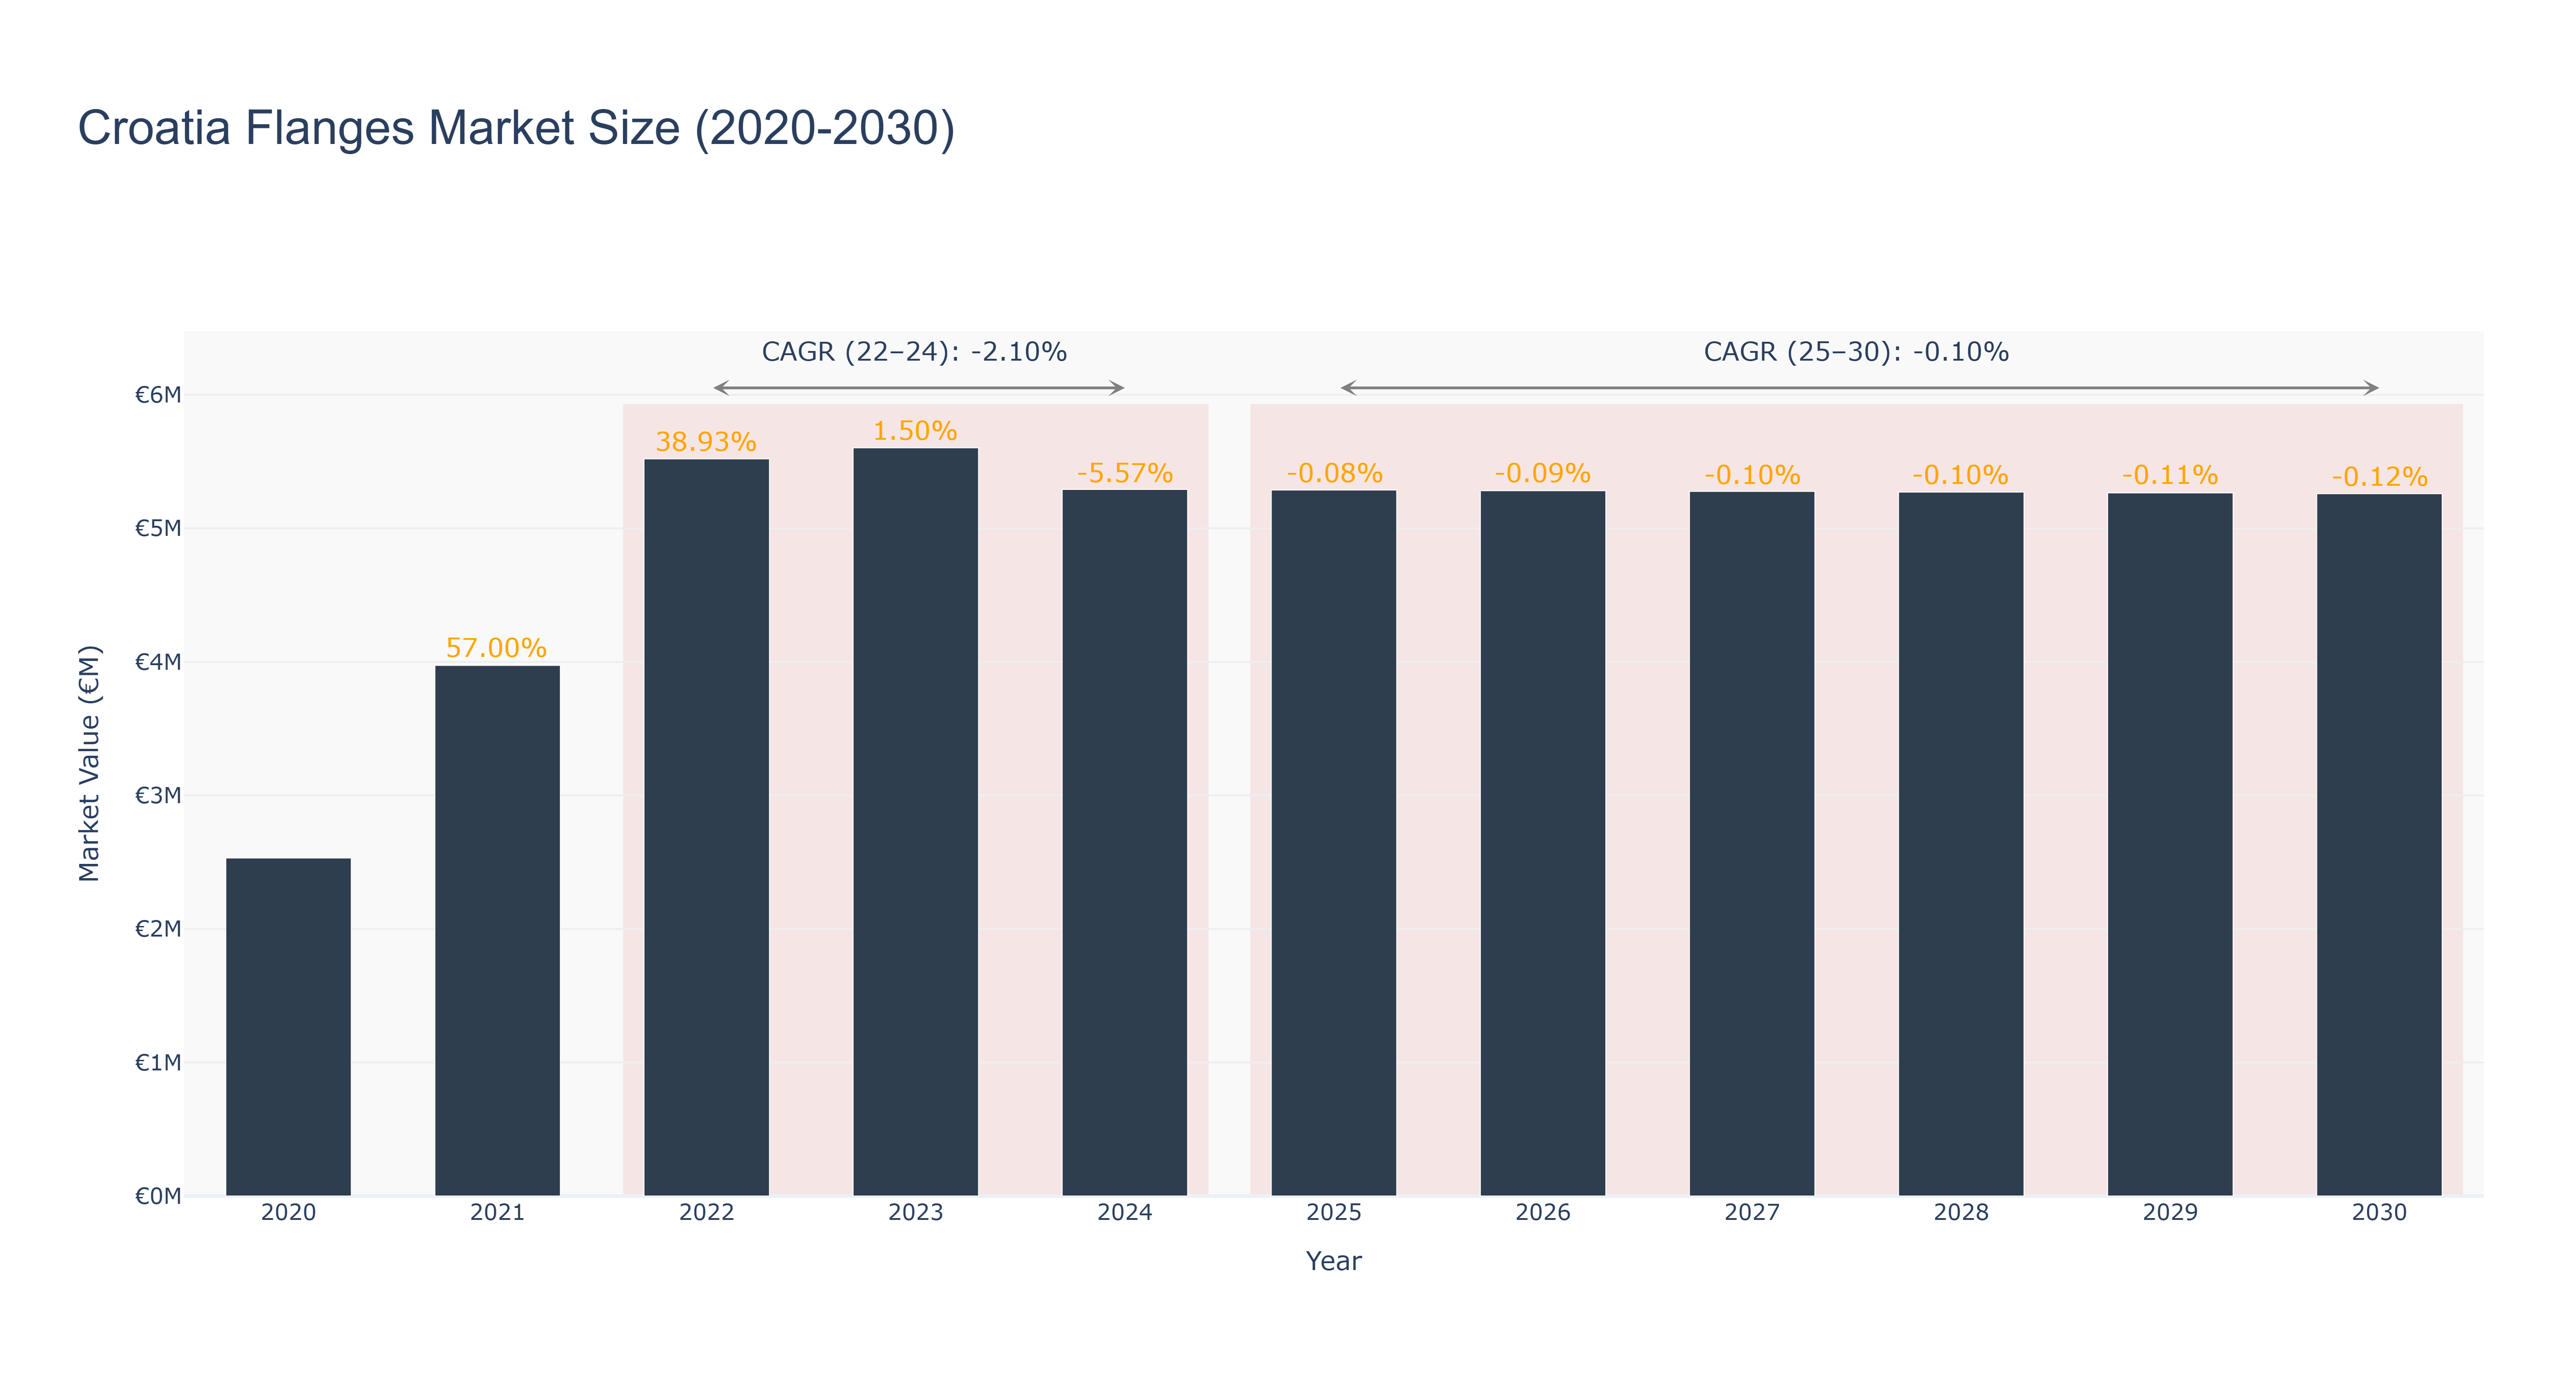
Croatia Flanges Market has seen fluctuations in market size over the years. The peak market size of €5.60 million was recorded in 2023. From 2020 to 2024, the market size ranged from €2.53 million to €5.29 million, showing growth and decline. Forecasted market size from 2025 to 2030 is expected to remain relatively stable around €5.26 million, with a slight negative CAGR of -0.0999%. The market experienced a significant decline in 2024, attributed to economic uncertainties and global market trends affecting demand. Looking ahead, industry drivers such as infrastructure development projects in Croatia are expected to provide stability for the flanges market. Recent developments include partnerships with international suppliers to enhance product quality and expand market reach, setting the stage for future growth in the sector.
Croatia Flanges Market: Production & Trade Performance (2019-2025)
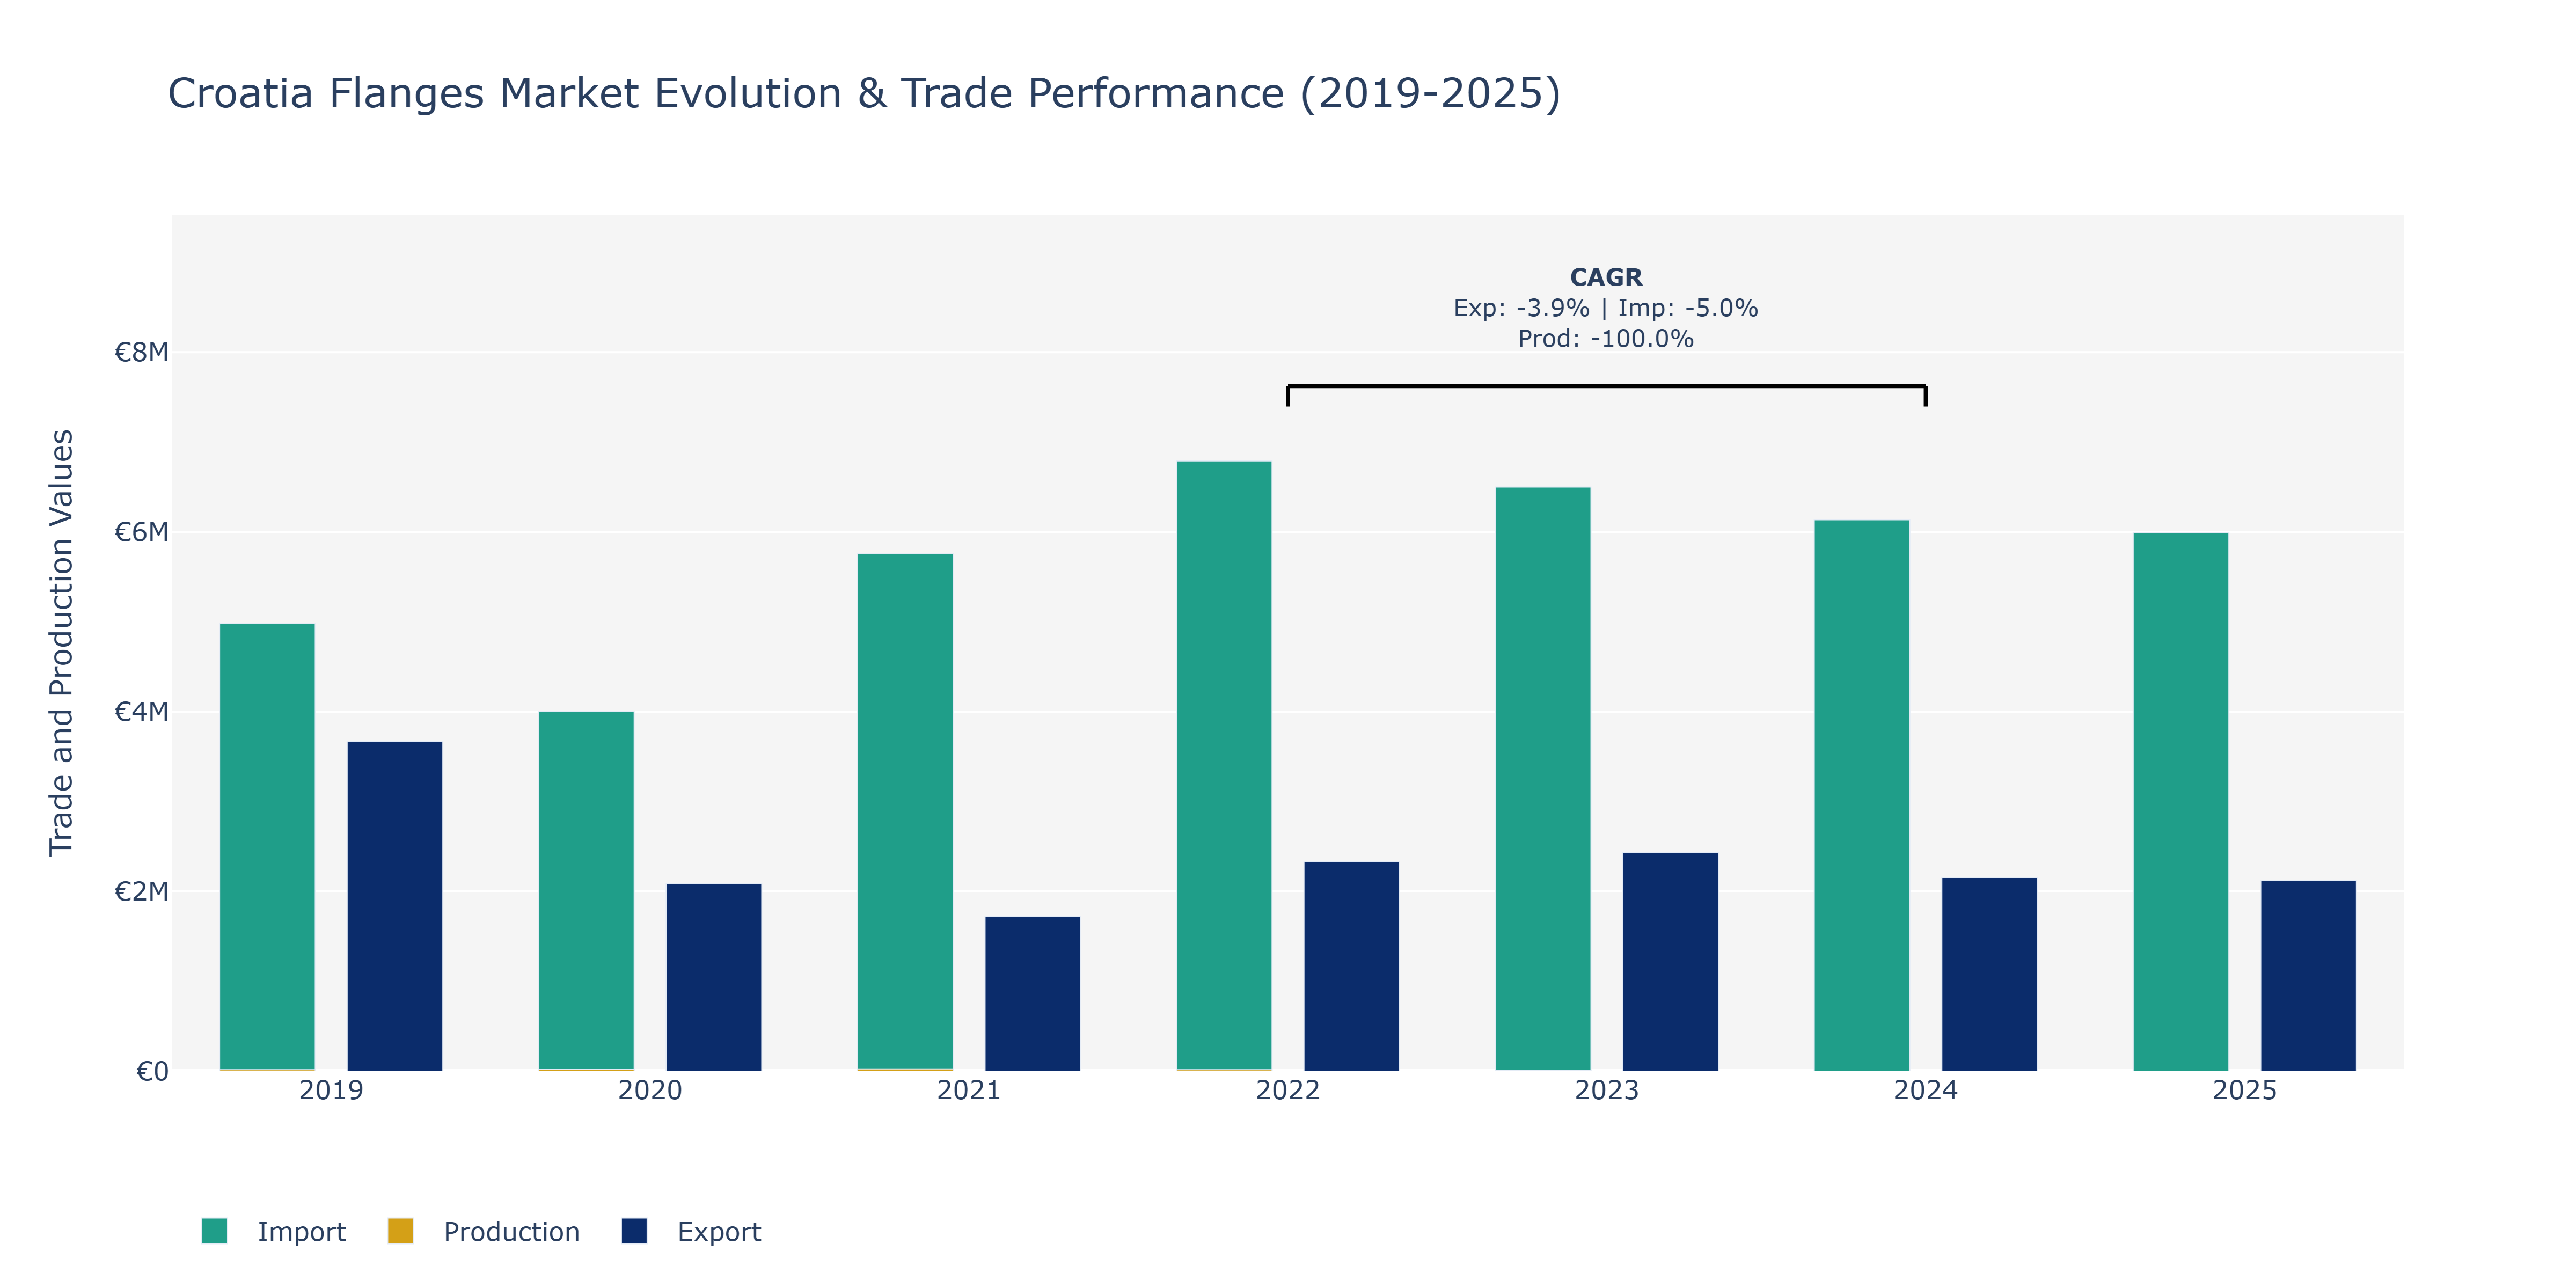
In the Croatia Flanges Market, from 2019 to 2025, exports experienced fluctuations. Export value were highest in 2019 at €3.67 million, followed by a decline in the following years, hitting a low of €2.12 million in 2025. Conversely, imports showed a fluctuating trend, peaking in 2023 at €6.5 million. Production numbers peaked in 2021 at €25 million before dropping significantly to €12 million in 2023. The decline in production could be attributed to shifts in market demand, technological advancements impacting production processes, or regulatory changes affecting manufacturing operations. The fluctuations in exports and imports could be influenced by global economic conditions, trade agreements, or changes in consumer preferences impacting product demand. To stay competitive, companies in the Croatia Flanges Market may need to adapt to these changing market dynamics by diversifying their product offerings or expanding into new markets based on evolving trade patterns and industry regulations.
Key Highlights of the Report:
- Croatia Flanges Market Outlook
- Market Size of Croatia Flanges Market, 2025
- Forecast of Croatia Flanges Market, 2032
- Historical Data and Forecast of Croatia Flanges Revenues & Volume for the Period 2022 - 2032F
- Croatia Flanges Market Trend Evolution
- Croatia Flanges Market Drivers and Challenges
- Croatia Flanges Price Trends
- Croatia Flanges Porter`s Five Forces
- Croatia Flanges Industry Life Cycle
- Historical Data and Forecast of Croatia Flanges Market Revenues & Volume By Type for the Period 2022 - 2032F
- Historical Data and Forecast of Croatia Flanges Market Revenues & Volume By Welding Neck for the Period 2022 - 2032F
- Historical Data and Forecast of Croatia Flanges Market Revenues & Volume By Long Welding Neck for the Period 2022 - 2032F
- Historical Data and Forecast of Croatia Flanges Market Revenues & Volume By Slip-On for the Period 2022 - 2032F
- Historical Data and Forecast of Croatia Flanges Market Revenues & Volume By Socket Weld for the Period 2022 - 2032F
- Historical Data and Forecast of Croatia Flanges Market Revenues & Volume By Lap Joint for the Period 2022 - 2032F
- Historical Data and Forecast of Croatia Flanges Market Revenues & Volume By Others for the Period 2022 - 2032F
- Historical Data and Forecast of Croatia Flanges Market Revenues & Volume By Material for the Period 2022 - 2032F
- Historical Data and Forecast of Croatia Flanges Market Revenues & Volume By Carbon Steel for the Period 2022 - 2032F
- Historical Data and Forecast of Croatia Flanges Market Revenues & Volume By Stainless Steel for the Period 2022 - 2032F
- Historical Data and Forecast of Croatia Flanges Market Revenues & Volume By Aluminum for the Period 2022 - 2032F
- Historical Data and Forecast of Croatia Flanges Market Revenues & Volume By Polymer for the Period 2022 - 2032F
- Historical Data and Forecast of Croatia Flanges Market Revenues & Volume By Others for the Period 2022 - 2032F
- Historical Data and Forecast of Croatia Flanges Market Revenues & Volume By End Use Industry for the Period 2022 - 2032F
- Historical Data and Forecast of Croatia Flanges Market Revenues & Volume By Aviation and Aerospace for the Period 2022 - 2032F
- Historical Data and Forecast of Croatia Flanges Market Revenues & Volume By Petrochemical for the Period 2022 - 2032F
- Historical Data and Forecast of Croatia Flanges Market Revenues & Volume By Architectural Decoration for the Period 2022 - 2032F
- Historical Data and Forecast of Croatia Flanges Market Revenues & Volume By Food & Beverages Processing for the Period 2022 - 2032F
- Historical Data and Forecast of Croatia Flanges Market Revenues & Volume By Construction for the Period 2022 - 2032F
- Croatia Flanges Import Export Trade Statistics
- Market Opportunity Assessment By Type
- Market Opportunity Assessment By Material
- Market Opportunity Assessment By End Use Industry
- Croatia Flanges Top Companies Market Share
- Croatia Flanges Competitive Benchmarking By Technical and Operational Parameters
- Croatia Flanges Company Profiles
- Croatia Flanges Key Strategic Recommendations
Frequently Asked Questions About the Market Study (FAQs):
6Wresearch actively monitors the Croatia Flanges Market and publishes its comprehensive annual report, highlighting emerging trends, growth drivers, revenue analysis, and forecast outlook. Our insights help businesses to make data-backed strategic decisions with ongoing market dynamics. Our analysts track relevent industries related to the Croatia Flanges Market, allowing our clients with actionable intelligence and reliable forecasts tailored to emerging regional needs.
Yes, we provide customisation as per your requirements. To learn more, feel free to contact us on sales@6wresearch.com
1 Executive Summary |
2 Introduction |
2.1 Key Highlights of the Report |
2.2 Report Description |
2.3 Market Scope & Segmentation |
2.4 Research Methodology |
2.5 Assumptions |
3 Croatia Flanges Market Overview |
3.1 Croatia Country Macro Economic Indicators |
3.2 Croatia Flanges Market Revenues & Volume, 2022 & 2032F |
3.3 Croatia Flanges Market - Industry Life Cycle |
3.4 Croatia Flanges Market - Porter's Five Forces |
3.5 Croatia Flanges Market Revenues & Volume Share, By Type, 2022 & 2032F |
3.6 Croatia Flanges Market Revenues & Volume Share, By Material, 2022 & 2032F |
3.7 Croatia Flanges Market Revenues & Volume Share, By End Use Industry, 2022 & 2032F |
4 Croatia Flanges Market Dynamics |
4.1 Impact Analysis |
4.2 Market Drivers |
4.2.1 Increasing demand for energy and infrastructure projects in Croatia |
4.2.2 Growth in the oil and gas industry in the region |
4.2.3 Government initiatives to boost manufacturing and industrial sectors |
4.3 Market Restraints |
4.3.1 Volatility in raw material prices affecting production costs |
4.3.2 Intense competition from global and regional flange manufacturers |
4.3.3 Economic uncertainties impacting investment decisions |
5 Croatia Flanges Market Trends |
6 Croatia Flanges Market Segmentations |
6.1 Croatia Flanges Market, By Type |
6.1.1 Overview and Analysis |
6.1.2 Croatia Flanges Market Revenues & Volume, By Welding Neck, 2022 - 2032F |
6.1.3 Croatia Flanges Market Revenues & Volume, By Long Welding Neck, 2022 - 2032F |
6.1.4 Croatia Flanges Market Revenues & Volume, By Slip-On, 2022 - 2032F |
6.1.5 Croatia Flanges Market Revenues & Volume, By Socket Weld, 2022 - 2032F |
6.1.6 Croatia Flanges Market Revenues & Volume, By Lap Joint, 2022 - 2032F |
6.1.7 Croatia Flanges Market Revenues & Volume, By Others, 2022 - 2032F |
6.2 Croatia Flanges Market, By Material |
6.2.1 Overview and Analysis |
6.2.2 Croatia Flanges Market Revenues & Volume, By Carbon Steel, 2022 - 2032F |
6.2.3 Croatia Flanges Market Revenues & Volume, By Stainless Steel, 2022 - 2032F |
6.2.4 Croatia Flanges Market Revenues & Volume, By Aluminum, 2022 - 2032F |
6.2.5 Croatia Flanges Market Revenues & Volume, By Polymer, 2022 - 2032F |
6.2.6 Croatia Flanges Market Revenues & Volume, By Others, 2022 - 2032F |
6.3 Croatia Flanges Market, By End Use Industry |
6.3.1 Overview and Analysis |
6.3.2 Croatia Flanges Market Revenues & Volume, By Aviation and Aerospace, 2022 - 2032F |
6.3.3 Croatia Flanges Market Revenues & Volume, By Petrochemical, 2022 - 2032F |
6.3.4 Croatia Flanges Market Revenues & Volume, By Architectural Decoration, 2022 - 2032F |
6.3.5 Croatia Flanges Market Revenues & Volume, By Food & Beverages Processing, 2022 - 2032F |
6.3.6 Croatia Flanges Market Revenues & Volume, By Construction, 2022 - 2032F |
7 Croatia Flanges Market Import-Export Trade Statistics |
7.1 Croatia Flanges Market Export to Major Countries |
7.2 Croatia Flanges Market Imports from Major Countries |
8 Croatia Flanges Market Key Performance Indicators |
8.1 Number of infrastructure projects in Croatia using flanges |
8.2 Percentage increase in oil and gas exploration activities in the region |
8.3 Adoption rate of advanced technologies in flange manufacturing and usage |
9 Croatia Flanges Market - Opportunity Assessment |
9.1 Croatia Flanges Market Opportunity Assessment, By Type, 2022 & 2032F |
9.2 Croatia Flanges Market Opportunity Assessment, By Material, 2022 & 2032F |
9.3 Croatia Flanges Market Opportunity Assessment, By End Use Industry, 2022 & 2032F |
10 Croatia Flanges Market - Competitive Landscape |
10.1 Croatia Flanges Market Revenue Share, By Companies, 2025 |
10.2 Croatia Flanges Market Competitive Benchmarking, By Operating and Technical Parameters |
11 Company Profiles |
12 Recommendations | 13 Disclaimer |
Export potential assessment - trade Analytics for 2030
Export potential enables firms to identify high-growth global markets with greater confidence by combining advanced trade intelligence with a structured quantitative methodology. The framework analyzes emerging demand trends and country-level import patterns while integrating macroeconomic and trade datasets such as GDP and population forecasts, bilateral import–export flows, tariff structures, elasticity differentials between developed and developing economies, geographic distance, and import demand projections. Using weighted trade values from 2020–2024 as the base period to project country-to-country export potential for 2030, these inputs are operationalized through calculated drivers such as gravity model parameters, tariff impact factors, and projected GDP per-capita growth. Through an analysis of hidden potentials, demand hotspots, and market conditions that are most favorable to success, this method enables firms to focus on target countries, maximize returns, and global expansion with data, backed by accuracy.
By factoring in the projected importer demand gap that is currently unmet and could be potential opportunity, it identifies the potential for the Exporter (Country) among 190 countries, against the general trade analysis, which identifies the biggest importer or exporter.
To discover high-growth global markets and optimize your business strategy:
Click Here
Pricing
- Single User License$ 1,995
- Department License$ 2,400
- Site License$ 3,120
- Global License$ 3,795

Search
Thought Leadership and Analyst Meet


Our Clients
Latest Reports
- Philippines Polyhydroxybutyrate-co-Hydroxyvalerate Market (2026-2032) | Trends, Insights, Challenges, Restraints, Competition, Size, Value, Forecast, Pricing, Share, Outlook, Revenue, Investment Opportunities, Strategy, Drivers, Demand, Growth, segmentation, Analysis, Companies
- Peru Polyhydroxybutyrate-co-Hydroxyvalerate Market (2026-2032) | Growth, Demand, Challenges, Share, Trends, Analysis, Pricing, Investment Opportunities, Drivers, Value, Forecast, Competition, Size, Companies, Insights, Outlook, Restraints, segmentation, Revenue, Strategy
- Pakistan Polyhydroxybutyrate-co-Hydroxyvalerate Market (2026-2032) | Restraints, segmentation, Pricing, Forecast, Share, Strategy, Competition, Trends, Insights, Drivers, Challenges, Growth, Revenue, Outlook, Value, Investment Opportunities, Companies, Size, Analysis, Demand
- Oman Polyhydroxybutyrate-co-Hydroxyvalerate Market (2026-2032) | Drivers, segmentation, Insights, Competition, Pricing, Outlook, Size, Revenue, Challenges, Forecast, Analysis, Growth, Value, Share, Trends, Investment Opportunities, Strategy, Restraints, Companies, Demand
- Nigeria Polyhydroxybutyrate-co-Hydroxyvalerate Market (2026-2032) | Value, Investment Opportunities, Analysis, Revenue, Restraints, Pricing, Outlook, Competition, Demand, Growth, Forecast, Companies, Trends, Challenges, segmentation, Drivers, Insights, Share, Size, Strategy
- Nepal Polyhydroxybutyrate-co-Hydroxyvalerate Market (2026-2032) | Insights, Analysis, Drivers, Share, Revenue, Demand, segmentation, Investment Opportunities, Competition, Forecast, Growth, Pricing, Companies, Strategy, Trends, Restraints, Challenges, Outlook, Size, Value
- Myanmar Polyhydroxybutyrate-co-Hydroxyvalerate Market (2026-2032) | Outlook, Revenue, Strategy, Restraints, Drivers, segmentation, Share, Forecast, Competition, Insights, Growth, Pricing, Size, Demand, Value, Companies, Trends, Challenges, Investment Opportunities, Analysis
- Morocco Polyhydroxybutyrate-co-Hydroxyvalerate Market (2026-2032) | Outlook, Investment Opportunities, Restraints, Strategy, Forecast, Challenges, Drivers, Growth, Companies, segmentation, Trends, Size, Competition, Revenue, Demand, Insights, Share, Analysis, Value, Pricing
- Mexico Polyhydroxybutyrate-co-Hydroxyvalerate Market (2026-2032) | Size, Drivers, Outlook, Share, Strategy, Growth, Pricing, Challenges, Companies, Demand, Value, Investment Opportunities, Restraints, Trends, Forecast, segmentation, Analysis, Insights, Competition, Revenue
- Malaysia Polyhydroxybutyrate-co-Hydroxyvalerate Market (2026-2032) | Share, segmentation, Size, Companies, Analysis, Insights, Forecast, Value, Revenue, Drivers, Restraints, Challenges, Investment Opportunities, Trends, Competition, Strategy, Demand, Growth, Outlook, Pricing
Industry Events and Analyst Meet

HIMTEX 2026

India Refining Summit 2026

India EV Show 2026

EV tech India Expo 2026

Auto Tech Asia 2026
Whitepaper
- Middle East & Africa Commercial Security Market Click here to view more.
- Middle East & Africa Fire Safety Systems & Equipment Market Click here to view more.
- GCC Drone Market Click here to view more.
- Middle East Lighting Fixture Market Click here to view more.
- GCC Physical & Perimeter Security Market Click here to view more.
6WResearch In News
- Doha a strategic location for EV manufacturing hub: IPA Qatar
- Demand for luxury TVs surging in the GCC, says Samsung
- Empowering Growth: The Thriving Journey of Bangladesh’s Cable Industry
- Demand for luxury TVs surging in the GCC, says Samsung
- Video call with a traditional healer? Once unthinkable, it’s now common in South Africa
- Intelligent Buildings To Smooth GCC’s Path To Net Zero