Croatia Gaming Console Market (2026-2032) | Revenue, Size, Outlook, Trends, Growth, Companies, Forecast, Share, Value, Segmentation, Analysis & Industry
Market Forecast By Component (Hardware, Software), By Type (Home Consoles, Handheld Consoles, Hybrid Consoles, Dedicated Consoles, Others), By End-use (Personal, Commercial, Others) And Competitive Landscape
| Product Code: ETC4805312 | Publication Date: Nov 2023 | Updated Date: Apr 2026 | Product Type: Market Research Report | |
| Publisher: 6Wresearch | Author: Shubham Padhi | No. of Pages: 60 | No. of Figures: 30 | No. of Tables: 5 |
Croatia Gaming Console Market Size (2020-2030)
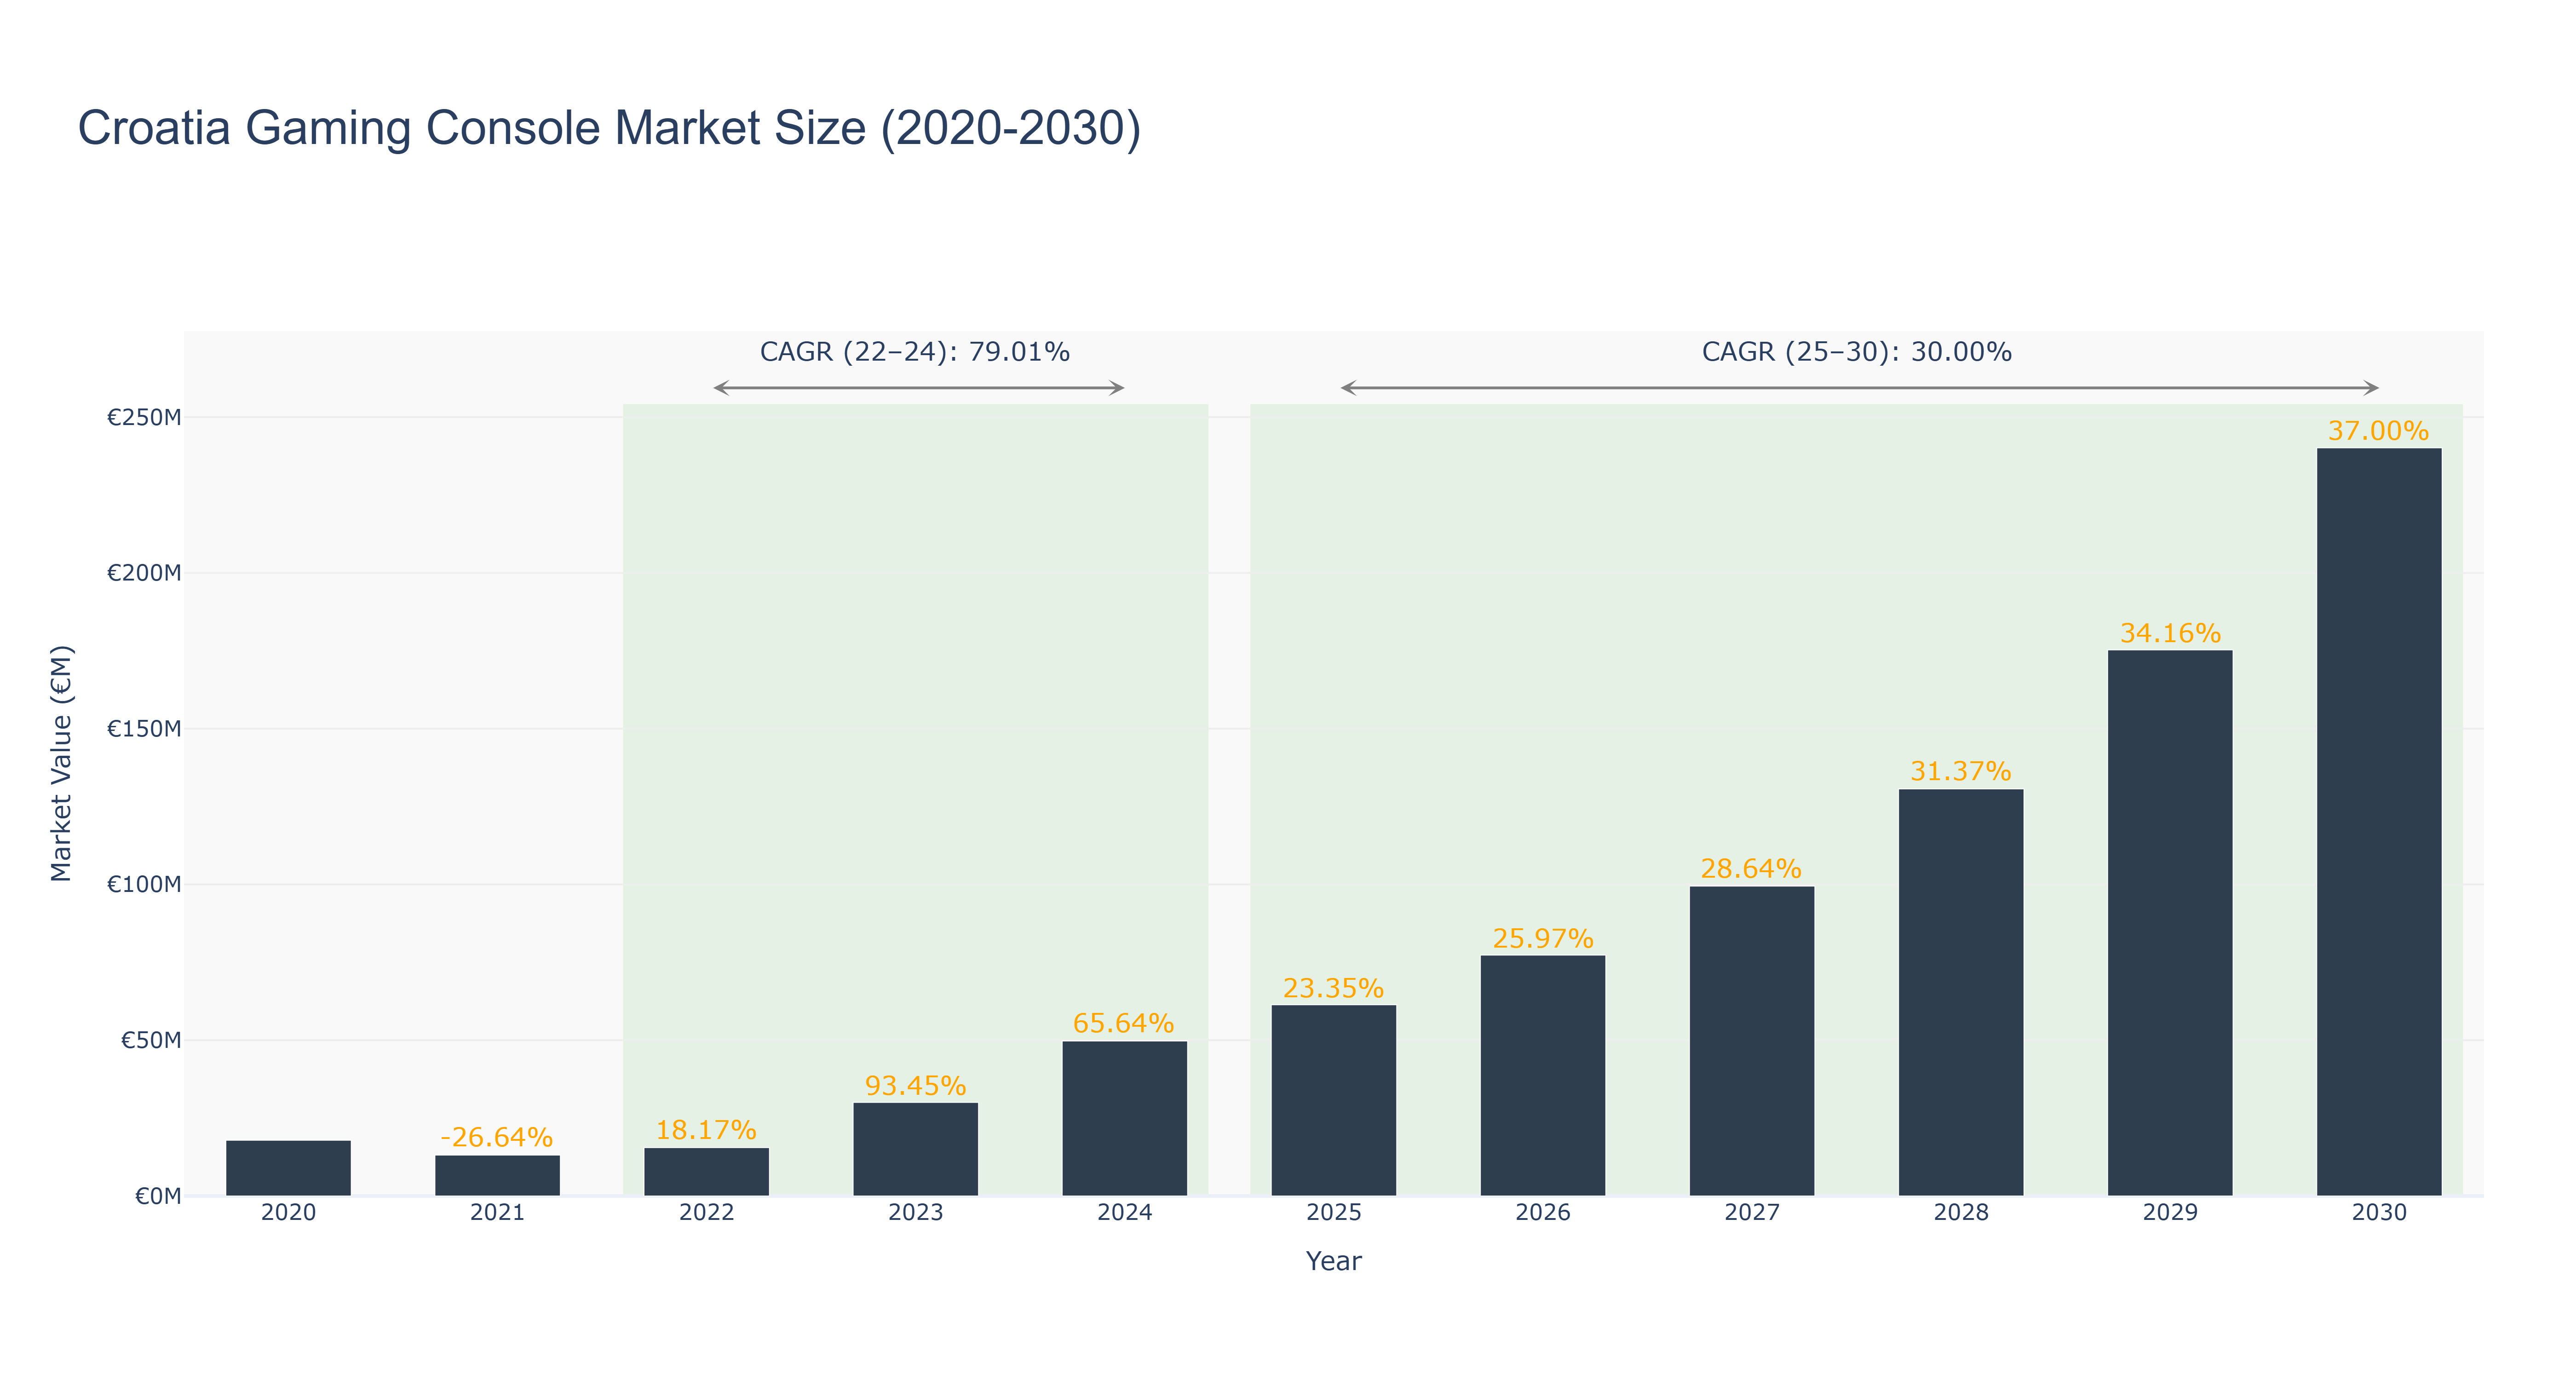
The Croatia Gaming Console Market has displayed significant volatility in recent years, peaking at €30.04 million in 2023, reflecting an impressive growth of 93.45% from the previous year. The actual data from 2022 to 2024 indicates a robust CAGR of 79.01%, driven by increased consumer demand for gaming experiences and the proliferation of next-generation consoles. Following this surge, the market is projected to continue its upward trajectory from 2025 to 2030, with forecasted growth rates averaging 30.00% and a market size expected to reach €240.15 million by 2030. Key industry drivers include technological advancements, expanded online gaming communities, and the introduction of exclusive game titles. The ongoing investment in gaming infrastructure and digital platforms will further enhance market potential, positioning Croatia as a burgeoning hub for gaming enthusiasts in the region.
Croatia Gaming Console Market: Production & Trade Performance (2019-2025)
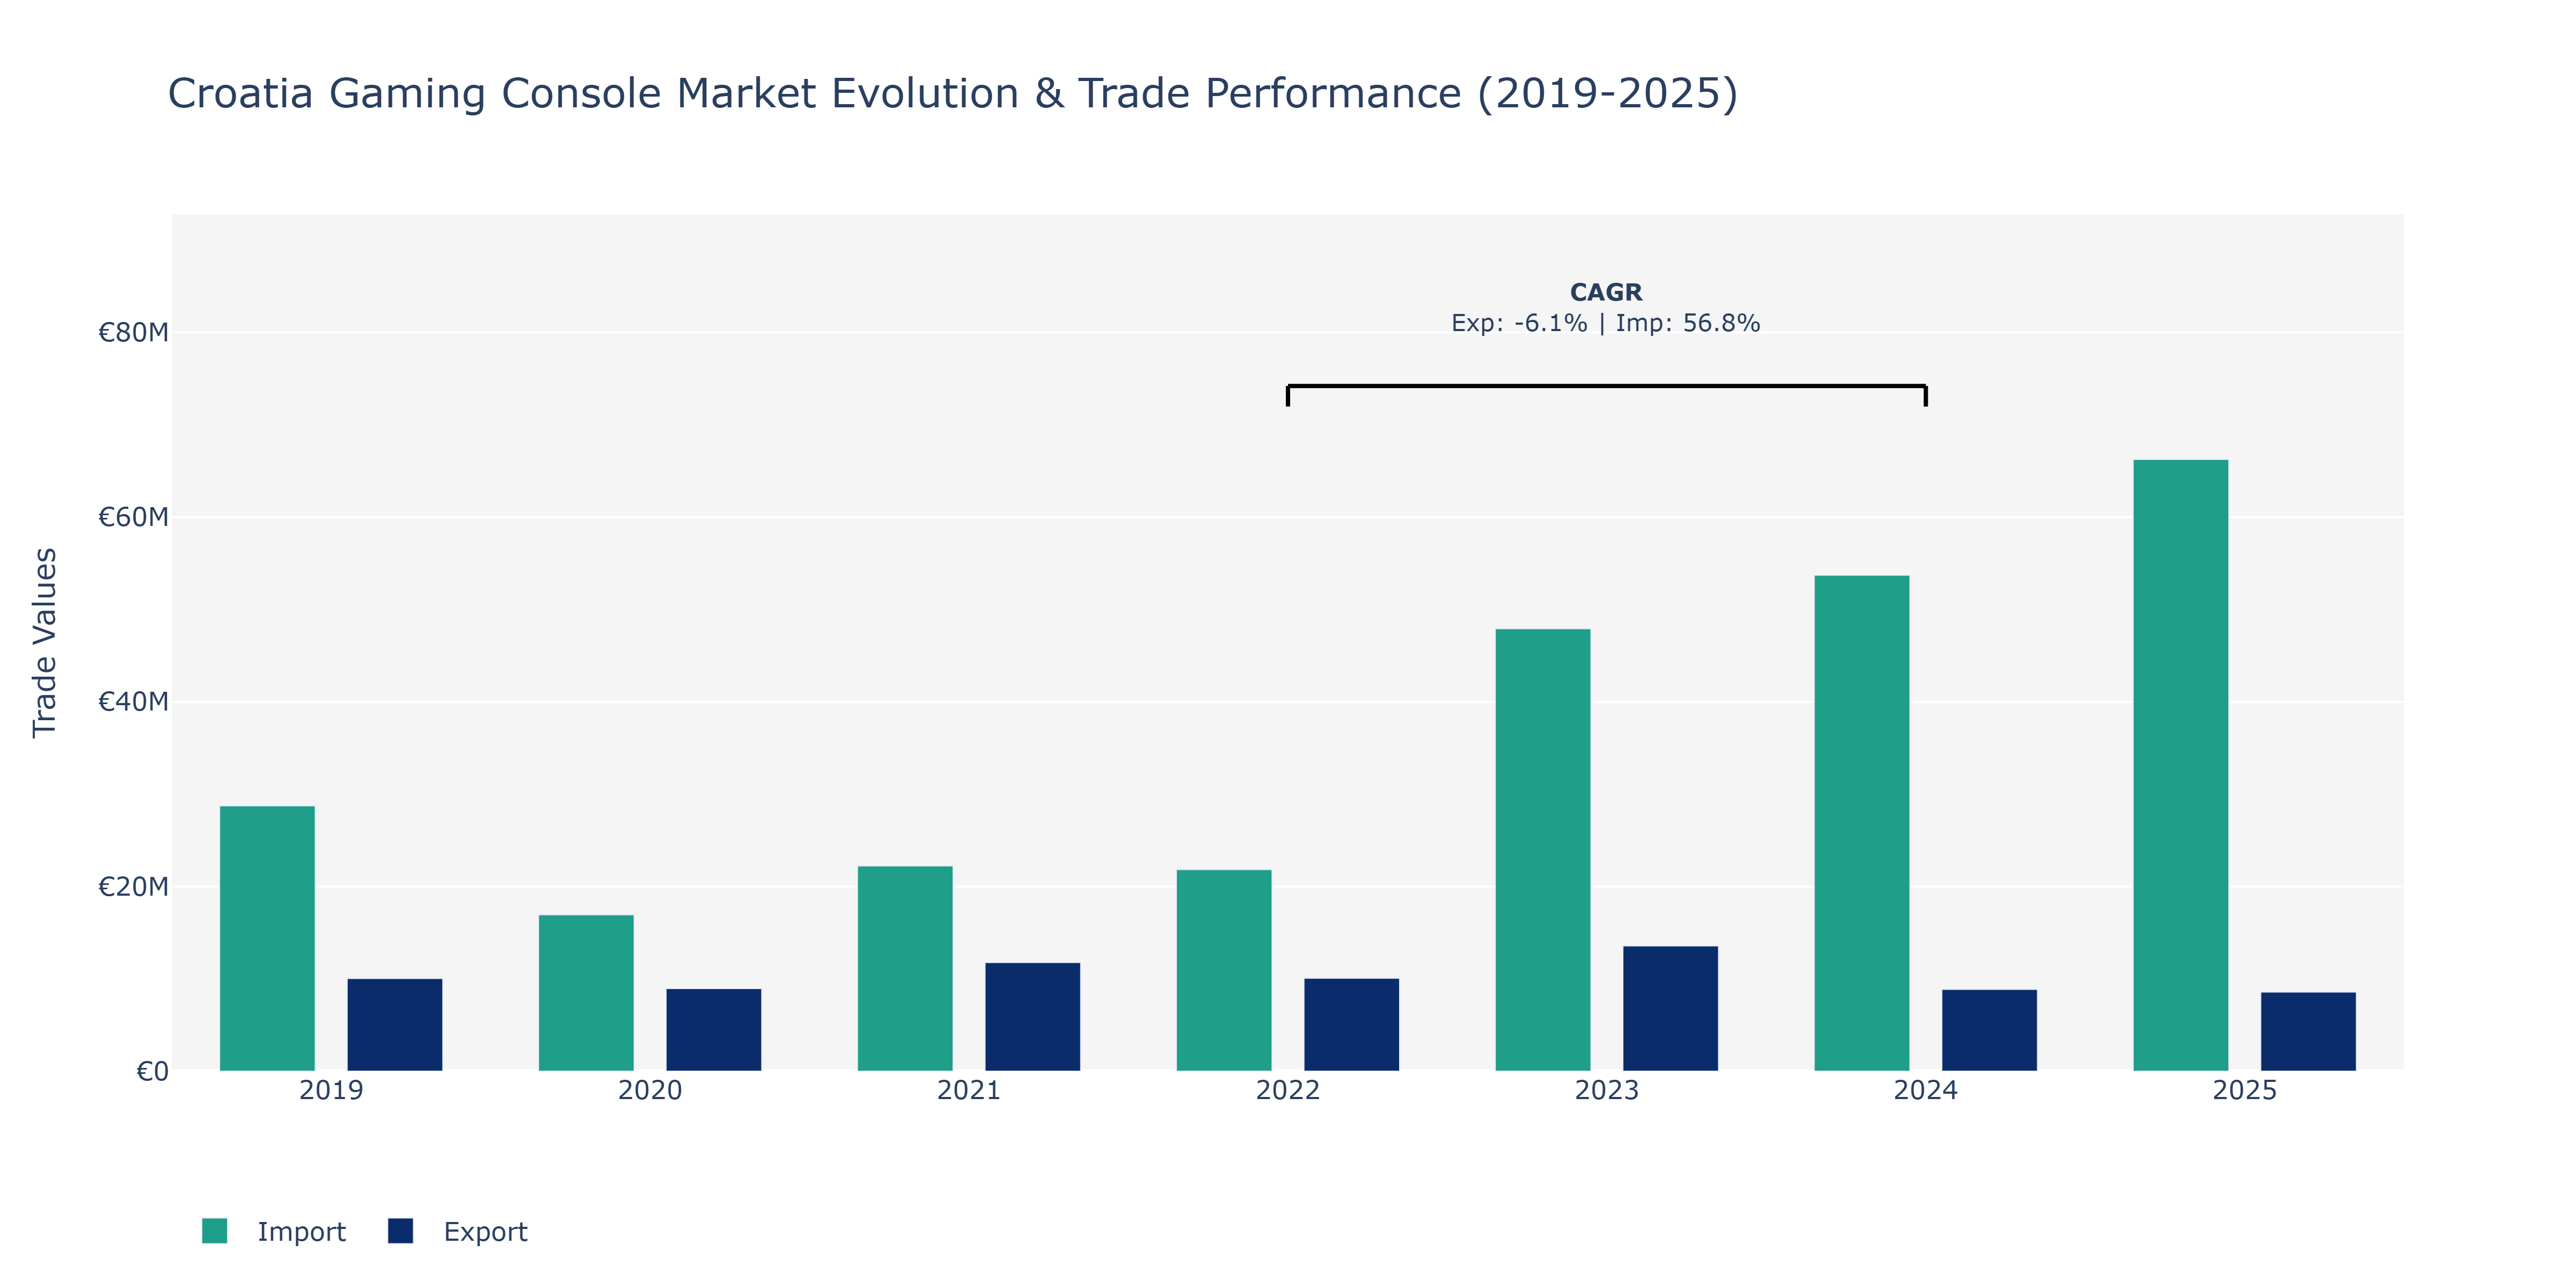
In the Croatia Gaming Console Market, exports exhibited fluctuations over the years, starting at €10.04 million in 2019, dipping to €8.95 million in 2020, and experiencing a significant surge to €13.57 million in 2023 before declining to €8.57 million in 2025. Imports, on the other hand, followed a similar pattern, beginning at €28.74 million in 2019, dropping to €16.93 million in 2020, hitting a peak of €66.25 million in 2025. The sharp increase in imports from 2023 to 2025 can be attributed to the growing demand for gaming consoles, possibly due to the release of new gaming technologies and a shift towards more immersive gaming experiences. The fluctuations in exports could be influenced by changes in production capacities, market demand, and competitive pressures from other market players. The contrasting trends between exports and imports could indicate evolving dynamics in the Croatian gaming console industry, reflecting both domestic consumption patterns and international trade dynamics.
Key Highlights of the Report:
- Croatia Gaming Console Market Outlook
- Market Size of Croatia Gaming Console Market, 2025
- Forecast of Croatia Gaming Console Market, 2032
- Historical Data and Forecast of Croatia Gaming Console Revenues & Volume for the Period 2022 - 2032F
- Croatia Gaming Console Market Trend Evolution
- Croatia Gaming Console Market Drivers and Challenges
- Croatia Gaming Console Price Trends
- Croatia Gaming Console Porter`s Five Forces
- Croatia Gaming Console Industry Life Cycle
- Historical Data and Forecast of Croatia Gaming Console Market Revenues & Volume By Component for the Period 2022 - 2032F
- Historical Data and Forecast of Croatia Gaming Console Market Revenues & Volume By Hardware for the Period 2022 - 2032F
- Historical Data and Forecast of Croatia Gaming Console Market Revenues & Volume By Software for the Period 2022 - 2032F
- Historical Data and Forecast of Croatia Gaming Console Market Revenues & Volume By Type for the Period 2022 - 2032F
- Historical Data and Forecast of Croatia Gaming Console Market Revenues & Volume By Home Consoles for the Period 2022 - 2032F
- Historical Data and Forecast of Croatia Gaming Console Market Revenues & Volume By Handheld Consoles for the Period 2022 - 2032F
- Historical Data and Forecast of Croatia Gaming Console Market Revenues & Volume By Hybrid Consoles for the Period 2022 - 2032F
- Historical Data and Forecast of Croatia Gaming Console Market Revenues & Volume By Dedicated Consoles for the Period 2022 - 2032F
- Historical Data and Forecast of Croatia Gaming Console Market Revenues & Volume By Others for the Period 2022 - 2032F
- Historical Data and Forecast of Croatia Gaming Console Market Revenues & Volume By End-use for the Period 2022 - 2032F
- Historical Data and Forecast of Croatia Gaming Console Market Revenues & Volume By Personal for the Period 2022 - 2032F
- Historical Data and Forecast of Croatia Gaming Console Market Revenues & Volume By Commercial for the Period 2022 - 2032F
- Historical Data and Forecast of Croatia Gaming Console Market Revenues & Volume By Others for the Period 2022 - 2032F
- Croatia Gaming Console Import Export Trade Statistics
- Market Opportunity Assessment By Component
- Market Opportunity Assessment By Type
- Market Opportunity Assessment By End-use
- Croatia Gaming Console Top Companies Market Share
- Croatia Gaming Console Competitive Benchmarking By Technical and Operational Parameters
- Croatia Gaming Console Company Profiles
- Croatia Gaming Console Key Strategic Recommendations
Frequently Asked Questions About the Market Study (FAQs):
6Wresearch actively monitors the Croatia Gaming Console Market and publishes its comprehensive annual report, highlighting emerging trends, growth drivers, revenue analysis, and forecast outlook. Our insights help businesses to make data-backed strategic decisions with ongoing market dynamics. Our analysts track relevent industries related to the Croatia Gaming Console Market, allowing our clients with actionable intelligence and reliable forecasts tailored to emerging regional needs.
Yes, we provide customisation as per your requirements. To learn more, feel free to contact us on sales@6wresearch.com
1 Executive Summary |
2 Introduction |
2.1 Key Highlights of the Report |
2.2 Report Description |
2.3 Market Scope & Segmentation |
2.4 Research Methodology |
2.5 Assumptions |
3 Croatia Gaming Console Market Overview |
3.1 Croatia Country Macro Economic Indicators |
3.2 Croatia Gaming Console Market Revenues & Volume, 2022 & 2032F |
3.3 Croatia Gaming Console Market - Industry Life Cycle |
3.4 Croatia Gaming Console Market - Porter's Five Forces |
3.5 Croatia Gaming Console Market Revenues & Volume Share, By Component, 2022 & 2032F |
3.6 Croatia Gaming Console Market Revenues & Volume Share, By Type, 2022 & 2032F |
3.7 Croatia Gaming Console Market Revenues & Volume Share, By End-use, 2022 & 2032F |
4 Croatia Gaming Console Market Dynamics |
4.1 Impact Analysis |
4.2 Market Drivers |
4.2.1 Increasing disposable income of consumers in Croatia |
4.2.2 Growing interest in gaming and eSports in the region |
4.2.3 Technological advancements in gaming consoles and related accessories |
4.3 Market Restraints |
4.3.1 High cost of gaming consoles and accessories |
4.3.2 Limited availability of popular gaming titles in Croatian language |
5 Croatia Gaming Console Market Trends |
6 Croatia Gaming Console Market Segmentations |
6.1 Croatia Gaming Console Market, By Component |
6.1.1 Overview and Analysis |
6.1.2 Croatia Gaming Console Market Revenues & Volume, By Hardware, 2022 - 2032F |
6.1.3 Croatia Gaming Console Market Revenues & Volume, By Software, 2022 - 2032F |
6.2 Croatia Gaming Console Market, By Type |
6.2.1 Overview and Analysis |
6.2.2 Croatia Gaming Console Market Revenues & Volume, By Home Consoles, 2022 - 2032F |
6.2.3 Croatia Gaming Console Market Revenues & Volume, By Handheld Consoles, 2022 - 2032F |
6.2.4 Croatia Gaming Console Market Revenues & Volume, By Hybrid Consoles, 2022 - 2032F |
6.2.5 Croatia Gaming Console Market Revenues & Volume, By Dedicated Consoles, 2022 - 2032F |
6.2.6 Croatia Gaming Console Market Revenues & Volume, By Others, 2022 - 2032F |
6.3 Croatia Gaming Console Market, By End-use |
6.3.1 Overview and Analysis |
6.3.2 Croatia Gaming Console Market Revenues & Volume, By Personal, 2022 - 2032F |
6.3.3 Croatia Gaming Console Market Revenues & Volume, By Commercial, 2022 - 2032F |
6.3.4 Croatia Gaming Console Market Revenues & Volume, By Others, 2022 - 2032F |
7 Croatia Gaming Console Market Import-Export Trade Statistics |
7.1 Croatia Gaming Console Market Export to Major Countries |
7.2 Croatia Gaming Console Market Imports from Major Countries |
8 Croatia Gaming Console Market Key Performance Indicators |
8.1 Number of gaming events and tournaments hosted in Croatia |
8.2 Percentage of households with at least one gaming console |
8.3 Average time spent on gaming per user in Croatia |
9 Croatia Gaming Console Market - Opportunity Assessment |
9.1 Croatia Gaming Console Market Opportunity Assessment, By Component, 2022 & 2032F |
9.2 Croatia Gaming Console Market Opportunity Assessment, By Type, 2022 & 2032F |
9.3 Croatia Gaming Console Market Opportunity Assessment, By End-use, 2022 & 2032F |
10 Croatia Gaming Console Market - Competitive Landscape |
10.1 Croatia Gaming Console Market Revenue Share, By Companies, 2025 |
10.2 Croatia Gaming Console Market Competitive Benchmarking, By Operating and Technical Parameters |
11 Company Profiles |
12 Recommendations | 13 Disclaimer |
Global Go To Market Strategy - 2030
Export potential enables firms to identify high-growth global markets with greater confidence by combining advanced trade intelligence with a structured quantitative methodology. The framework analyzes emerging demand trends and country-level import patterns while integrating macroeconomic and trade datasets such as GDP and population forecasts, bilateral import–export flows, tariff structures, elasticity differentials between developed and developing economies, geographic distance, and import demand projections. Using weighted trade values from 2020–2024 as the base period to project country-to-country export potential for 2030, these inputs are operationalized through calculated drivers such as gravity model parameters, tariff impact factors, and projected GDP per-capita growth. Through an analysis of hidden potentials, demand hotspots, and market conditions that are most favorable to success, this method enables firms to focus on target countries, maximize returns, and global expansion with data, backed by accuracy.
By factoring in the projected importer demand gap that is currently unmet and could be potential opportunity, it identifies the potential for the Exporter (Country) among 190 countries, against the general trade analysis, which identifies the biggest importer or exporter.
To discover high-growth global markets and optimize your business strategy:
Click Here
Pricing
- Single User License$ 1,995
- Department License$ 2,400
- Site License$ 3,120
- Global License$ 3,795

Leadership Perspectives from Industry Events
Search
Thought Leadership and Analyst Meet


Our Clients
6WResearch In News
- India Air Conditioner Market Set for Strong Rebound in 2026 After Weather-Led Correction and GST-Driven Recovery: 6Wresearch
- ADAS in India: How Automatic Emergency Braking, Blind Spot Detection & Driver Monitoring are Transforming Road Safety
- Doha a strategic location for EV manufacturing hub: IPA Qatar
- Demand for luxury TVs surging in the GCC, says Samsung
- Empowering Growth: The Thriving Journey of Bangladesh’s Cable Industry
- Demand for luxury TVs surging in the GCC, says Samsung
Latest Reports
- Poland Fire Protection Systems Market (2026-2032)
- Cape Verde Portable Hand-Thrown Extinguisher Market (2026-2032)
- Canada Portable Hand-Thrown Extinguisher Market (2026-2032)
- Cameroon Portable Hand-Thrown Extinguisher Market (2026-2032)
- Burundi Portable Hand-Thrown Extinguisher Market (2026-2032)
- Burkina Faso Portable Hand-Thrown Extinguisher Market (2026-2032)
- Bulgaria Portable Hand-Thrown Extinguisher Market (2026-2032)
- Brunei Portable Hand-Thrown Extinguisher Market (2026-2032)
- Botswana Portable Hand-Thrown Extinguisher Market (2026-2032)
- Bosnia and Herzegovina Portable Hand-Thrown Extinguisher Market (2026-2032)
Industry Events and Analyst Meet

HIMTEX 2026

India Refining Summit 2026

India EV Show 2026

EV tech India Expo 2026

Auto Tech Asia 2026
Whitepaper
- Middle East & Africa Commercial Security Market Click here to view more.
- Middle East & Africa Fire Safety Systems & Equipment Market Click here to view more.
- GCC Drone Market Click here to view more.
- Middle East Lighting Fixture Market Click here to view more.
- GCC Physical & Perimeter Security Market Click here to view more.