Croatia Gin Market (2025-2031) | Revenue, Companies, Size, Value, Growth, Outlook, Industry, Forecast, Analysis, Segmentation, Trends & Share
Market Forecast By Product Type (London Dry Gin, Plymouth Gin, Genever/Dutch Gin, Old Tim Gin, New American Gin), By Production Method (Pot Distilled Gin, Column Distilled Gin, Compound Gin), By Distribution Channel (Hypermarkets and Supermarkets, Specialty Stores, Drug Stores, Online Channel, HoReCa, Others) And Competitive Landscape
| Product Code: ETC4673243 | Publication Date: Nov 2023 | Updated Date: Oct 2025 | Product Type: Market Research Report | |
| Publisher: 6Wresearch | Author: Shubham Deep | No. of Pages: 60 | No. of Figures: 30 | No. of Tables: 5 |
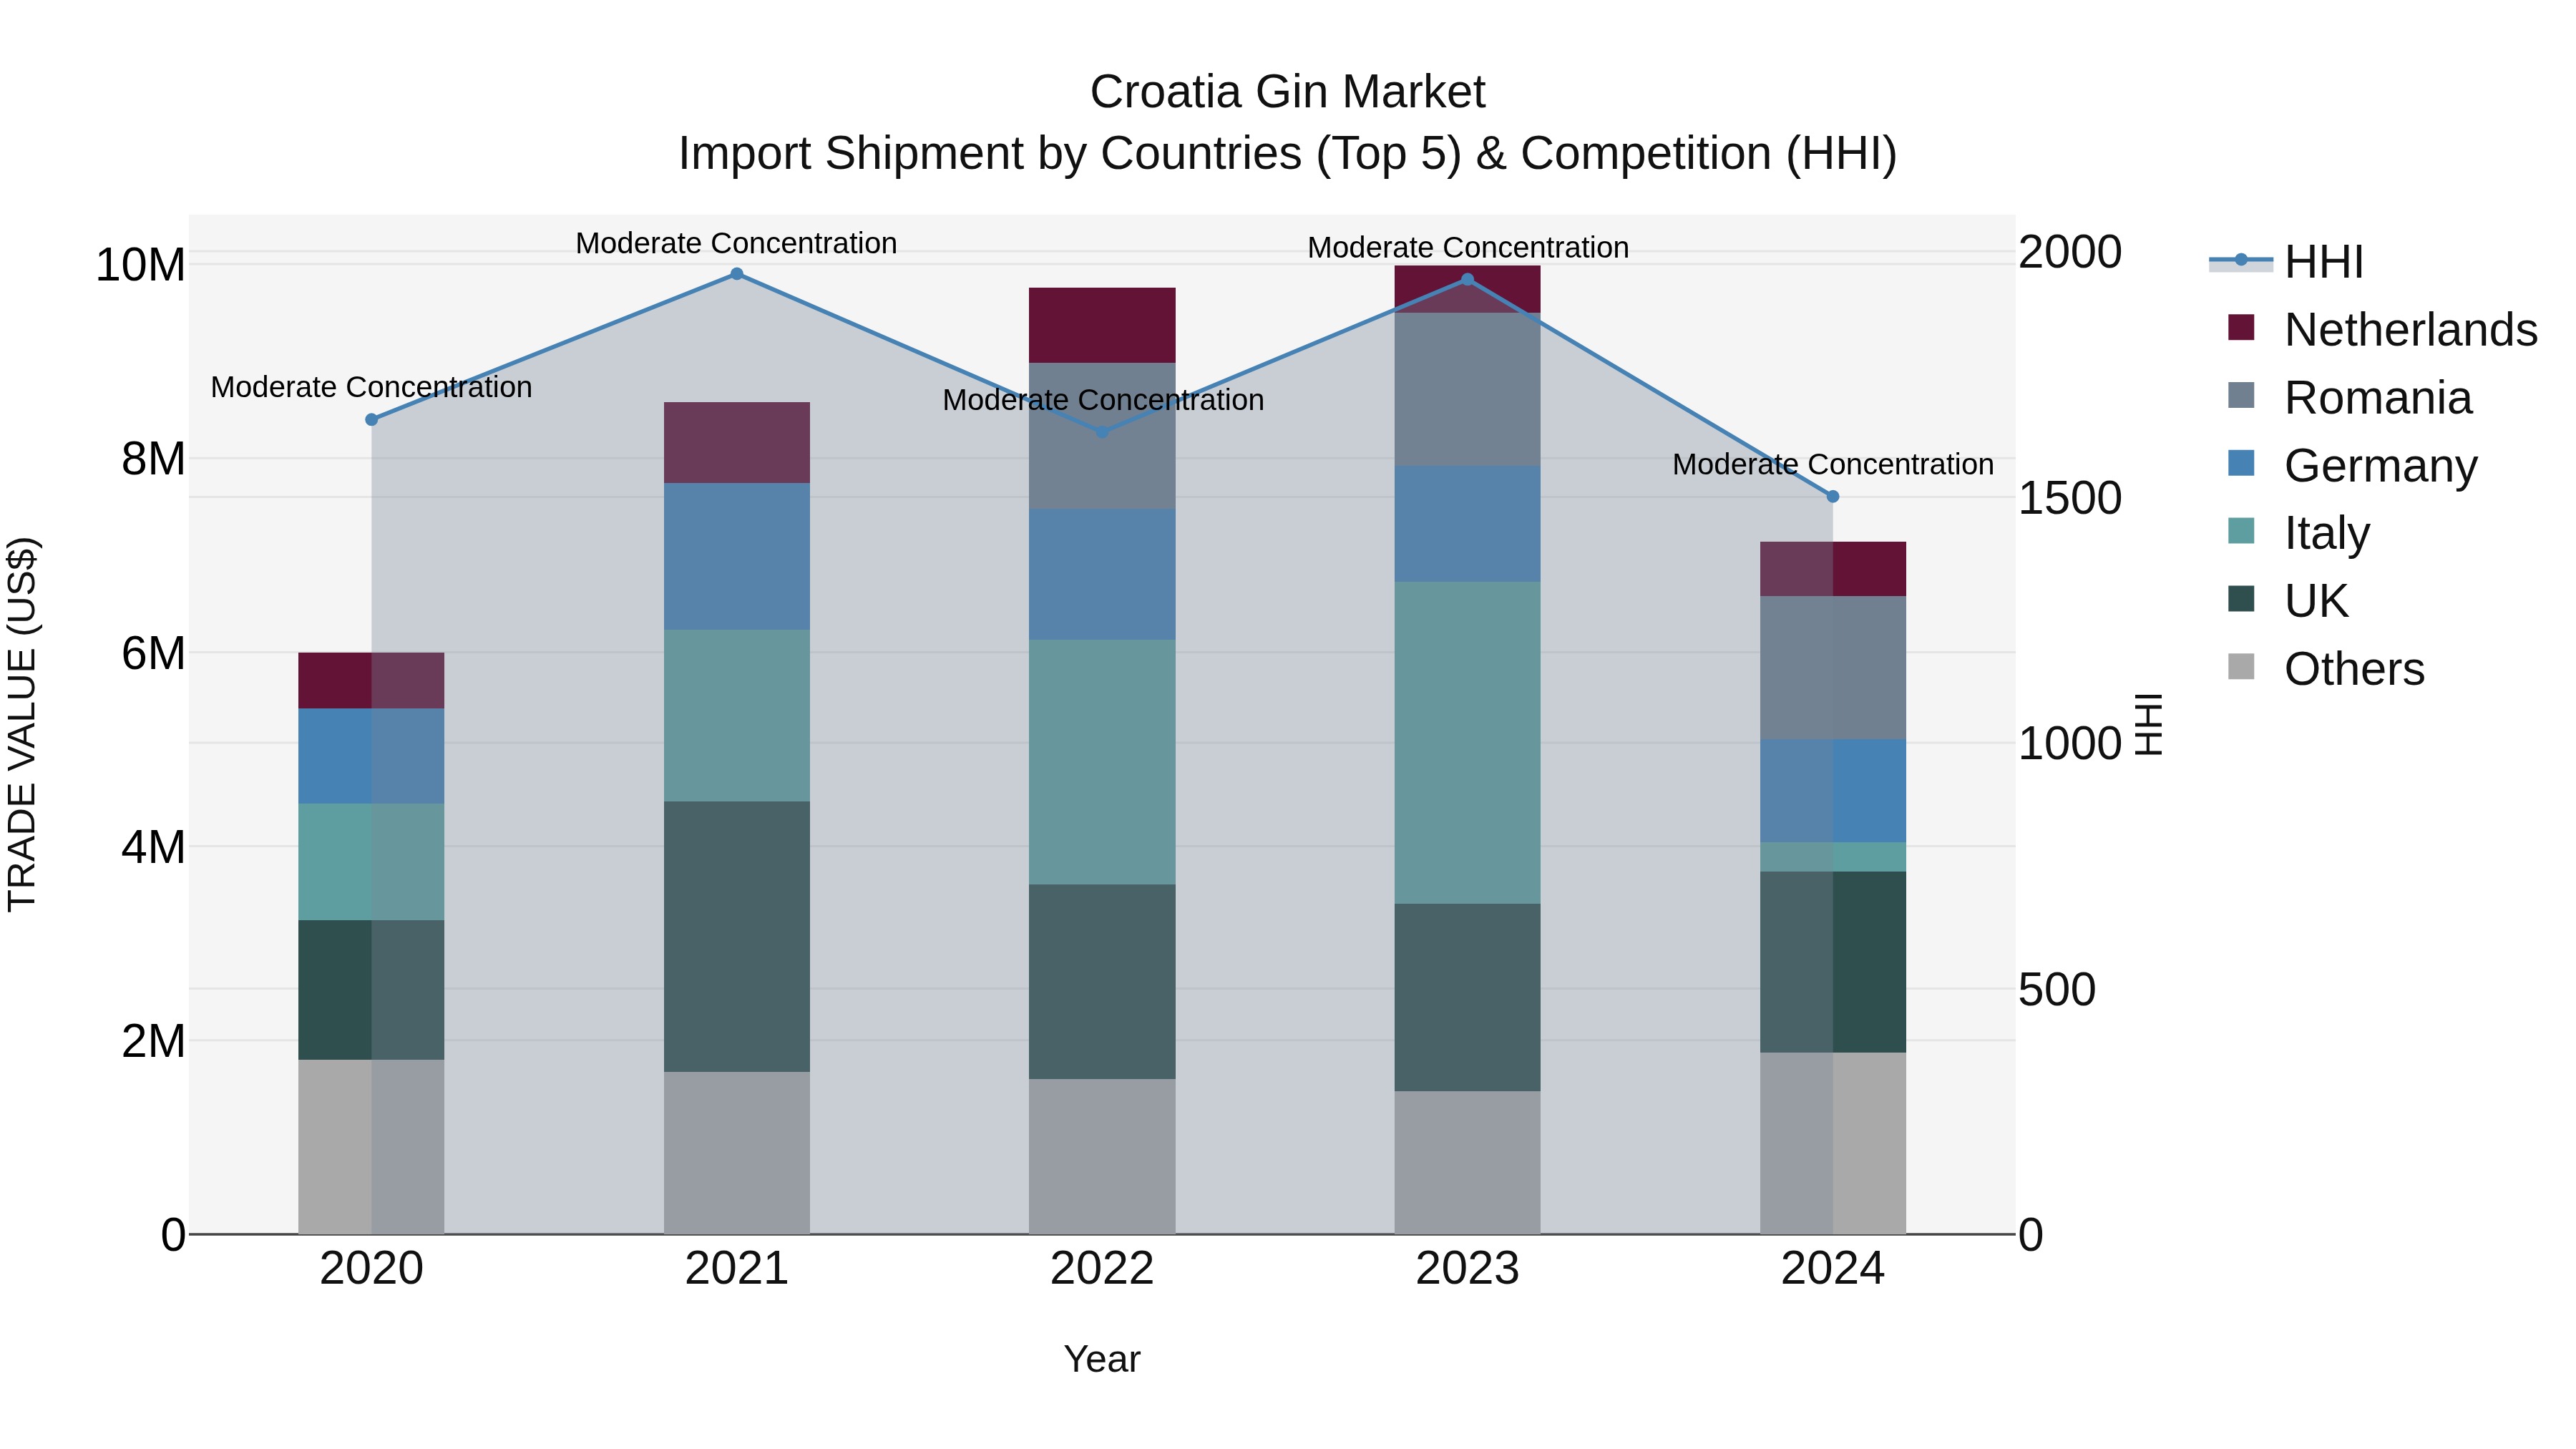
Croatia Gin Market Top 5 Importing Countries and Market Competition (HHI) Analysis
Croatia gin import market saw a diverse range of sources in 2024, with the UK, Romania, Germany, Netherlands, and Spain leading the way. Despite moderate concentration levels, the market experienced steady growth with a 4.44% CAGR from 2020 to 2024. However, there was a notable decline in growth rate from 2023 to 2024 at -28.53%, indicating a potential shift or temporary setback in the market dynamics. Monitoring these trends closely will be crucial for stakeholders in the Croatian gin import industry.
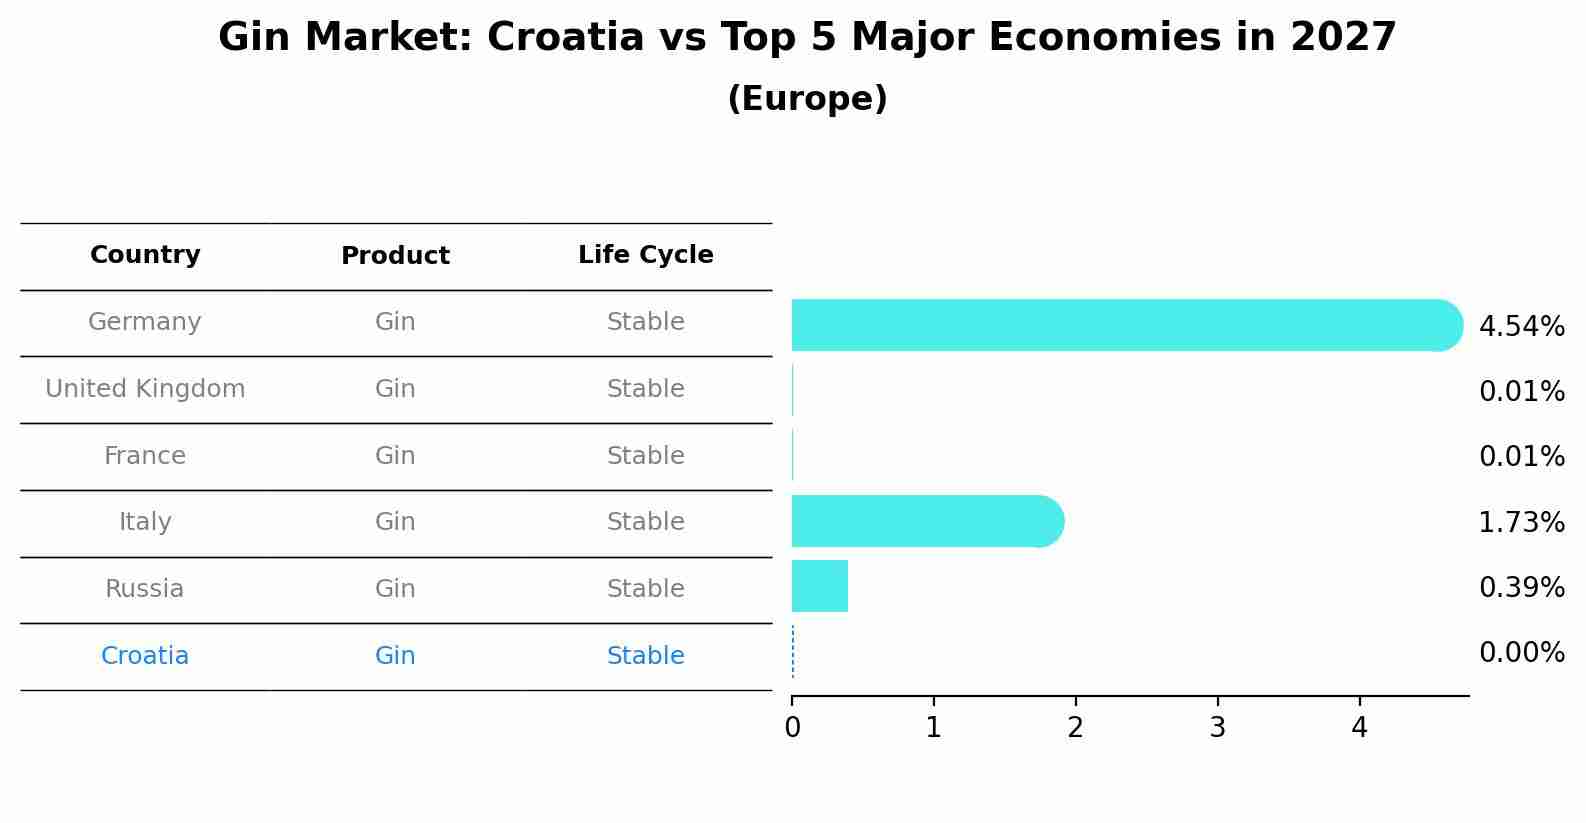
Gin Market: Croatia vs Top 5 Major Economies in 2027 (Europe)
The Gin market in Croatia is projected to grow at a stable growth rate of 0.00% by 2027, within the Europe region led by Germany, along with other countries like United Kingdom, France, Italy and Russia, collectively shaping a dynamic and evolving market environment driven by innovation and increasing adoption of emerging technologies.
Croatia Gin Market Overview
The gin market in Croatia has experienced a significant rise in popularity, driven by changing consumer preferences and the global craft spirits movement. Local gin producers, along with international brands, are contributing to the expanding variety available in the market. Gin consumption is becoming increasingly popular in Croatia`s urban centers, particularly among younger demographics.
Drivers of the market
The Croatia gin market is experiencing growth due to the rising popularity of craft spirits and premium alcoholic beverages. The increasing trend of cocktail culture, combined with consumer preference for locally produced and artisanal gins, is driving demand. Additionally, innovative flavors and distillation techniques are further attracting consumers to the gin market.
Challenges of the market
The Croatia gin market faces challenges from intense competition, both from local craft distilleries and established international brands. Additionally, changing consumer preferences toward low-alcohol and non-alcoholic beverages are impacting gin consumption. The market is also challenged by fluctuating raw material costs, particularly botanicals used in gin production.
Government Policy of the market
The Croatian government has been encouraging the growth of the local gin industry by providing subsidies and tax incentives to local distillers. Policies promoting the tourism industry, particularly gastro-tourism, have also played a role in boosting the gin market as Croatian gin brands become a part of the countrys culinary appeal. Furthermore, government regulations ensure high-quality production standards for alcoholic beverages, aligning with broader EU directives.
Key Highlights of the Report:
- Croatia Gin Market Outlook
- Market Size of Croatia Gin Market, 2024
- Forecast of Croatia Gin Market, 2031
- Historical Data and Forecast of Croatia Gin Revenues & Volume for the Period 2021-2031
- Croatia Gin Market Trend Evolution
- Croatia Gin Market Drivers and Challenges
- Croatia Gin Price Trends
- Croatia Gin Porter`s Five Forces
- Croatia Gin Industry Life Cycle
- Historical Data and Forecast of Croatia Gin Market Revenues & Volume By Product Type for the Period 2021-2031
- Historical Data and Forecast of Croatia Gin Market Revenues & Volume By London Dry Gin for the Period 2021-2031
- Historical Data and Forecast of Croatia Gin Market Revenues & Volume By Plymouth Gin for the Period 2021-2031
- Historical Data and Forecast of Croatia Gin Market Revenues & Volume By Genever/Dutch Gin for the Period 2021-2031
- Historical Data and Forecast of Croatia Gin Market Revenues & Volume By Old Tim Gin for the Period 2021-2031
- Historical Data and Forecast of Croatia Gin Market Revenues & Volume By New American Gin for the Period 2021-2031
- Historical Data and Forecast of Croatia Gin Market Revenues & Volume By Production Method for the Period 2021-2031
- Historical Data and Forecast of Croatia Gin Market Revenues & Volume By Pot Distilled Gin for the Period 2021-2031
- Historical Data and Forecast of Croatia Gin Market Revenues & Volume By Column Distilled Gin for the Period 2021-2031
- Historical Data and Forecast of Croatia Gin Market Revenues & Volume By Compound Gin for the Period 2021-2031
- Historical Data and Forecast of Croatia Gin Market Revenues & Volume By Distribution Channel for the Period 2021-2031
- Historical Data and Forecast of Croatia Gin Market Revenues & Volume By Hypermarkets and Supermarkets for the Period 2021-2031
- Historical Data and Forecast of Croatia Gin Market Revenues & Volume By Specialty Stores for the Period 2021-2031
- Historical Data and Forecast of Croatia Gin Market Revenues & Volume By Drug Stores for the Period 2021-2031
- Historical Data and Forecast of Croatia Gin Market Revenues & Volume By Online Channel for the Period 2021-2031
- Historical Data and Forecast of Croatia Gin Market Revenues & Volume By HoReCa for the Period 2021-2031
- Historical Data and Forecast of Croatia Gin Market Revenues & Volume By Others for the Period 2021-2031
- Croatia Gin Import Export Trade Statistics
- Market Opportunity Assessment By Product Type
- Market Opportunity Assessment By Production Method
- Market Opportunity Assessment By Distribution Channel
- Croatia Gin Top Companies Market Share
- Croatia Gin Competitive Benchmarking By Technical and Operational Parameters
- Croatia Gin Company Profiles
- Croatia Gin Key Strategic Recommendations
Frequently Asked Questions About the Market Study (FAQs):
6Wresearch actively monitors the Croatia Gin Market and publishes its comprehensive annual report, highlighting emerging trends, growth drivers, revenue analysis, and forecast outlook. Our insights help businesses to make data-backed strategic decisions with ongoing market dynamics. Our analysts track relevent industries related to the Croatia Gin Market, allowing our clients with actionable intelligence and reliable forecasts tailored to emerging regional needs.
Yes, we provide customisation as per your requirements. To learn more, feel free to contact us on sales@6wresearch.com
1 Executive Summary |
2 Introduction |
2.1 Key Highlights of the Report |
2.2 Report Description |
2.3 Market Scope & Segmentation |
2.4 Research Methodology |
2.5 Assumptions |
3 Croatia Gin Market Overview |
3.1 Croatia Country Macro Economic Indicators |
3.2 Croatia Gin Market Revenues & Volume, 2021 & 2031F |
3.3 Croatia Gin Market - Industry Life Cycle |
3.4 Croatia Gin Market - Porter's Five Forces |
3.5 Croatia Gin Market Revenues & Volume Share, By Product Type, 2021 & 2031F |
3.6 Croatia Gin Market Revenues & Volume Share, By Production Method, 2021 & 2031F |
3.7 Croatia Gin Market Revenues & Volume Share, By Distribution Channel, 2021 & 2031F |
4 Croatia Gin Market Dynamics |
4.1 Impact Analysis |
4.2 Market Drivers |
4.3 Market Restraints |
5 Croatia Gin Market Trends |
6 Croatia Gin Market Segmentations |
6.1 Croatia Gin Market, By Product Type |
6.1.1 Overview and Analysis |
6.1.2 Croatia Gin Market Revenues & Volume, By London Dry Gin, 2021-2031F |
6.1.3 Croatia Gin Market Revenues & Volume, By Plymouth Gin, 2021-2031F |
6.1.4 Croatia Gin Market Revenues & Volume, By Genever/Dutch Gin, 2021-2031F |
6.1.5 Croatia Gin Market Revenues & Volume, By Old Tim Gin, 2021-2031F |
6.1.6 Croatia Gin Market Revenues & Volume, By New American Gin, 2021-2031F |
6.2 Croatia Gin Market, By Production Method |
6.2.1 Overview and Analysis |
6.2.2 Croatia Gin Market Revenues & Volume, By Pot Distilled Gin, 2021-2031F |
6.2.3 Croatia Gin Market Revenues & Volume, By Column Distilled Gin, 2021-2031F |
6.2.4 Croatia Gin Market Revenues & Volume, By Compound Gin, 2021-2031F |
6.3 Croatia Gin Market, By Distribution Channel |
6.3.1 Overview and Analysis |
6.3.2 Croatia Gin Market Revenues & Volume, By Hypermarkets and Supermarkets, 2021-2031F |
6.3.3 Croatia Gin Market Revenues & Volume, By Specialty Stores, 2021-2031F |
6.3.4 Croatia Gin Market Revenues & Volume, By Drug Stores, 2021-2031F |
6.3.5 Croatia Gin Market Revenues & Volume, By Online Channel, 2021-2031F |
6.3.6 Croatia Gin Market Revenues & Volume, By HoReCa, 2021-2031F |
6.3.7 Croatia Gin Market Revenues & Volume, By Others, 2021-2031F |
7 Croatia Gin Market Import-Export Trade Statistics |
7.1 Croatia Gin Market Export to Major Countries |
7.2 Croatia Gin Market Imports from Major Countries |
8 Croatia Gin Market Key Performance Indicators |
9 Croatia Gin Market - Opportunity Assessment |
9.1 Croatia Gin Market Opportunity Assessment, By Product Type, 2021 & 2031F |
9.2 Croatia Gin Market Opportunity Assessment, By Production Method, 2021 & 2031F |
9.3 Croatia Gin Market Opportunity Assessment, By Distribution Channel, 2021 & 2031F |
10 Croatia Gin Market - Competitive Landscape |
10.1 Croatia Gin Market Revenue Share, By Companies, 2024 |
10.2 Croatia Gin Market Competitive Benchmarking, By Operating and Technical Parameters |
11 Company Profiles |
12 Recommendations | 13 Disclaimer |
Export potential assessment - trade Analytics for 2030
Export potential enables firms to identify high-growth global markets with greater confidence by combining advanced trade intelligence with a structured quantitative methodology. The framework analyzes emerging demand trends and country-level import patterns while integrating macroeconomic and trade datasets such as GDP and population forecasts, bilateral import–export flows, tariff structures, elasticity differentials between developed and developing economies, geographic distance, and import demand projections. Using weighted trade values from 2020–2024 as the base period to project country-to-country export potential for 2030, these inputs are operationalized through calculated drivers such as gravity model parameters, tariff impact factors, and projected GDP per-capita growth. Through an analysis of hidden potentials, demand hotspots, and market conditions that are most favorable to success, this method enables firms to focus on target countries, maximize returns, and global expansion with data, backed by accuracy.
By factoring in the projected importer demand gap that is currently unmet and could be potential opportunity, it identifies the potential for the Exporter (Country) among 190 countries, against the general trade analysis, which identifies the biggest importer or exporter.
To discover high-growth global markets and optimize your business strategy:
Click Here
Pricing
- Single User License$ 1,995
- Department License$ 2,400
- Site License$ 3,120
- Global License$ 3,795

Search
Thought Leadership and Analyst Meet


Our Clients
Related Reports
- Pakistan Contraceptive Implants Market (2025-2031) | Demand, Growth, Size, Share, Industry, Pricing Analysis, Competitive, Strategic Insights, Strategy, Consumer Insights, Analysis, Investment Trends, Opportunities, Revenue, Segments, Value, Segmentation, Supply, Forecast, Restraints, Outlook, Competition, Drivers, Trends, Companies, Challenges
- Sri Lanka Packaging Market (2026-2032) | Outlook, Competition, Drivers, Trends, Demand, Pricing Analysis, Competitive, Strategic Insights, Companies, Challenges, Strategy, Consumer Insights, Analysis, Investment Trends, Opportunities, Growth, Size, Share, Industry, Revenue, Segments, Value, Segmentation, Supply, Forecast, Restraints
- India Kids Watches Market (2026-2032) | Strategy, Consumer Insights, Analysis, Investment Trends, Opportunities, Growth, Size, Share, Industry, Revenue, Segments, Value, Segmentation, Supply, Forecast, Restraints, Outlook, Competition, Drivers, Trends, Demand, Pricing Analysis, Competitive, Strategic Insights, Companies, Challenges
- Saudi Arabia Core Assurance Service Market (2025-2031) | Strategy, Consumer Insights, Analysis, Investment Trends, Opportunities, Growth, Size, Share, Industry, Revenue, Segments, Value, Segmentation, Supply, Forecast, Restraints, Outlook, Competition, Drivers, Trends, Demand, Pricing Analysis, Competitive, Strategic Insights, Companies, Challenges
- Romania Uninterruptible Power Supply (UPS) Market (2026-2032) | Industry, Analysis, Revenue, Size, Forecast, Outlook, Value, Trends, Share, Growth & Companies
- Saudi Arabia Car Window Tinting Film, Paint Protection Film (PPF), and Ceramic Coating Market (2025-2031) | Strategy, Consumer Insights, Analysis, Investment Trends, Opportunities, Growth, Size, Share, Industry, Revenue, Segments, Value, Segmentation, Supply, Forecast, Restraints, Outlook, Competition, Drivers, Trends, Demand, Pricing Analysis, Competitive, Strategic Insights, Companies, Challenges
- South Africa Stationery Market (2025-2031) | Share, Size, Industry, Value, Growth, Revenue, Analysis, Trends, Segmentation & Outlook
- Afghanistan Rocking Chairs And Adirondack Chairs Market (2026-2032) | Size & Revenue, Competitive Landscape, Share, Segmentation, Industry, Value, Outlook, Analysis, Trends, Growth, Forecast, Companies
- Afghanistan Apparel Market (2026-2032) | Growth, Outlook, Industry, Segmentation, Forecast, Size, Companies, Trends, Value, Share, Analysis & Revenue
- Canada Oil and Gas Market (2026-2032) | Share, Segmentation, Value, Industry, Trends, Forecast, Analysis, Size & Revenue, Growth, Competitive Landscape, Outlook, Companies
Industry Events and Analyst Meet

EV tech India Expo 2026

Auto Tech Asia 2026

Battery Tech India 2026

Smart Production Solutions Guangzhou 2026

Stationery & Paper Expo Saudi Arabia 2026
Whitepaper
- Middle East & Africa Commercial Security Market Click here to view more.
- Middle East & Africa Fire Safety Systems & Equipment Market Click here to view more.
- GCC Drone Market Click here to view more.
- Middle East Lighting Fixture Market Click here to view more.
- GCC Physical & Perimeter Security Market Click here to view more.
6WResearch In News
- Doha a strategic location for EV manufacturing hub: IPA Qatar
- Demand for luxury TVs surging in the GCC, says Samsung
- Empowering Growth: The Thriving Journey of Bangladesh’s Cable Industry
- Demand for luxury TVs surging in the GCC, says Samsung
- Video call with a traditional healer? Once unthinkable, it’s now common in South Africa
- Intelligent Buildings To Smooth GCC’s Path To Net Zero