Croatia Inulin Market (2025-2031) | Industry, Size, Growth, Trends, Share, Value, Forecast, Outlook, Revenue, Analysis, Segmentation & Companies
Market Forecast By Form (Powder, Liquid), By Nature (Organic, Conventional), By Source (Agave, Chicory, Jerusalem Artichoke, Others), By Application (Food & Beverages, Dietary Supplements, Pharmaceuticals, Animal Feed) And Competitive Landscape
| Product Code: ETC4846409 | Publication Date: Nov 2023 | Updated Date: Oct 2025 | Product Type: Market Research Report | |
| Publisher: 6Wresearch | Author: Sachin Kumar Rai | No. of Pages: 60 | No. of Figures: 30 | No. of Tables: 5 |
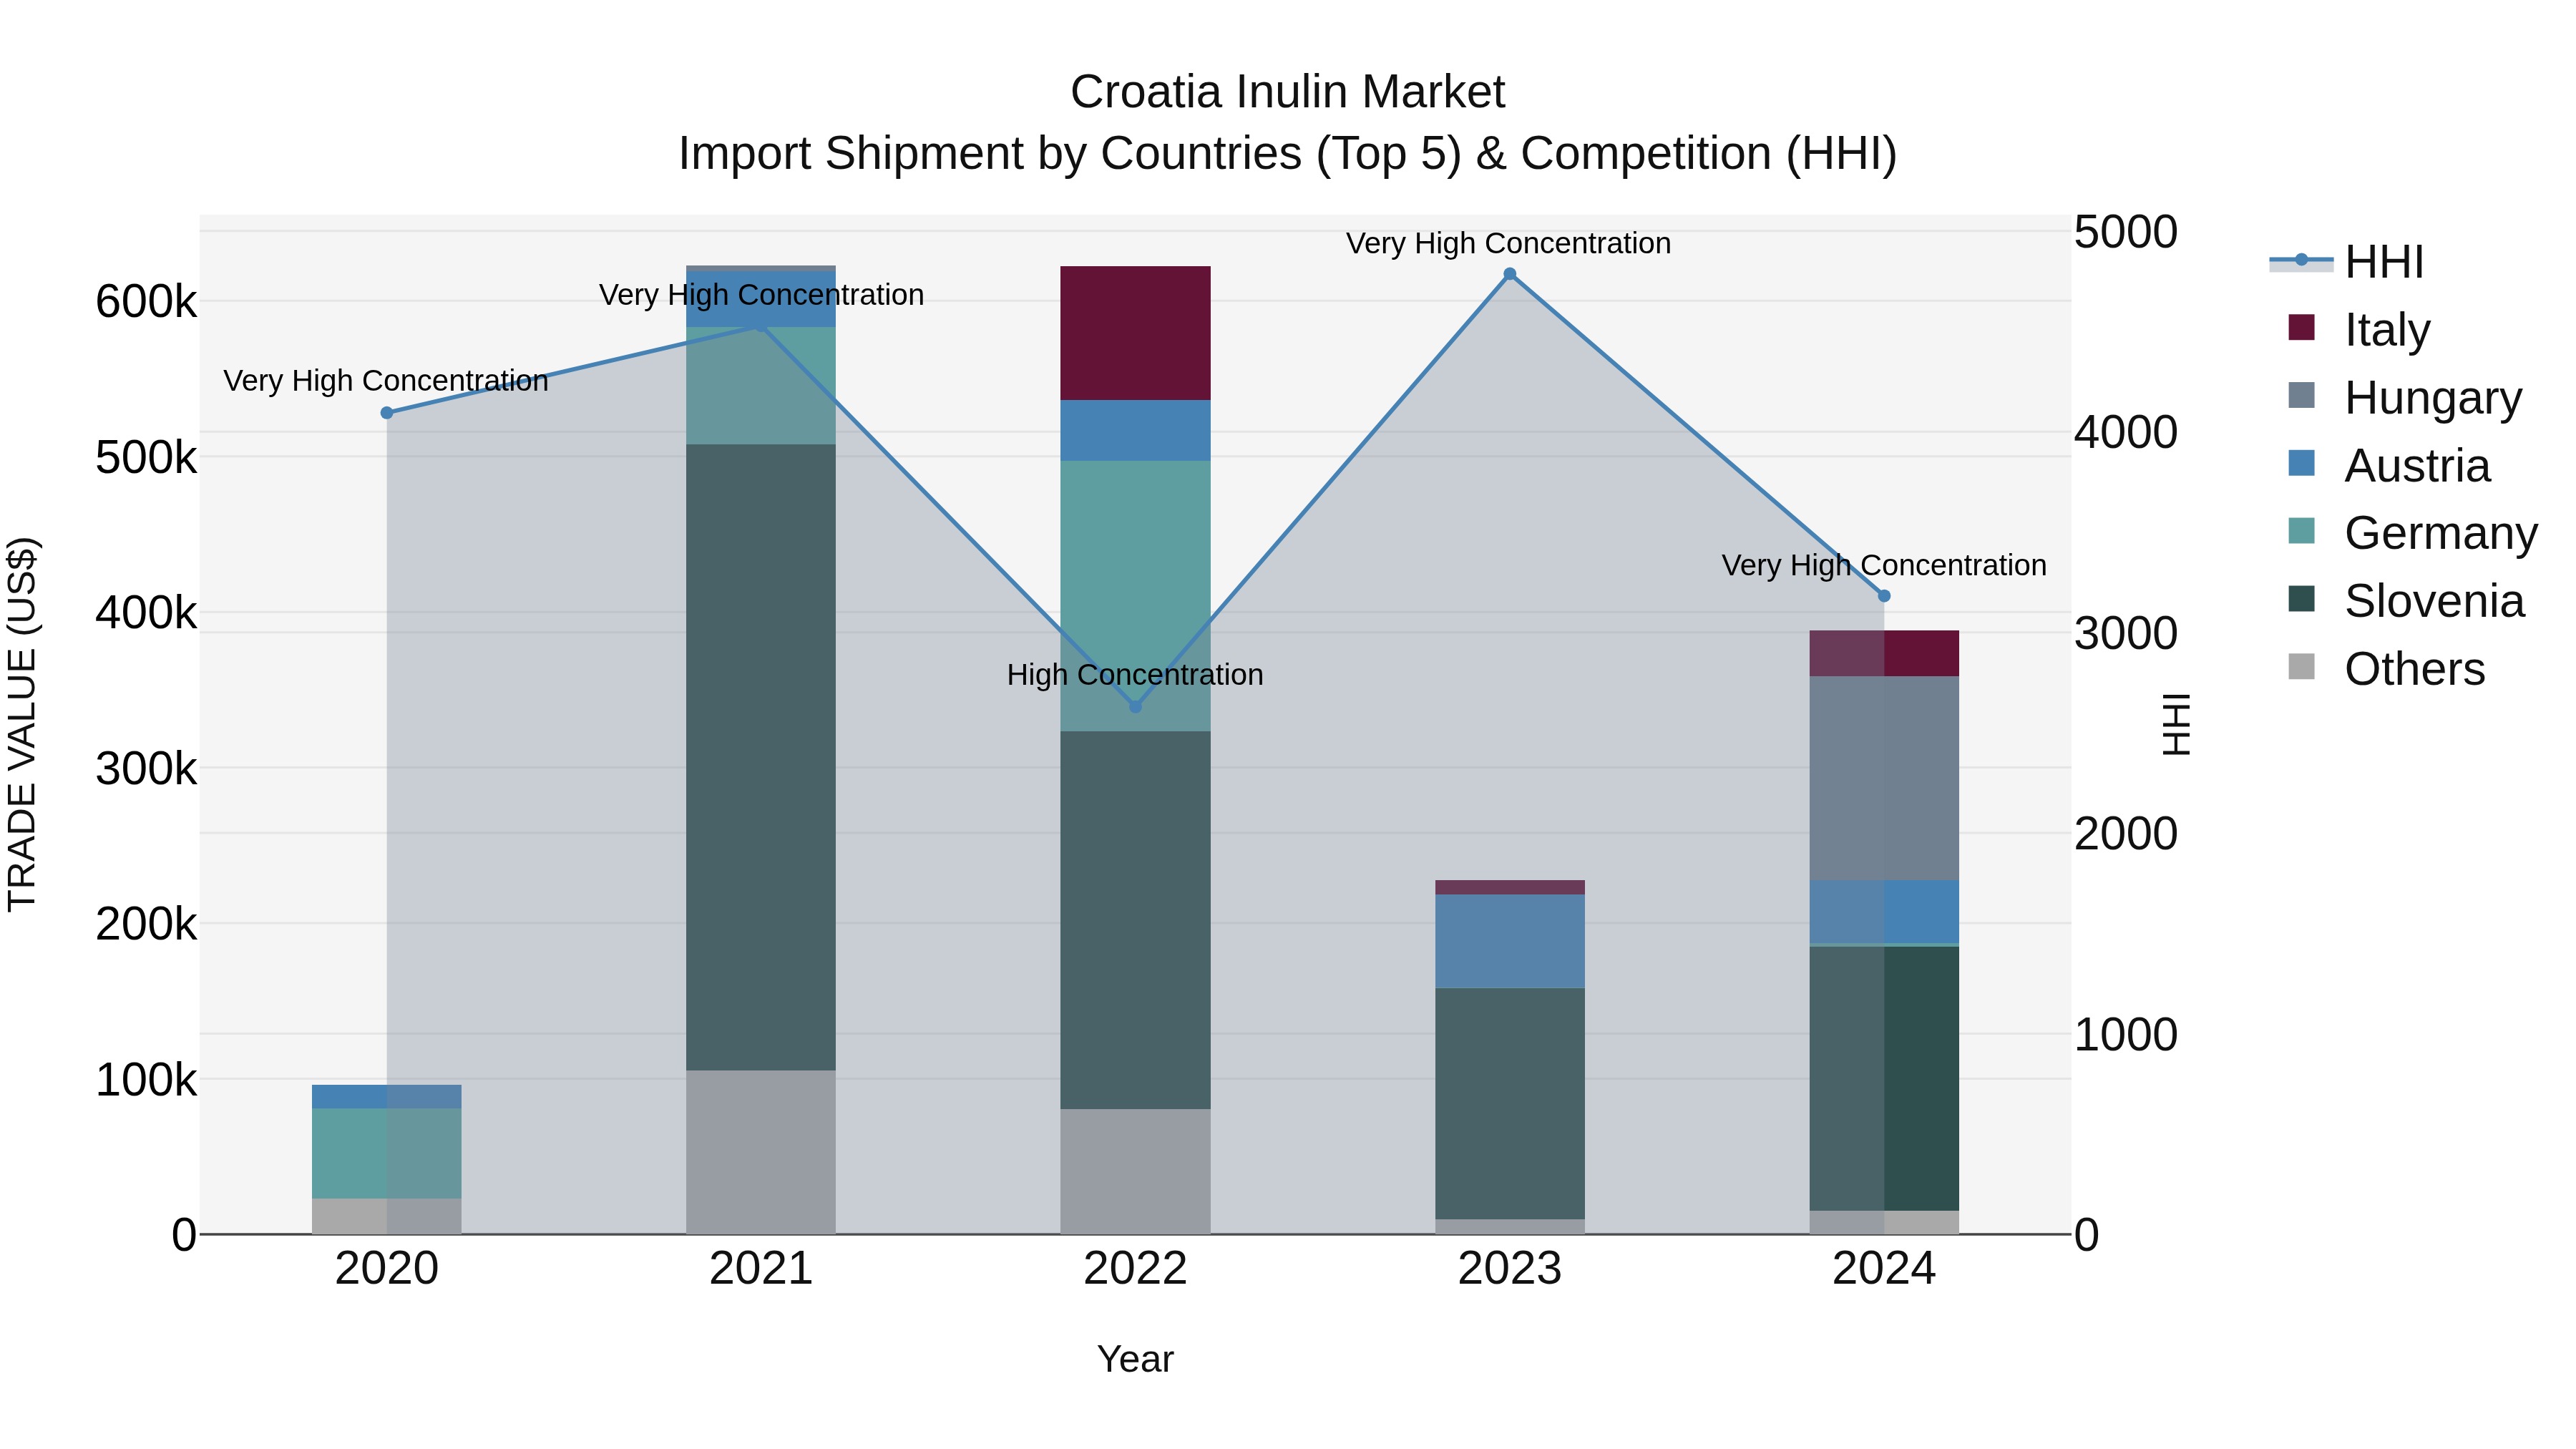
Croatia Inulin Market Top 5 Importing Countries and Market Competition (HHI) Analysis
Croatia inulin import market in 2024 continued to be dominated by neighboring countries such as Slovenia, Hungary, and Austria, with significant contributions also coming from Italy and the Netherlands. The high Herfindahl-Hirschman Index (HHI) indicates a concentrated market, while the impressive Compound Annual Growth Rate (CAGR) of 41.75% from 2020 to 2024 highlights strong demand and market expansion. The remarkable growth rate of 70.67% from 2023 to 2024 suggests a rapidly evolving market landscape, presenting both challenges and opportunities for players in the inulin import sector in Croatia.
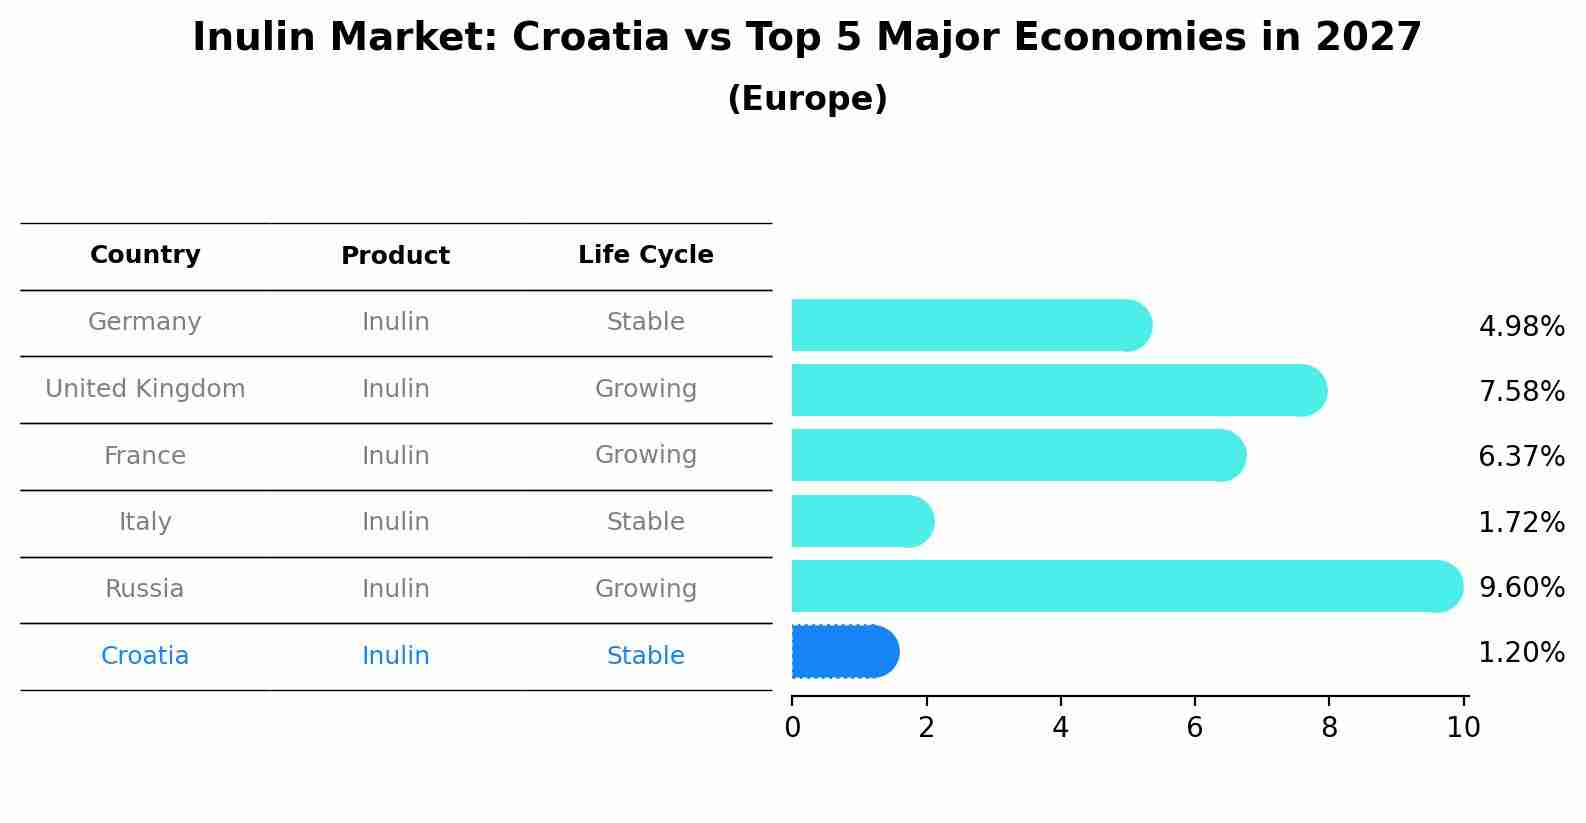
Inulin Market: Croatia vs Top 5 Major Economies in 2027 (Europe)
The Inulin market in Croatia is projected to grow at a stable growth rate of 1.20% by 2027, highlighting the country's increasing focus on advanced technologies within the Europe region, where Germany holds the dominant position, followed closely by United Kingdom, France, Italy and Russia, shaping overall regional demand.
Croatia Inulin Market Overview
The inulin market in Croatia is influenced by the rising consumer preference for natural and functional ingredients in food and beverages. Inulin, a type of soluble fiber found in various plants, is valued for its health benefits, including improved digestive health and blood sugar management. Its application spans across dietary supplements, functional foods, and beverages. Growing health consciousness and the demand for dietary fiber are major factors driving the market. Moreover, the increasing use of inulin as a sugar substitute in food products supports market growth.
Drivers of the market
The Croatian inulin market benefits from the rising consumer preference for dietary fibers and natural sweeteners due to their health benefits. Inulin, known for its prebiotic properties, is increasingly used in functional foods and dietary supplements. The growing awareness of digestive health and the prevalence of lifestyle diseases, such as diabetes, also drive the demand for inulin as a low-calorie, health-enhancing ingredient. Additionally, the expansion of the food and beverage industry in Croatia fuels the use of inulin in various product formulations.
Challenges of the market
In the Croatian inulin market, challenges include fluctuating raw material costs and regulatory constraints. Inulin, often derived from chicory or other plants, can experience price volatility due to changes in agricultural conditions and supply chain disruptions. Additionally, strict regulations on health claims and product labeling can create barriers for market entry and expansion. There is also competition from other dietary fibers and sweeteners, which can affect market share and profitability.
Government Policy of the market
The inulin market in Croatia is shaped by policies that promote the use of dietary fibers and functional foods. The Croatian government, in alignment with EU regulations, supports the incorporation of inulin into food products due to its health benefits, such as improved digestive health and blood sugar control. Government policies also include regulations on labeling and health claims, ensuring that consumers are well-informed about the benefits of inulin. Additionally, there are incentives for companies investing in research and development of new inulin-based products.
Key Highlights of the Report:
- Croatia Inulin Market Outlook
- Market Size of Croatia Inulin Market, 2024
- Forecast of Croatia Inulin Market, 2031
- Historical Data and Forecast of Croatia Inulin Revenues & Volume for the Period 2021-2031
- Croatia Inulin Market Trend Evolution
- Croatia Inulin Market Drivers and Challenges
- Croatia Inulin Price Trends
- Croatia Inulin Porter`s Five Forces
- Croatia Inulin Industry Life Cycle
- Historical Data and Forecast of Croatia Inulin Market Revenues & Volume By Form for the Period 2021-2031
- Historical Data and Forecast of Croatia Inulin Market Revenues & Volume By Powder for the Period 2021-2031
- Historical Data and Forecast of Croatia Inulin Market Revenues & Volume By Liquid for the Period 2021-2031
- Historical Data and Forecast of Croatia Inulin Market Revenues & Volume By Nature for the Period 2021-2031
- Historical Data and Forecast of Croatia Inulin Market Revenues & Volume By Organic for the Period 2021-2031
- Historical Data and Forecast of Croatia Inulin Market Revenues & Volume By Conventional for the Period 2021-2031
- Historical Data and Forecast of Croatia Inulin Market Revenues & Volume By Source for the Period 2021-2031
- Historical Data and Forecast of Croatia Inulin Market Revenues & Volume By Agave for the Period 2021-2031
- Historical Data and Forecast of Croatia Inulin Market Revenues & Volume By Chicory for the Period 2021-2031
- Historical Data and Forecast of Croatia Inulin Market Revenues & Volume By Jerusalem Artichoke for the Period 2021-2031
- Historical Data and Forecast of Croatia Inulin Market Revenues & Volume By Others for the Period 2021-2031
- Historical Data and Forecast of Croatia Inulin Market Revenues & Volume By Application for the Period 2021-2031
- Historical Data and Forecast of Croatia Inulin Market Revenues & Volume By Food & Beverages for the Period 2021-2031
- Historical Data and Forecast of Croatia Inulin Market Revenues & Volume By Dietary Supplements for the Period 2021-2031
- Historical Data and Forecast of Croatia Inulin Market Revenues & Volume By Pharmaceuticals for the Period 2021-2031
- Historical Data and Forecast of Croatia Inulin Market Revenues & Volume By Animal Feed for the Period 2021-2031
- Croatia Inulin Import Export Trade Statistics
- Market Opportunity Assessment By Form
- Market Opportunity Assessment By Nature
- Market Opportunity Assessment By Source
- Market Opportunity Assessment By Application
- Croatia Inulin Top Companies Market Share
- Croatia Inulin Competitive Benchmarking By Technical and Operational Parameters
- Croatia Inulin Company Profiles
- Croatia Inulin Key Strategic Recommendations
Frequently Asked Questions About the Market Study (FAQs):
6Wresearch actively monitors the Croatia Inulin Market and publishes its comprehensive annual report, highlighting emerging trends, growth drivers, revenue analysis, and forecast outlook. Our insights help businesses to make data-backed strategic decisions with ongoing market dynamics. Our analysts track relevent industries related to the Croatia Inulin Market, allowing our clients with actionable intelligence and reliable forecasts tailored to emerging regional needs.
Yes, we provide customisation as per your requirements. To learn more, feel free to contact us on sales@6wresearch.com
1 Executive Summary |
2 Introduction |
2.1 Key Highlights of the Report |
2.2 Report Description |
2.3 Market Scope & Segmentation |
2.4 Research Methodology |
2.5 Assumptions |
3 Croatia Inulin Market Overview |
3.1 Croatia Country Macro Economic Indicators |
3.2 Croatia Inulin Market Revenues & Volume, 2021 & 2031F |
3.3 Croatia Inulin Market - Industry Life Cycle |
3.4 Croatia Inulin Market - Porter's Five Forces |
3.5 Croatia Inulin Market Revenues & Volume Share, By Form, 2021 & 2031F |
3.6 Croatia Inulin Market Revenues & Volume Share, By Nature, 2021 & 2031F |
3.7 Croatia Inulin Market Revenues & Volume Share, By Source, 2021 & 2031F |
3.8 Croatia Inulin Market Revenues & Volume Share, By Application, 2021 & 2031F |
4 Croatia Inulin Market Dynamics |
4.1 Impact Analysis |
4.2 Market Drivers |
4.2.1 Increasing consumer awareness about health benefits of inulin |
4.2.2 Growing demand for natural and functional food ingredients |
4.2.3 Rise in health-conscious population in Croatia |
4.3 Market Restraints |
4.3.1 High production costs associated with inulin extraction |
4.3.2 Limited availability of raw materials for inulin production |
4.3.3 Stringent regulations and standards for food ingredients in Croatia |
5 Croatia Inulin Market Trends |
6 Croatia Inulin Market Segmentations |
6.1 Croatia Inulin Market, By Form |
6.1.1 Overview and Analysis |
6.1.2 Croatia Inulin Market Revenues & Volume, By Powder, 2021-2031F |
6.1.3 Croatia Inulin Market Revenues & Volume, By Liquid, 2021-2031F |
6.2 Croatia Inulin Market, By Nature |
6.2.1 Overview and Analysis |
6.2.2 Croatia Inulin Market Revenues & Volume, By Organic, 2021-2031F |
6.2.3 Croatia Inulin Market Revenues & Volume, By Conventional, 2021-2031F |
6.3 Croatia Inulin Market, By Source |
6.3.1 Overview and Analysis |
6.3.2 Croatia Inulin Market Revenues & Volume, By Agave, 2021-2031F |
6.3.3 Croatia Inulin Market Revenues & Volume, By Chicory, 2021-2031F |
6.3.4 Croatia Inulin Market Revenues & Volume, By Jerusalem Artichoke, 2021-2031F |
6.3.5 Croatia Inulin Market Revenues & Volume, By Others, 2021-2031F |
6.4 Croatia Inulin Market, By Application |
6.4.1 Overview and Analysis |
6.4.2 Croatia Inulin Market Revenues & Volume, By Food & Beverages, 2021-2031F |
6.4.3 Croatia Inulin Market Revenues & Volume, By Dietary Supplements, 2021-2031F |
6.4.4 Croatia Inulin Market Revenues & Volume, By Pharmaceuticals, 2021-2031F |
6.4.5 Croatia Inulin Market Revenues & Volume, By Animal Feed, 2021-2031F |
7 Croatia Inulin Market Import-Export Trade Statistics |
7.1 Croatia Inulin Market Export to Major Countries |
7.2 Croatia Inulin Market Imports from Major Countries |
8 Croatia Inulin Market Key Performance Indicators |
8.1 Number of new product launches containing inulin |
8.2 Percentage of food manufacturers using inulin in their products |
8.3 Consumer awareness and perception of inulin as a health ingredient |
9 Croatia Inulin Market - Opportunity Assessment |
9.1 Croatia Inulin Market Opportunity Assessment, By Form, 2021 & 2031F |
9.2 Croatia Inulin Market Opportunity Assessment, By Nature, 2021 & 2031F |
9.3 Croatia Inulin Market Opportunity Assessment, By Source, 2021 & 2031F |
9.4 Croatia Inulin Market Opportunity Assessment, By Application, 2021 & 2031F |
10 Croatia Inulin Market - Competitive Landscape |
10.1 Croatia Inulin Market Revenue Share, By Companies, 2024 |
10.2 Croatia Inulin Market Competitive Benchmarking, By Operating and Technical Parameters |
11 Company Profiles |
12 Recommendations | 13 Disclaimer |
Global Go To Market Strategy - 2030
Export potential enables firms to identify high-growth global markets with greater confidence by combining advanced trade intelligence with a structured quantitative methodology. The framework analyzes emerging demand trends and country-level import patterns while integrating macroeconomic and trade datasets such as GDP and population forecasts, bilateral import–export flows, tariff structures, elasticity differentials between developed and developing economies, geographic distance, and import demand projections. Using weighted trade values from 2020–2024 as the base period to project country-to-country export potential for 2030, these inputs are operationalized through calculated drivers such as gravity model parameters, tariff impact factors, and projected GDP per-capita growth. Through an analysis of hidden potentials, demand hotspots, and market conditions that are most favorable to success, this method enables firms to focus on target countries, maximize returns, and global expansion with data, backed by accuracy.
By factoring in the projected importer demand gap that is currently unmet and could be potential opportunity, it identifies the potential for the Exporter (Country) among 190 countries, against the general trade analysis, which identifies the biggest importer or exporter.
To discover high-growth global markets and optimize your business strategy:
Click Here
Pricing
- Single User License$ 1,995
- Department License$ 2,400
- Site License$ 3,120
- Global License$ 3,795

Leadership Perspectives from Industry Events
Search
Thought Leadership and Analyst Meet


Our Clients
6WResearch In News
- India Export Attractiveness Tracker 2026
- India Air Conditioner Market Set for Strong Rebound in 2026 After Weather-Led Correction and GST-Driven Recovery: 6Wresearch
- ADAS in India: How Automatic Emergency Braking, Blind Spot Detection & Driver Monitoring are Transforming Road Safety
- Doha a strategic location for EV manufacturing hub: IPA Qatar
- Demand for luxury TVs surging in the GCC, says Samsung
- Empowering Growth: The Thriving Journey of Bangladesh’s Cable Industry
Latest Reports
- Nicaragua RPG Gaming Market (2026-2032)
- New Zealand RPG Gaming Market (2026-2032)
- Netherlands RPG Gaming Market (2026-2032)
- Nauru RPG Gaming Market (2026-2032)
- Namibia RPG Gaming Market (2026-2032)
- Mozambique RPG Gaming Market (2026-2032)
- Montenegro RPG Gaming Market (2026-2032)
- Mongolia RPG Gaming Market (2026-2032)
- Monaco RPG Gaming Market (2026-2032)
- Micronesia RPG Gaming Market (2026-2032)
Industry Events and Analyst Meet

EV India Expo 2026

HIMTEX 2026

India Refining Summit 2026

India EV Show 2026

EV tech India Expo 2026
Whitepaper
- Middle East & Africa Commercial Security Market Click here to view more.
- Middle East & Africa Fire Safety Systems & Equipment Market Click here to view more.
- GCC Drone Market Click here to view more.
- Middle East Lighting Fixture Market Click here to view more.
- GCC Physical & Perimeter Security Market Click here to view more.