Croatia Invert Sugar Market (2026-2032) | Value, Trends, Analysis, Industry, Size, Growth, Companies, Outlook, Forecast, Revenue, Share & Segmentation
Market Forecast By Type (50 percent, 100 percent), By Application (Sweetener, Texturizing agent, Preservative) And Competitive Landscape
| Product Code: ETC4846808 | Publication Date: Nov 2023 | Updated Date: Apr 2026 | Product Type: Market Research Report | |
| Publisher: 6Wresearch | Author: Shubham Padhi | No. of Pages: 60 | No. of Figures: 30 | No. of Tables: 5 |
Croatia Invert Sugar Market Size (2020-2030)
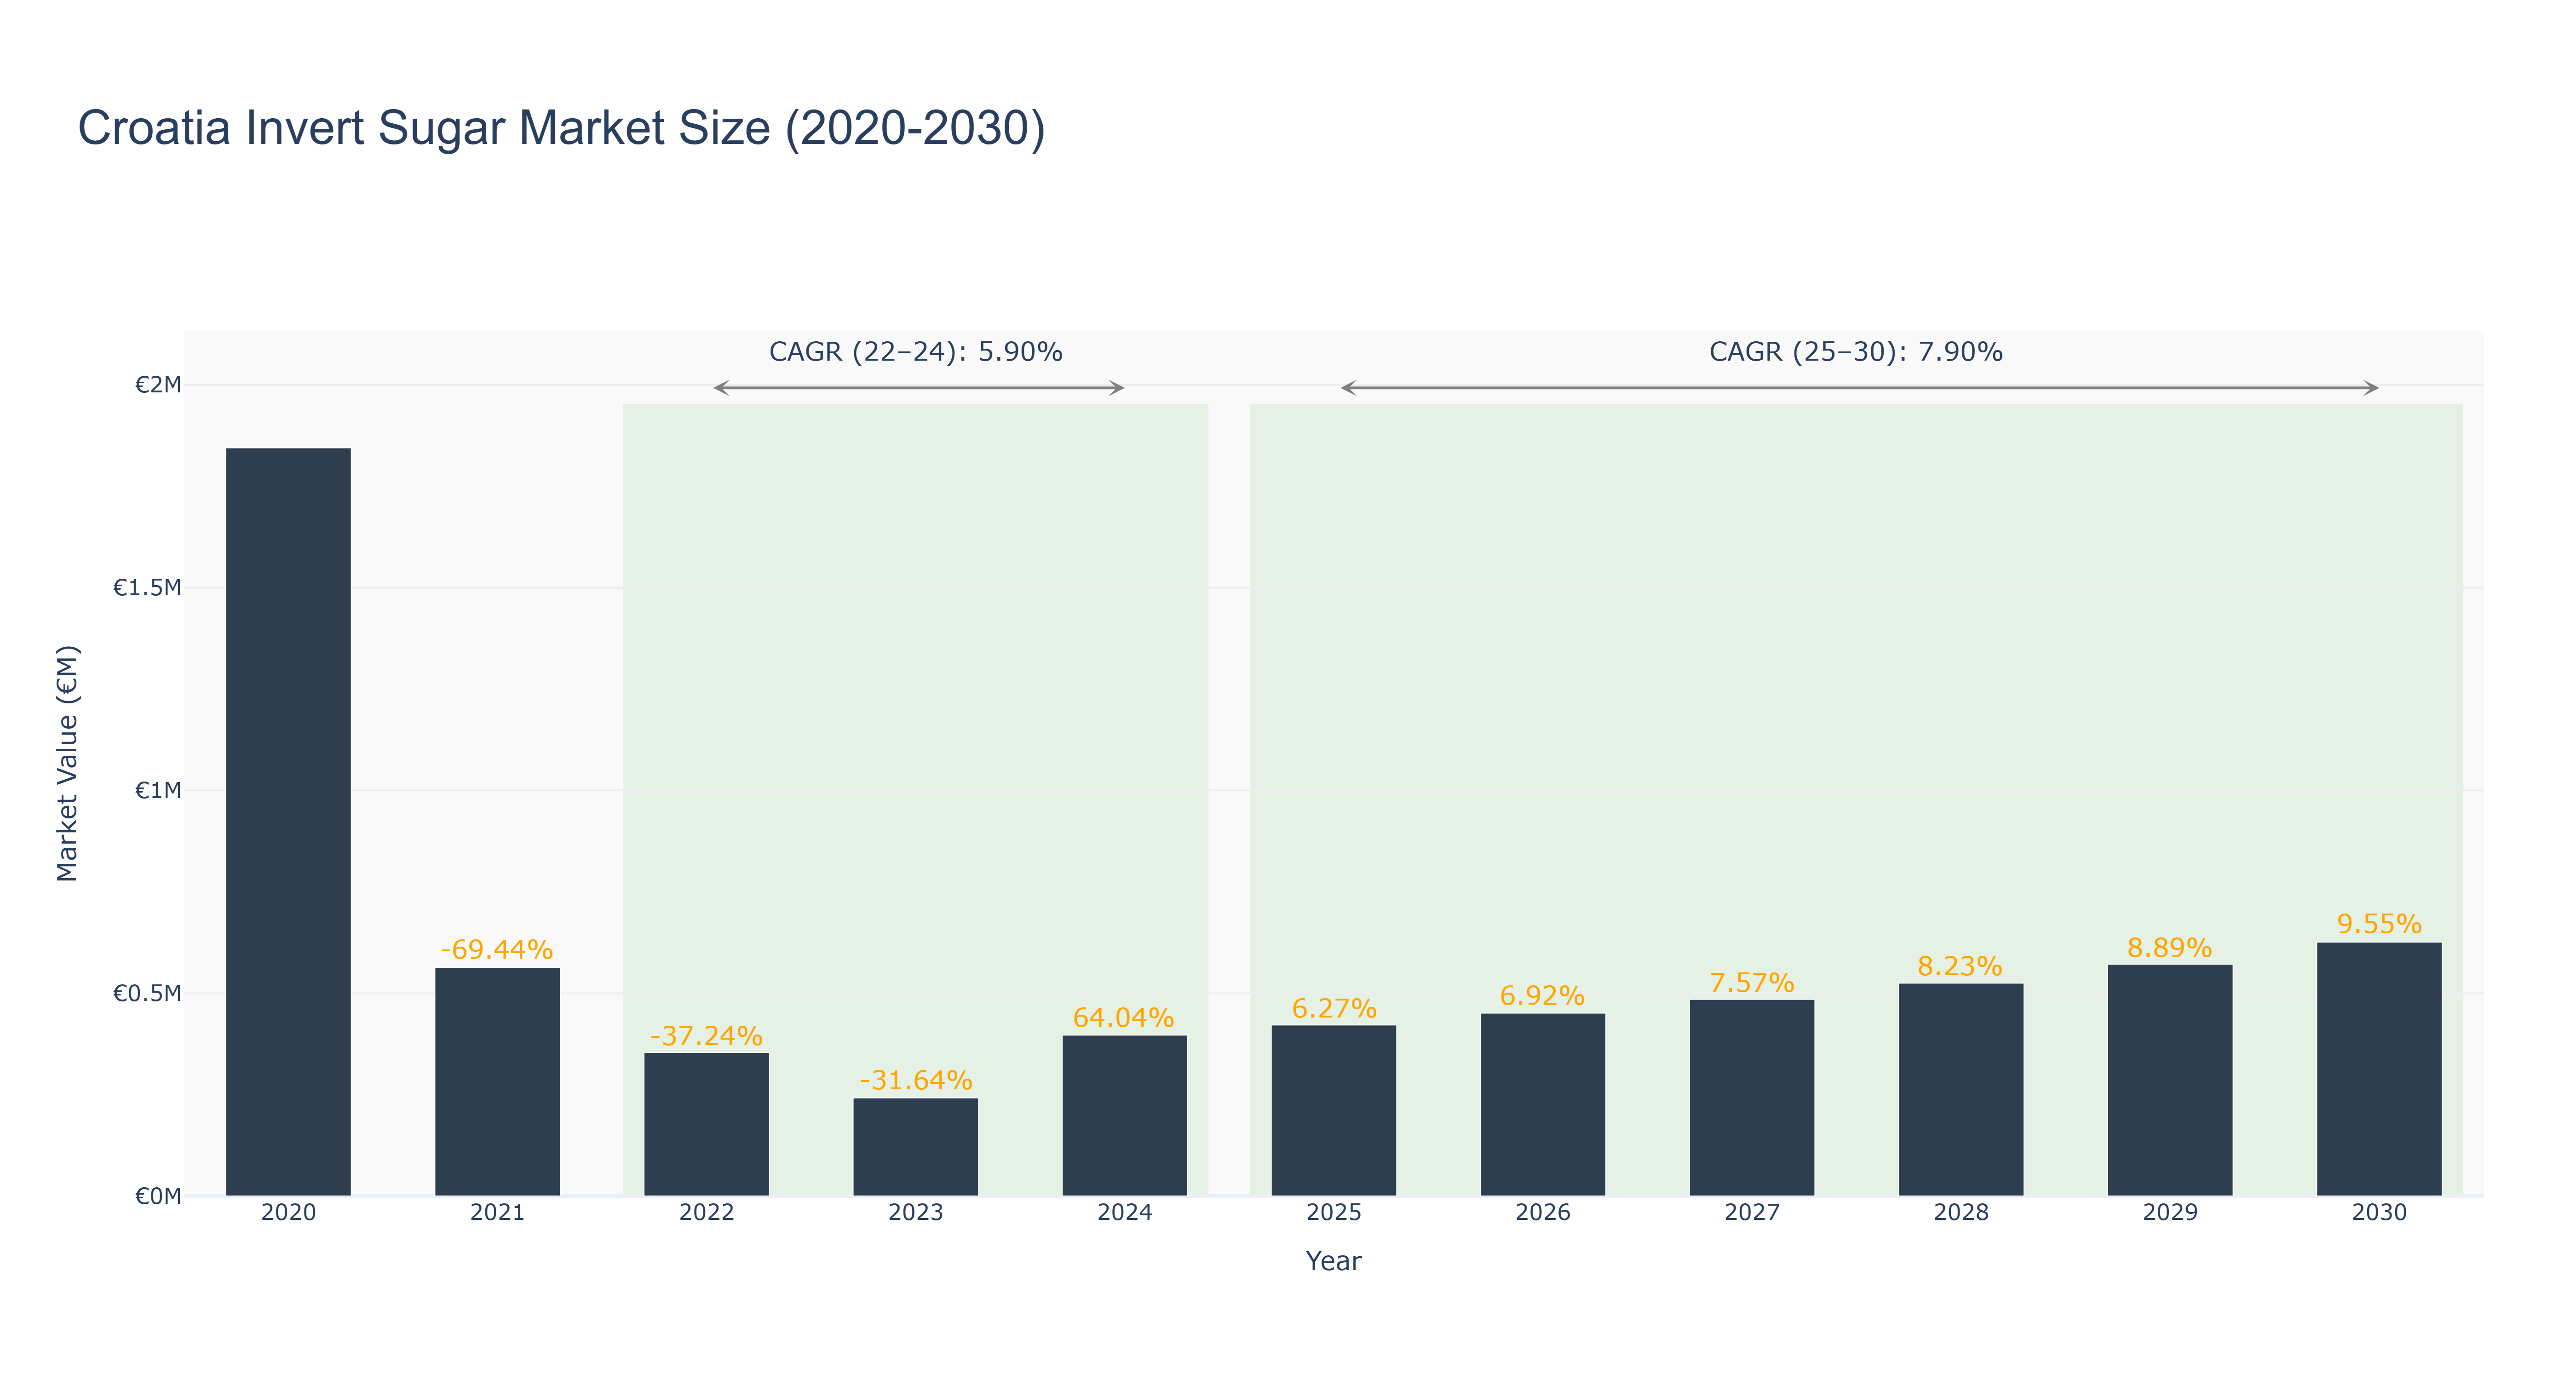
Croatia Invert Sugar Market has shown a fluctuating trend over the years. The peak market size of €1.84 million was recorded in 2020, followed by a significant decline to €0.35 million in 2022. The market size then rebounded in 2024 to €0.40 million, with a notable growth rate of 64.04%. Forecasted market size from 2025 to 2030 shows a steady increase, with an expected size of €0.63 million in 2030. The CAGR values of 5.90% (2022-24) and 7.90% (2025-30) indicate a positive growth trajectory. The market's volatility in recent years can be attributed to changing consumer preferences and economic conditions. Looking ahead, Croatia is set to introduce new regulations promoting sustainable sugar production, which is expected to further drive market growth in the coming years.
Croatia Invert Sugar Market: Production & Trade Performance (2019-2025)
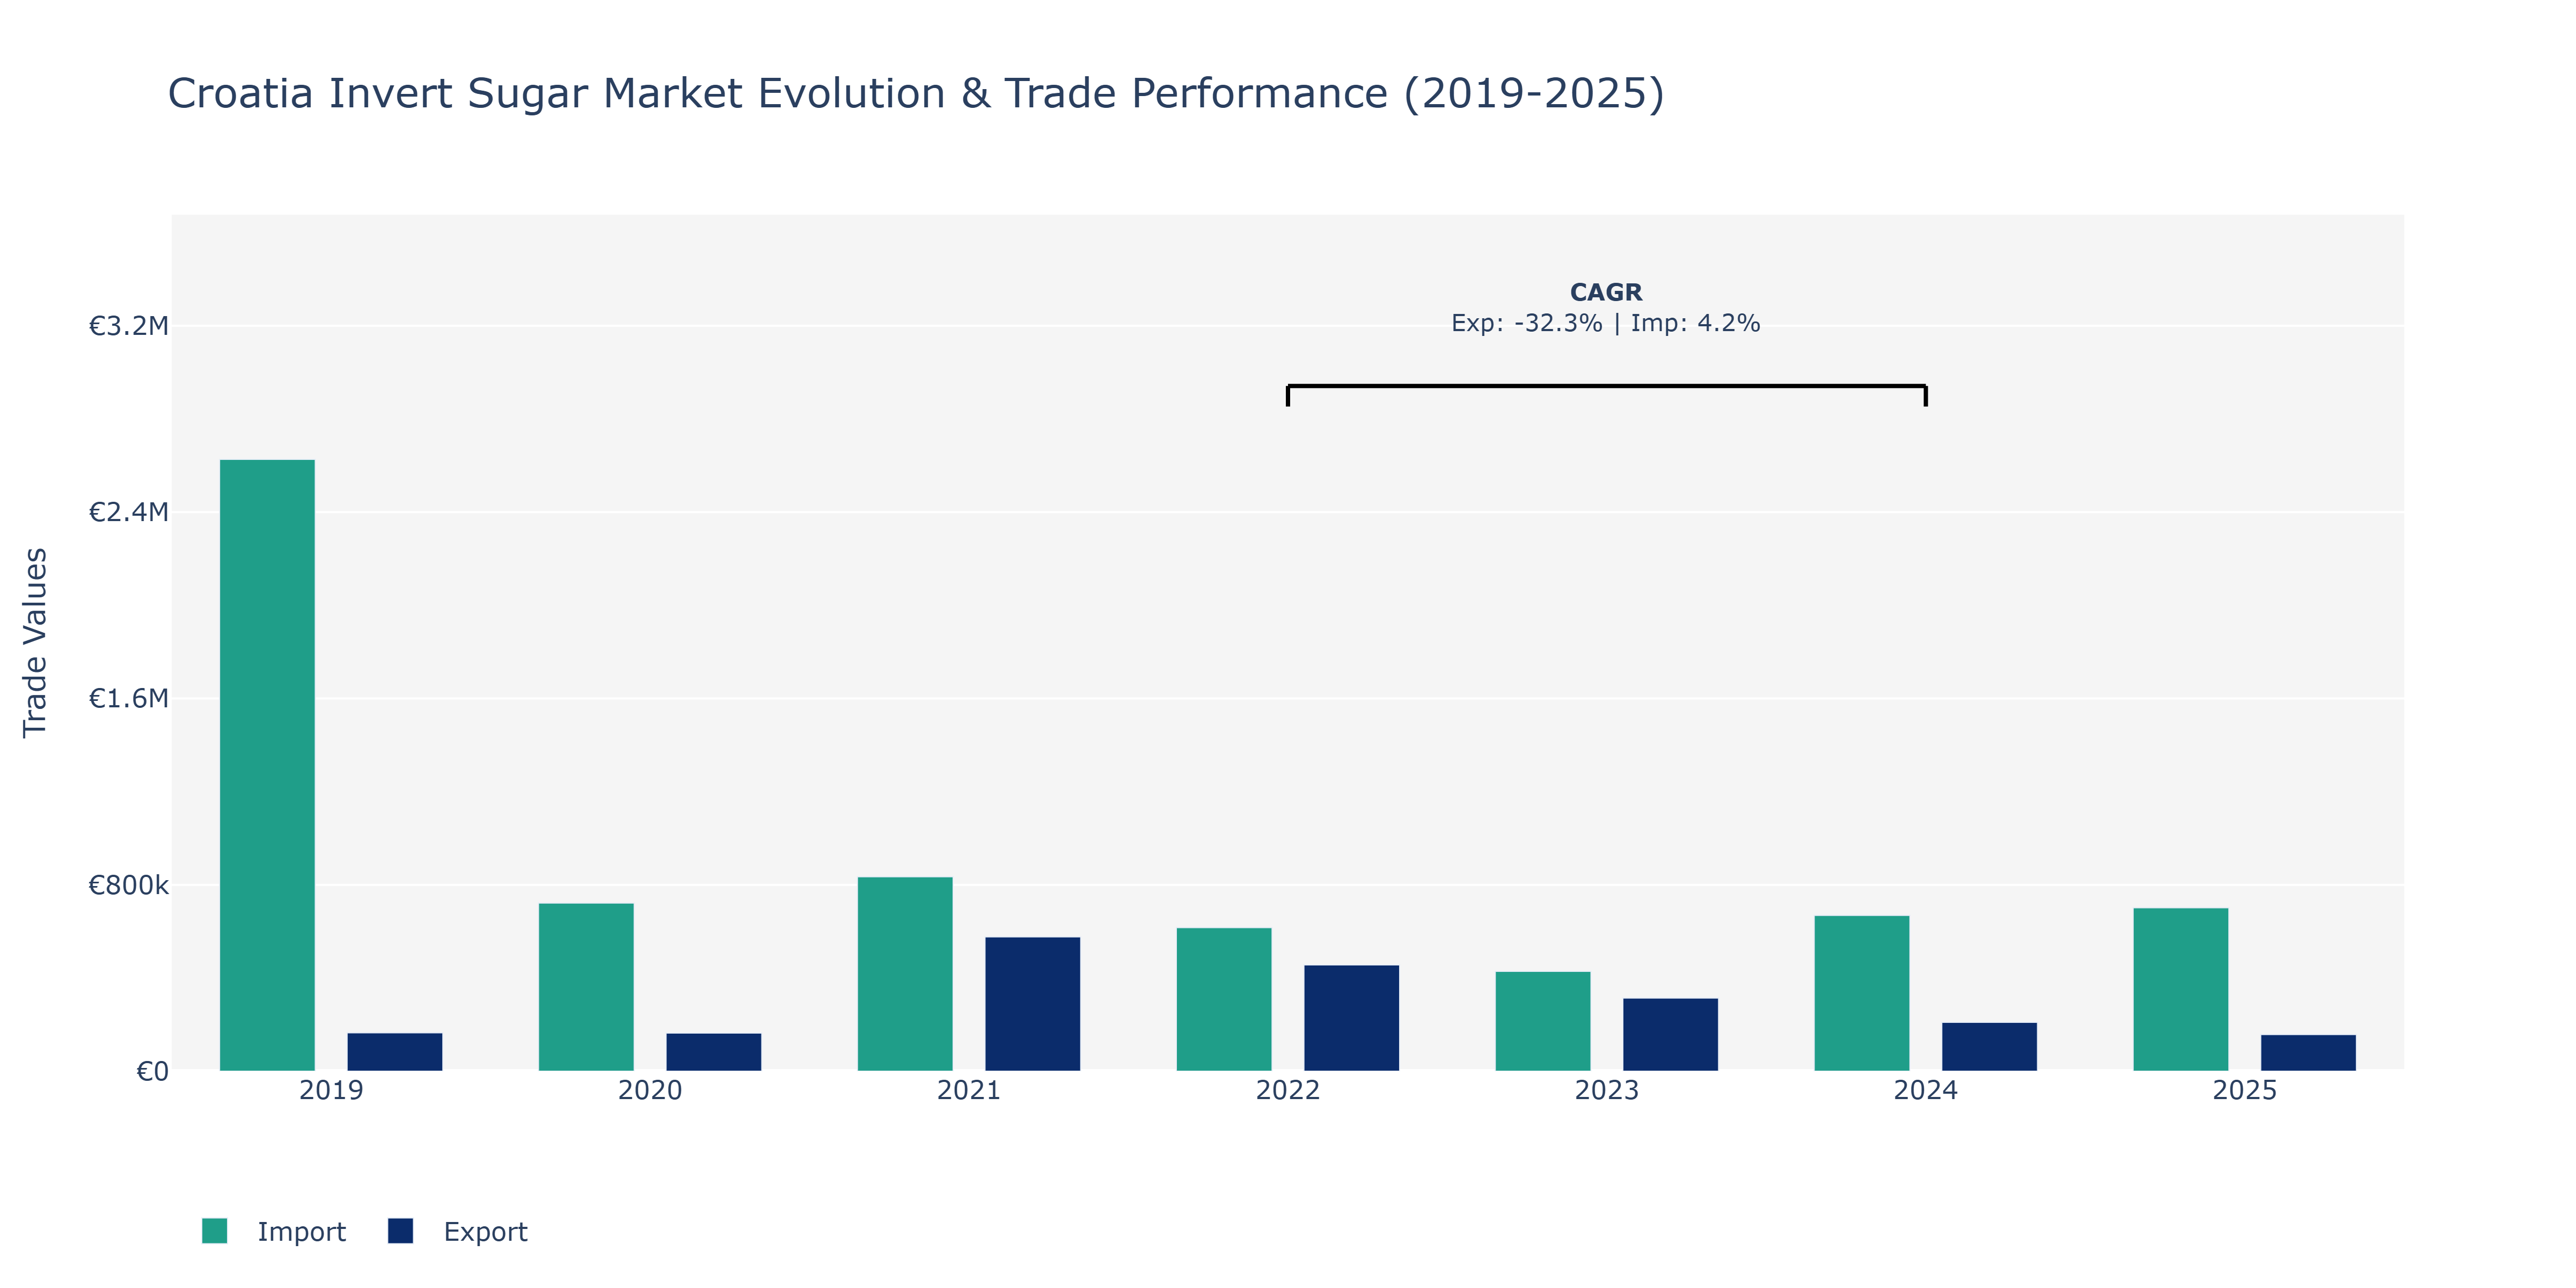
Between 2019 and 2025, Croatia's Invert Sugar Market experienced varying trends in both Exports and Imports. In 2019, Imports stood significantly higher than Exports, with Imports totaling €2.63 million and Exports at €164.99 thousand. Over the following years, both metrics fluctuated. Exports saw a notable increase in 2021, reaching €576.63 thousand, likely driven by demand or production changes. However, a sharp decline occurred in 2022, dropping to €456.49 thousand. This decrease might be attributed to shifts in market dynamics or external factors impacting trade. Similarly, Imports fluctuated, hitting a peak in 2019 before gradually decreasing and then slightly rising in 2025. The Import peak in 2019 could be linked to supply chain decisions or changes in domestic demand. The subsequent fluctuations might reflect evolving market conditions or regulatory changes affecting trade dynamics in the Invert Sugar Market.
Key Highlights of the Report:
- Croatia Invert Sugar Market Outlook
- Market Size of Croatia Invert Sugar Market, 2025
- Forecast of Croatia Invert Sugar Market, 2032
- Historical Data and Forecast of Croatia Invert Sugar Revenues & Volume for the Period 2022 - 2032F
- Croatia Invert Sugar Market Trend Evolution
- Croatia Invert Sugar Market Drivers and Challenges
- Croatia Invert Sugar Price Trends
- Croatia Invert Sugar Porter`s Five Forces
- Croatia Invert Sugar Industry Life Cycle
- Historical Data and Forecast of Croatia Invert Sugar Market Revenues & Volume By Type for the Period 2022 - 2032F
- Historical Data and Forecast of Croatia Invert Sugar Market Revenues & Volume By 50 percent for the Period 2022 - 2032F
- Historical Data and Forecast of Croatia Invert Sugar Market Revenues & Volume By 100 percent for the Period 2022 - 2032F
- Historical Data and Forecast of Croatia Invert Sugar Market Revenues & Volume By Application for the Period 2022 - 2032F
- Historical Data and Forecast of Croatia Invert Sugar Market Revenues & Volume By Sweetener for the Period 2022 - 2032F
- Historical Data and Forecast of Croatia Invert Sugar Market Revenues & Volume By Texturizing agent for the Period 2022 - 2032F
- Historical Data and Forecast of Croatia Invert Sugar Market Revenues & Volume By Preservative for the Period 2022 - 2032F
- Croatia Invert Sugar Import Export Trade Statistics
- Market Opportunity Assessment By Type
- Market Opportunity Assessment By Application
- Croatia Invert Sugar Top Companies Market Share
- Croatia Invert Sugar Competitive Benchmarking By Technical and Operational Parameters
- Croatia Invert Sugar Company Profiles
- Croatia Invert Sugar Key Strategic Recommendations
Frequently Asked Questions About the Market Study (FAQs):
6Wresearch actively monitors the Croatia Invert Sugar Market and publishes its comprehensive annual report, highlighting emerging trends, growth drivers, revenue analysis, and forecast outlook. Our insights help businesses to make data-backed strategic decisions with ongoing market dynamics. Our analysts track relevent industries related to the Croatia Invert Sugar Market, allowing our clients with actionable intelligence and reliable forecasts tailored to emerging regional needs.
Yes, we provide customisation as per your requirements. To learn more, feel free to contact us on sales@6wresearch.com
1 Executive Summary |
2 Introduction |
2.1 Key Highlights of the Report |
2.2 Report Description |
2.3 Market Scope & Segmentation |
2.4 Research Methodology |
2.5 Assumptions |
3 Croatia Invert Sugar Market Overview |
3.1 Croatia Country Macro Economic Indicators |
3.2 Croatia Invert Sugar Market Revenues & Volume, 2022 & 2032F |
3.3 Croatia Invert Sugar Market - Industry Life Cycle |
3.4 Croatia Invert Sugar Market - Porter's Five Forces |
3.5 Croatia Invert Sugar Market Revenues & Volume Share, By Type, 2022 & 2032F |
3.6 Croatia Invert Sugar Market Revenues & Volume Share, By Application, 2022 & 2032F |
4 Croatia Invert Sugar Market Dynamics |
4.1 Impact Analysis |
4.2 Market Drivers |
4.2.1 Increasing consumer awareness about health benefits of invert sugar |
4.2.2 Growing demand for natural and organic sweeteners |
4.2.3 Expansion of food and beverage industry in Croatia |
4.3 Market Restraints |
4.3.1 Fluctuating prices of raw materials |
4.3.2 Stringent regulations and labeling requirements |
4.3.3 Competition from other alternative sweeteners |
5 Croatia Invert Sugar Market Trends |
6 Croatia Invert Sugar Market Segmentations |
6.1 Croatia Invert Sugar Market, By Type |
6.1.1 Overview and Analysis |
6.1.2 Croatia Invert Sugar Market Revenues & Volume, By 50 percent, 2022 - 2032F |
6.1.3 Croatia Invert Sugar Market Revenues & Volume, By 100 percent, 2022 - 2032F |
6.2 Croatia Invert Sugar Market, By Application |
6.2.1 Overview and Analysis |
6.2.2 Croatia Invert Sugar Market Revenues & Volume, By Sweetener, 2022 - 2032F |
6.2.3 Croatia Invert Sugar Market Revenues & Volume, By Texturizing agent, 2022 - 2032F |
6.2.4 Croatia Invert Sugar Market Revenues & Volume, By Preservative, 2022 - 2032F |
7 Croatia Invert Sugar Market Import-Export Trade Statistics |
7.1 Croatia Invert Sugar Market Export to Major Countries |
7.2 Croatia Invert Sugar Market Imports from Major Countries |
8 Croatia Invert Sugar Market Key Performance Indicators |
8.1 Percentage of food and beverage companies using invert sugar in their products |
8.2 Consumer perception and demand for invert sugar products |
8.3 Number of new product launches containing invert sugar |
8.4 Investment in research and development for new invert sugar applications |
8.5 Market penetration rate of invert sugar in different food segments |
9 Croatia Invert Sugar Market - Opportunity Assessment |
9.1 Croatia Invert Sugar Market Opportunity Assessment, By Type, 2022 & 2032F |
9.2 Croatia Invert Sugar Market Opportunity Assessment, By Application, 2022 & 2032F |
10 Croatia Invert Sugar Market - Competitive Landscape |
10.1 Croatia Invert Sugar Market Revenue Share, By Companies, 2025 |
10.2 Croatia Invert Sugar Market Competitive Benchmarking, By Operating and Technical Parameters |
11 Company Profiles |
12 Recommendations | 13 Disclaimer |
Export potential assessment - trade Analytics for 2030
Export potential enables firms to identify high-growth global markets with greater confidence by combining advanced trade intelligence with a structured quantitative methodology. The framework analyzes emerging demand trends and country-level import patterns while integrating macroeconomic and trade datasets such as GDP and population forecasts, bilateral import–export flows, tariff structures, elasticity differentials between developed and developing economies, geographic distance, and import demand projections. Using weighted trade values from 2020–2024 as the base period to project country-to-country export potential for 2030, these inputs are operationalized through calculated drivers such as gravity model parameters, tariff impact factors, and projected GDP per-capita growth. Through an analysis of hidden potentials, demand hotspots, and market conditions that are most favorable to success, this method enables firms to focus on target countries, maximize returns, and global expansion with data, backed by accuracy.
By factoring in the projected importer demand gap that is currently unmet and could be potential opportunity, it identifies the potential for the Exporter (Country) among 190 countries, against the general trade analysis, which identifies the biggest importer or exporter.
To discover high-growth global markets and optimize your business strategy:
Click Here
Pricing
- Single User License$ 1,995
- Department License$ 2,400
- Site License$ 3,120
- Global License$ 3,795

Search
Thought Leadership and Analyst Meet


Our Clients
Latest Reports
- China Electric Appliance Rental Market (2026-2032) | Trends, Revenue, Growth, Challenges, Size, Value, Outlook, Pricing, Strategy, Insights, Restraints, segmentation, Companies, Investment Opportunities, Analysis, Demand, Drivers, Competition, Forecast, Share
- Chile Electric Appliance Rental Market (2026-2032) | Outlook, Competition, Drivers, Strategy, Revenue, Analysis, Value, Pricing, Restraints, Size, Demand, Share, Growth, Forecast, Challenges, Insights, Investment Opportunities, Companies, Trends, segmentation
- Cambodia Electric Appliance Rental Market (2026-2032) | Companies, Analysis, Restraints, Pricing, Insights, Challenges, Outlook, Strategy, Forecast, Trends, Competition, Value, Revenue, Investment Opportunities, segmentation, Drivers, Size, Demand, Growth, Share
- Brazil Electric Appliance Rental Market (2026-2032) | Revenue, Strategy, Forecast, Companies, segmentation, Competition, Size, Investment Opportunities, Pricing, Restraints, Outlook, Challenges, Analysis, Drivers, Value, Demand, Insights, Trends, Growth, Share
- Bangladesh Electric Appliance Rental Market (2026-2032) | Drivers, Forecast, Investment Opportunities, Strategy, Insights, Demand, Challenges, Outlook, Trends, Competition, Value, Revenue, Size, Pricing, Analysis, Companies, Restraints, segmentation, Share, Growth
- Bahrain Electric Appliance Rental Market (2026-2032) | Outlook, Size, Competition, Restraints, Drivers, Value, Trends, Investment Opportunities, Insights, Forecast, Revenue, Strategy, Growth, Share, Demand, Analysis, Challenges, Companies, segmentation, Pricing
- Azerbaijan Electric Appliance Rental Market (2026-2032) | Trends, Investment Opportunities, Restraints, Insights, Strategy, Competition, Value, Growth, Demand, Drivers, Analysis, Forecast, Size, Share, Outlook, segmentation, Pricing, Challenges, Revenue, Companies
- Australia Electric Appliance Rental Market (2026-2032) | Challenges, Restraints, Forecast, Demand, Size, Competition, Pricing, Investment Opportunities, Revenue, Trends, Drivers, Growth, Outlook, Analysis, Strategy, Value, segmentation, Insights, Companies, Share
- Argentina Electric Appliance Rental Market (2026-2032) | Growth, Trends, Insights, Outlook, Forecast, Size, Drivers, Analysis, Restraints, Challenges, Share, Revenue, Investment Opportunities, Strategy, Demand, Value, Companies, segmentation, Competition, Pricing
- Algeria Electric Appliance Rental Market (2026-2032) | Share, Size, Value, Strategy, Competition, Outlook, Challenges, Companies, Trends, Pricing, Insights, Forecast, Investment Opportunities, Revenue, Growth, Restraints, segmentation, Analysis, Demand, Drivers
Industry Events and Analyst Meet

HIMTEX 2026

India Refining Summit 2026

India EV Show 2026

EV tech India Expo 2026

Auto Tech Asia 2026
Whitepaper
- Middle East & Africa Commercial Security Market Click here to view more.
- Middle East & Africa Fire Safety Systems & Equipment Market Click here to view more.
- GCC Drone Market Click here to view more.
- Middle East Lighting Fixture Market Click here to view more.
- GCC Physical & Perimeter Security Market Click here to view more.
6WResearch In News
- Doha a strategic location for EV manufacturing hub: IPA Qatar
- Demand for luxury TVs surging in the GCC, says Samsung
- Empowering Growth: The Thriving Journey of Bangladesh’s Cable Industry
- Demand for luxury TVs surging in the GCC, says Samsung
- Video call with a traditional healer? Once unthinkable, it’s now common in South Africa
- Intelligent Buildings To Smooth GCC’s Path To Net Zero