Croatia Iodophor Disinfectant Market (2026-2032) | Trends, Forecast, Size & Revenue, Share, Industry, Segmentation, Outlook, Companies, Competitive Landscape, Growth, Value, Analysis
Market Forecast By Grade (Pharmaceutical, Industrial, Others), By End-use (Medical, Food & Beverage, Household Disinfectant, Agriculture, Others) And Competitive Landscape
| Product Code: ETC6853859 | Publication Date: Sep 2024 | Updated Date: Apr 2026 | Product Type: Market Research Report | |
| Publisher: 6Wresearch | Author: Dhaval Chaurasia | No. of Pages: 75 | No. of Figures: 35 | No. of Tables: 20 |
Croatia Iodophor Disinfectant Market Size (2020-2030)
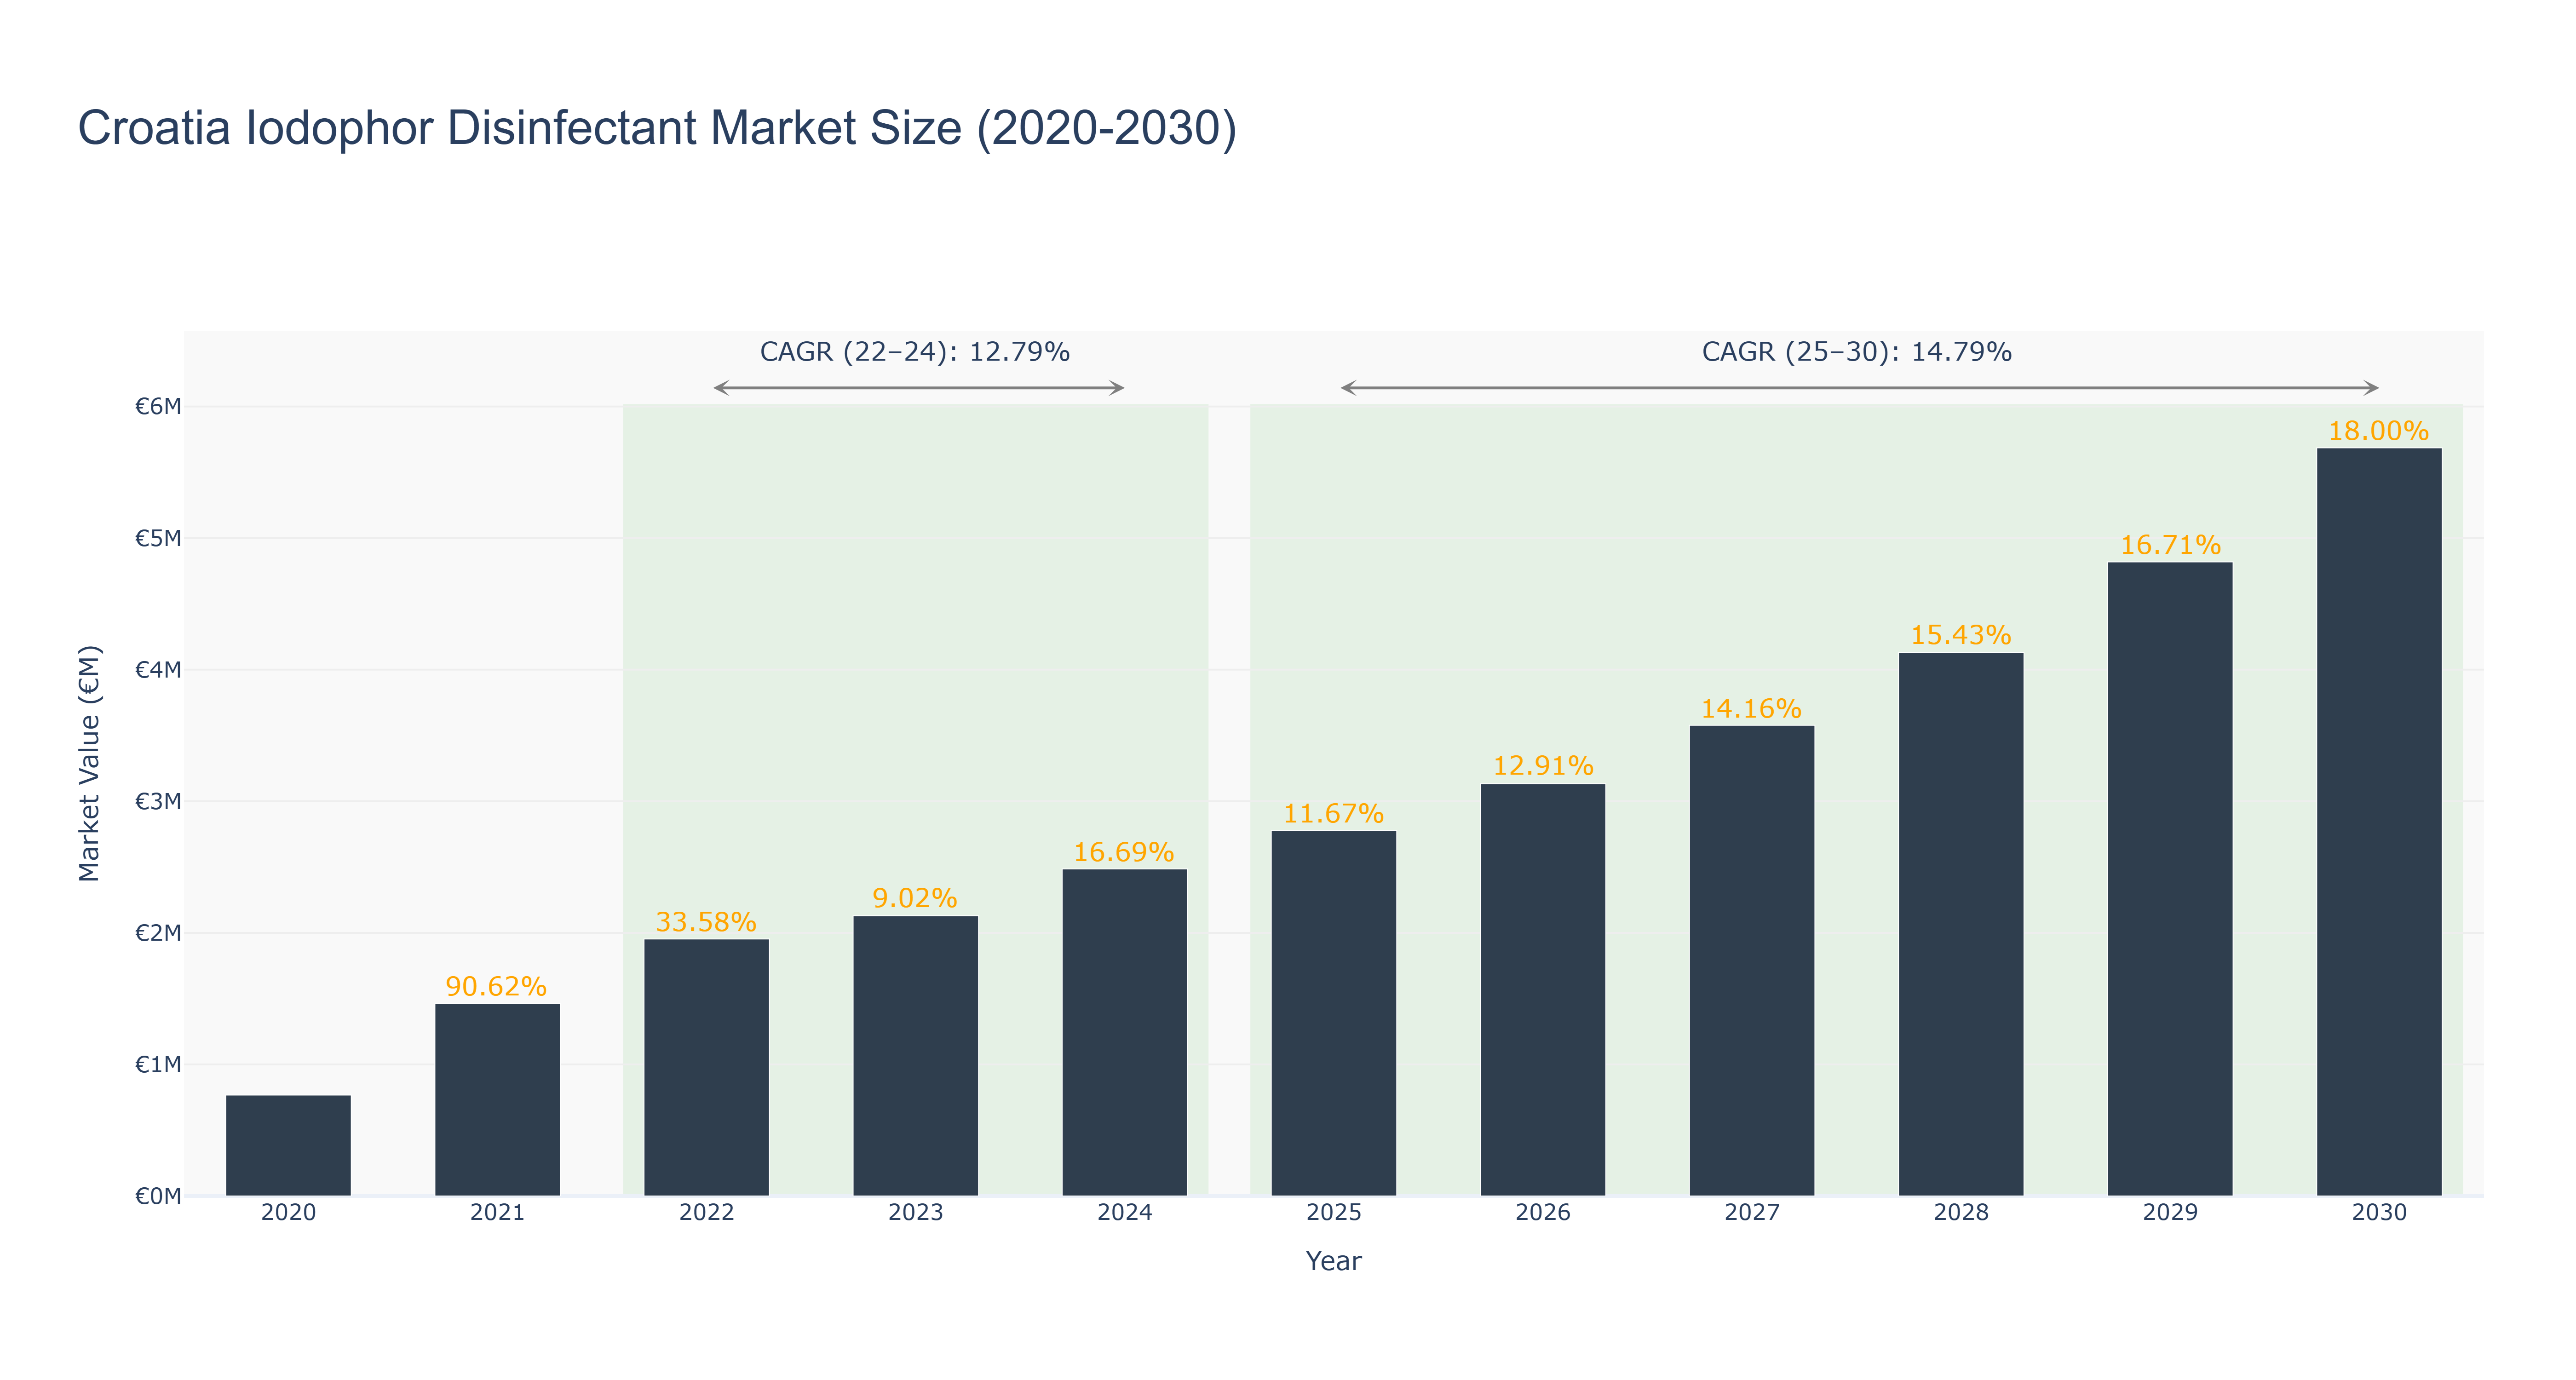
The Croatia Iodophor Disinfectant Market has shown robust growth from 2020 to 2024, with market size escalating from €767.25 thousand in 2020 to €2.49 million by 2024, marking a compound annual growth rate (CAGR) of 12.79% during this period. The peak market size was achieved in 2024, reflecting a significant demand surge attributed to heightened hygiene standards and increased awareness of disinfectant efficacy, particularly in healthcare and food industries. Looking ahead, the market is projected to maintain strong momentum, with forecasted growth from €2.78 million in 2025 to €5.69 million by 2030, indicating a CAGR of 14.79%. This growth is expected to be driven by ongoing public health initiatives and innovations in disinfectant formulations. Furthermore, regulatory support and increased investments in sanitation infrastructures are likely to bolster market expansion in the coming years, positioning Croatia as a key player in the disinfectant sector.
Croatia Iodophor Disinfectant Market: Production & Trade Performance (2019-2025)
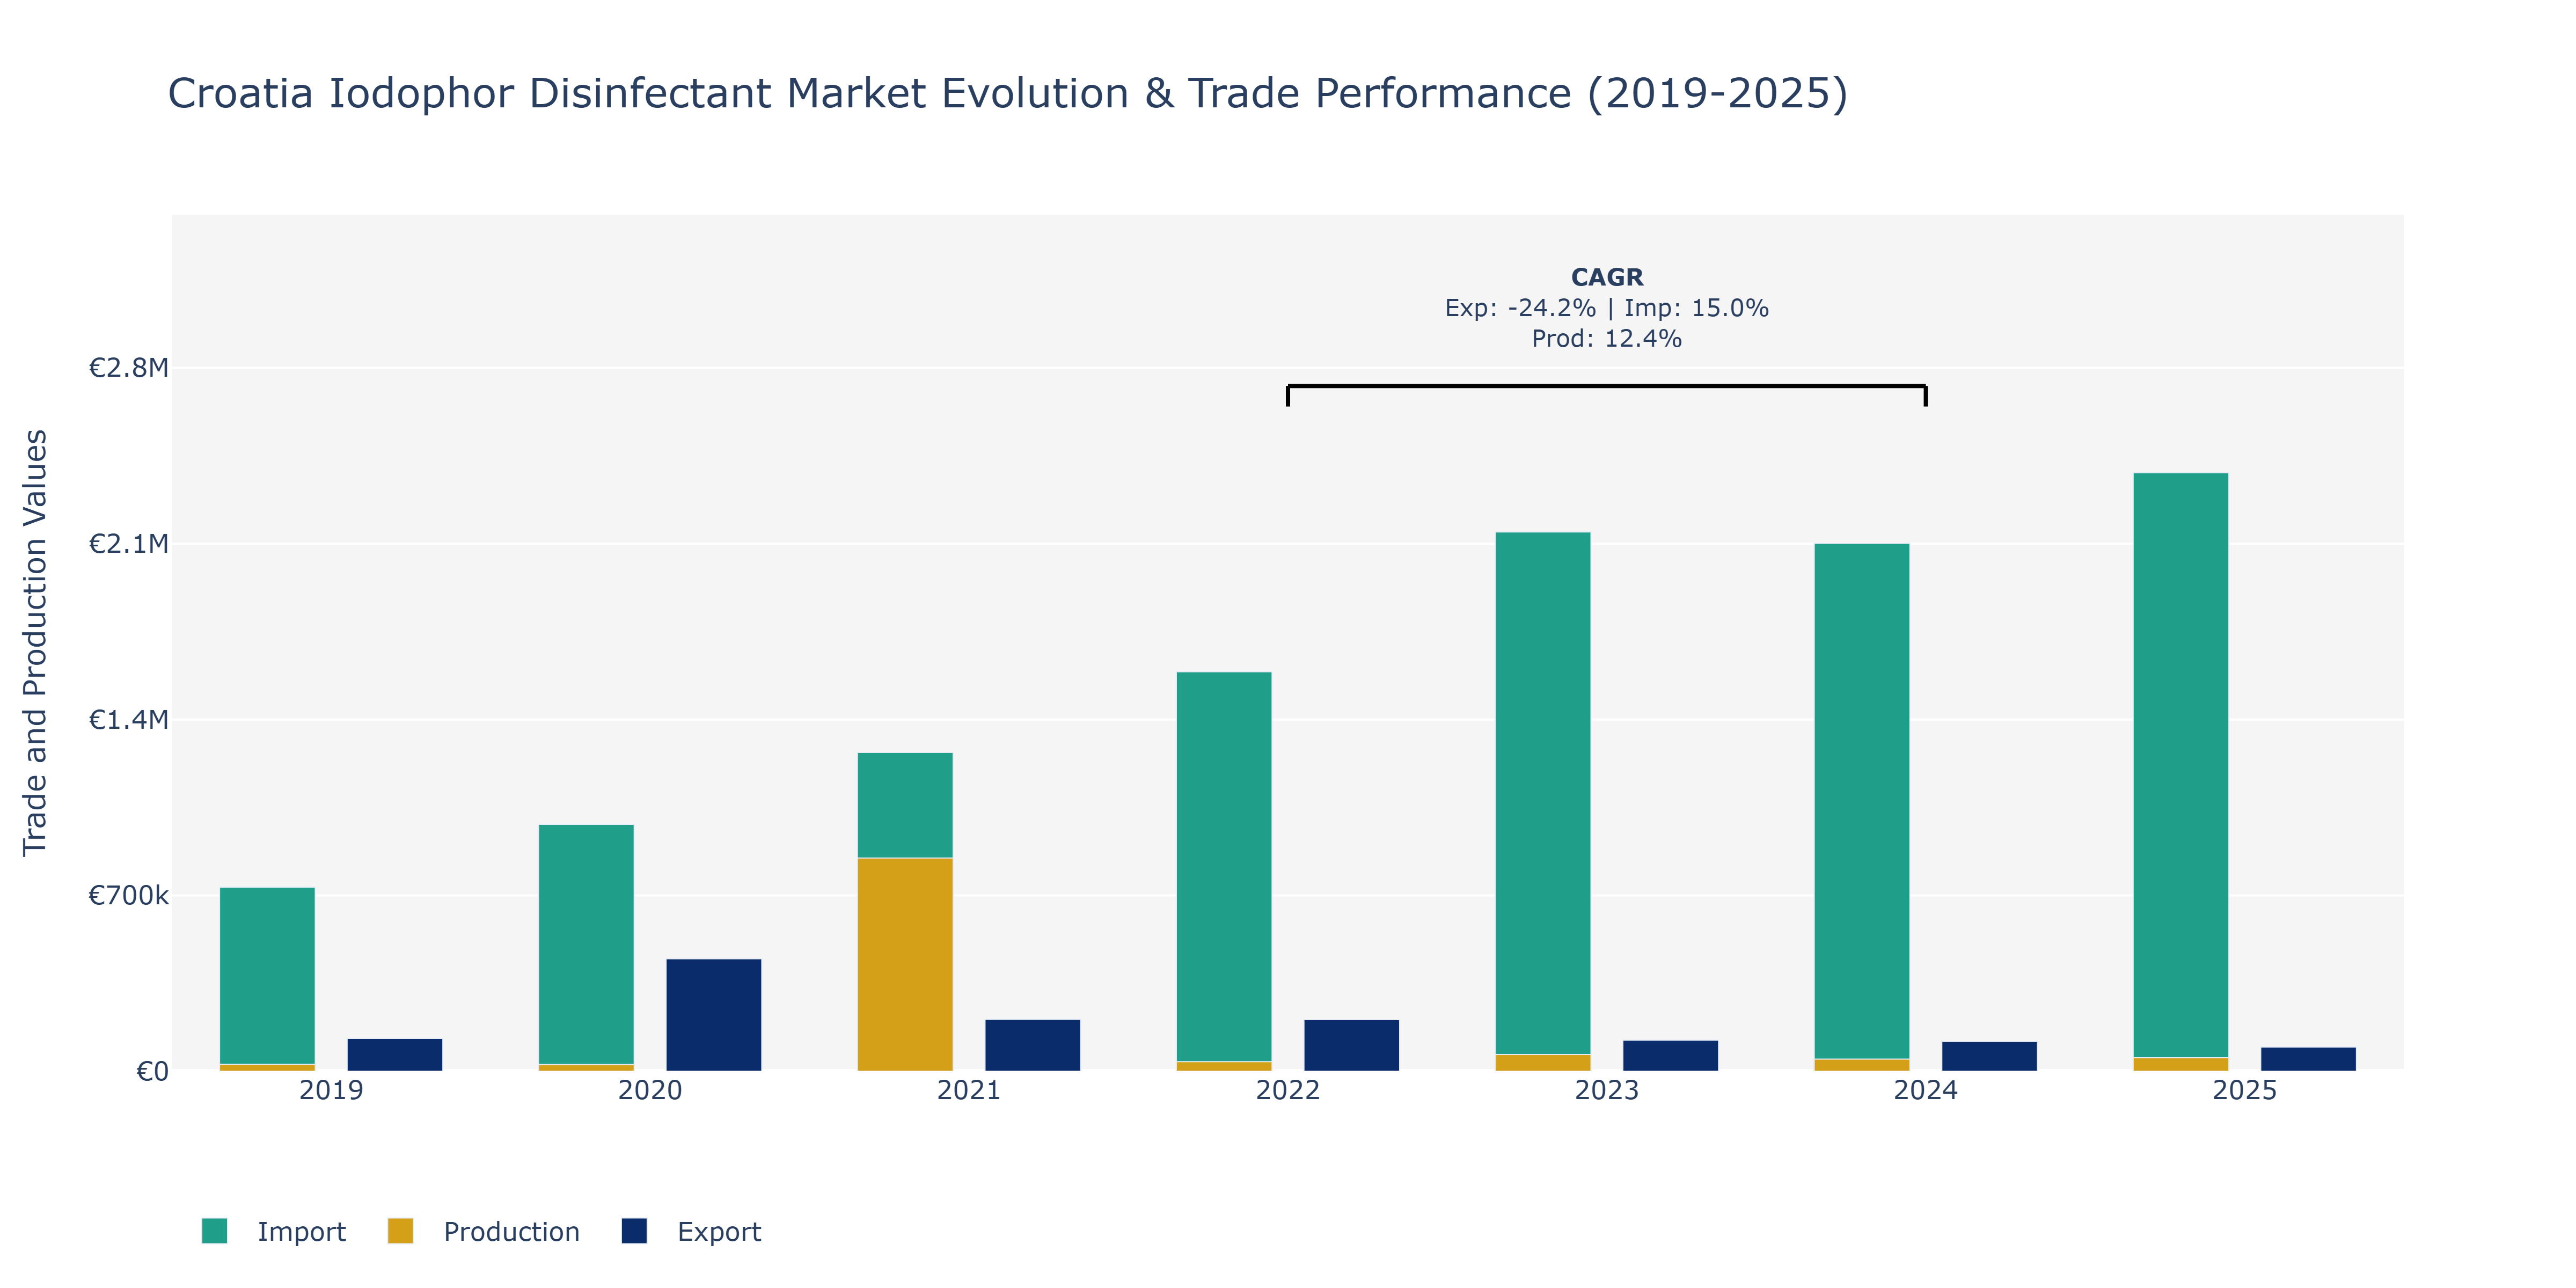
In the Croatia Iodophor Disinfectant Market, exports showed a fluctuating pattern from 2019 to 2025. Starting at €130.48 thousand in 2019, exports peaked at €447.4 thousand in 2020 before declining in subsequent years to €96.42 thousand in 2025. This decline could be attributed to various factors such as changes in global demand, pricing pressures, or shifts in market dynamics. Imports, on the other hand, consistently increased over the years, rising from €732.11 thousand in 2019 to €2.38 million in 2025. Such substantial growth in imports could be driven by increased domestic consumption, supply chain enhancements, or the need for diverse product offerings. In terms of production, the market witnessed a notable rise from €27.65 thousand in 2019 to €53.45 thousand in 2025. This growth could be a result of technological advancements, process efficiencies, or strategic investments in production facilities. The market's dynamics indicate a reliance on imports to meet consumption needs, alongside a growing domestic production capacity, reflecting the market's evolving competitive landscape and increasing demand for iodophor disinfectants in Croatia.
Key Highlights of the Report:
- Croatia Iodophor Disinfectant Market Outlook
- Market Size of Croatia Iodophor Disinfectant Market, 2025
- Forecast of Croatia Iodophor Disinfectant Market, 2032
- Historical Data and Forecast of Croatia Iodophor Disinfectant Revenues & Volume for the Period 2022 - 2032
- Croatia Iodophor Disinfectant Market Trend Evolution
- Croatia Iodophor Disinfectant Market Drivers and Challenges
- Croatia Iodophor Disinfectant Price Trends
- Croatia Iodophor Disinfectant Porter's Five Forces
- Croatia Iodophor Disinfectant Industry Life Cycle
- Historical Data and Forecast of Croatia Iodophor Disinfectant Market Revenues & Volume By Grade for the Period 2022 - 2032
- Historical Data and Forecast of Croatia Iodophor Disinfectant Market Revenues & Volume By Pharmaceutical for the Period 2022 - 2032
- Historical Data and Forecast of Croatia Iodophor Disinfectant Market Revenues & Volume By Industrial for the Period 2022 - 2032
- Historical Data and Forecast of Croatia Iodophor Disinfectant Market Revenues & Volume By Others for the Period 2022 - 2032
- Historical Data and Forecast of Croatia Iodophor Disinfectant Market Revenues & Volume By End-use for the Period 2022 - 2032
- Historical Data and Forecast of Croatia Iodophor Disinfectant Market Revenues & Volume By Medical for the Period 2022 - 2032
- Historical Data and Forecast of Croatia Iodophor Disinfectant Market Revenues & Volume By Food & Beverage for the Period 2022 - 2032
- Historical Data and Forecast of Croatia Iodophor Disinfectant Market Revenues & Volume By Household Disinfectant for the Period 2022 - 2032
- Historical Data and Forecast of Croatia Iodophor Disinfectant Market Revenues & Volume By Agriculture for the Period 2022 - 2032
- Historical Data and Forecast of Croatia Iodophor Disinfectant Market Revenues & Volume By Others for the Period 2022 - 2032
- Croatia Iodophor Disinfectant Import Export Trade Statistics
- Market Opportunity Assessment By Grade
- Market Opportunity Assessment By End-use
- Croatia Iodophor Disinfectant Top Companies Market Share
- Croatia Iodophor Disinfectant Competitive Benchmarking By Technical and Operational Parameters
- Croatia Iodophor Disinfectant Company Profiles
- Croatia Iodophor Disinfectant Key Strategic Recommendations
Frequently Asked Questions About the Market Study (FAQs):
6Wresearch actively monitors the Croatia Iodophor Disinfectant Market and publishes its comprehensive annual report, highlighting emerging trends, growth drivers, revenue analysis, and forecast outlook. Our insights help businesses to make data-backed strategic decisions with ongoing market dynamics. Our analysts track relevent industries related to the Croatia Iodophor Disinfectant Market, allowing our clients with actionable intelligence and reliable forecasts tailored to emerging regional needs.
Yes, we provide customisation as per your requirements. To learn more, feel free to contact us on sales@6wresearch.com
1 Executive Summary |
2 Introduction |
2.1 Key Highlights of the Report |
2.2 Report Description |
2.3 Market Scope & Segmentation |
2.4 Research Methodology |
2.5 Assumptions |
3 Croatia Iodophor Disinfectant Market Overview |
3.1 Croatia Country Macro Economic Indicators |
3.2 Croatia Iodophor Disinfectant Market Revenues & Volume, 2022 & 2032F |
3.3 Croatia Iodophor Disinfectant Market - Industry Life Cycle |
3.4 Croatia Iodophor Disinfectant Market - Porter's Five Forces |
3.5 Croatia Iodophor Disinfectant Market Revenues & Volume Share, By Grade, 2022 & 2032F |
3.6 Croatia Iodophor Disinfectant Market Revenues & Volume Share, By End-use, 2022 & 2032F |
4 Croatia Iodophor Disinfectant Market Dynamics |
4.1 Impact Analysis |
4.2 Market Drivers |
4.2.1 Increasing awareness about hygiene and sanitation |
4.2.2 Growing emphasis on infection control in healthcare facilities |
4.2.3 Rising demand for iodophor disinfectants in the food and beverage industry |
4.3 Market Restraints |
4.3.1 Stringent regulatory requirements for disinfectant products |
4.3.2 Competition from alternative disinfectants such as chlorine-based products |
4.3.3 Fluctuating raw material prices affecting product costs |
5 Croatia Iodophor Disinfectant Market Trends |
6 Croatia Iodophor Disinfectant Market, By Types |
6.1 Croatia Iodophor Disinfectant Market, By Grade |
6.1.1 Overview and Analysis |
6.1.2 Croatia Iodophor Disinfectant Market Revenues & Volume, By Grade, 2022 - 2032F |
6.1.3 Croatia Iodophor Disinfectant Market Revenues & Volume, By Pharmaceutical, 2022 - 2032F |
6.1.4 Croatia Iodophor Disinfectant Market Revenues & Volume, By Industrial, 2022 - 2032F |
6.1.5 Croatia Iodophor Disinfectant Market Revenues & Volume, By Others, 2022 - 2032F |
6.2 Croatia Iodophor Disinfectant Market, By End-use |
6.2.1 Overview and Analysis |
6.2.2 Croatia Iodophor Disinfectant Market Revenues & Volume, By Medical, 2022 - 2032F |
6.2.3 Croatia Iodophor Disinfectant Market Revenues & Volume, By Food & Beverage, 2022 - 2032F |
6.2.4 Croatia Iodophor Disinfectant Market Revenues & Volume, By Household Disinfectant, 2022 - 2032F |
6.2.5 Croatia Iodophor Disinfectant Market Revenues & Volume, By Agriculture, 2022 - 2032F |
6.2.6 Croatia Iodophor Disinfectant Market Revenues & Volume, By Others, 2022 - 2032F |
7 Croatia Iodophor Disinfectant Market Import-Export Trade Statistics |
7.1 Croatia Iodophor Disinfectant Market Export to Major Countries |
7.2 Croatia Iodophor Disinfectant Market Imports from Major Countries |
8 Croatia Iodophor Disinfectant Market Key Performance Indicators |
8.1 Number of healthcare facilities using iodophor disinfectants |
8.2 Percentage of food and beverage companies adopting iodophor disinfectants |
8.3 Rate of new product development and innovation in the iodophor disinfectant market. |
9 Croatia Iodophor Disinfectant Market - Opportunity Assessment |
9.1 Croatia Iodophor Disinfectant Market Opportunity Assessment, By Grade, 2022 & 2032F |
9.2 Croatia Iodophor Disinfectant Market Opportunity Assessment, By End-use, 2022 & 2032F |
10 Croatia Iodophor Disinfectant Market - Competitive Landscape |
10.1 Croatia Iodophor Disinfectant Market Revenue Share, By Companies, 2025 |
10.2 Croatia Iodophor Disinfectant Market Competitive Benchmarking, By Operating and Technical Parameters |
11 Company Profiles |
12 Recommendations |
13 Disclaimer |
Export potential assessment - trade Analytics for 2030
Export potential enables firms to identify high-growth global markets with greater confidence by combining advanced trade intelligence with a structured quantitative methodology. The framework analyzes emerging demand trends and country-level import patterns while integrating macroeconomic and trade datasets such as GDP and population forecasts, bilateral import–export flows, tariff structures, elasticity differentials between developed and developing economies, geographic distance, and import demand projections. Using weighted trade values from 2020–2024 as the base period to project country-to-country export potential for 2030, these inputs are operationalized through calculated drivers such as gravity model parameters, tariff impact factors, and projected GDP per-capita growth. Through an analysis of hidden potentials, demand hotspots, and market conditions that are most favorable to success, this method enables firms to focus on target countries, maximize returns, and global expansion with data, backed by accuracy.
By factoring in the projected importer demand gap that is currently unmet and could be potential opportunity, it identifies the potential for the Exporter (Country) among 190 countries, against the general trade analysis, which identifies the biggest importer or exporter.
To discover high-growth global markets and optimize your business strategy:
Click Here
Pricing
- Single User License$ 1,995
- Department License$ 2,400
- Site License$ 3,120
- Global License$ 3,795

Search
Thought Leadership and Analyst Meet


Our Clients
Latest Reports
- China Electric Appliance Rental Market (2026-2032) | Trends, Revenue, Growth, Challenges, Size, Value, Outlook, Pricing, Strategy, Insights, Restraints, segmentation, Companies, Investment Opportunities, Analysis, Demand, Drivers, Competition, Forecast, Share
- Chile Electric Appliance Rental Market (2026-2032) | Outlook, Competition, Drivers, Strategy, Revenue, Analysis, Value, Pricing, Restraints, Size, Demand, Share, Growth, Forecast, Challenges, Insights, Investment Opportunities, Companies, Trends, segmentation
- Cambodia Electric Appliance Rental Market (2026-2032) | Companies, Analysis, Restraints, Pricing, Insights, Challenges, Outlook, Strategy, Forecast, Trends, Competition, Value, Revenue, Investment Opportunities, segmentation, Drivers, Size, Demand, Growth, Share
- Brazil Electric Appliance Rental Market (2026-2032) | Revenue, Strategy, Forecast, Companies, segmentation, Competition, Size, Investment Opportunities, Pricing, Restraints, Outlook, Challenges, Analysis, Drivers, Value, Demand, Insights, Trends, Growth, Share
- Bangladesh Electric Appliance Rental Market (2026-2032) | Drivers, Forecast, Investment Opportunities, Strategy, Insights, Demand, Challenges, Outlook, Trends, Competition, Value, Revenue, Size, Pricing, Analysis, Companies, Restraints, segmentation, Share, Growth
- Bahrain Electric Appliance Rental Market (2026-2032) | Outlook, Size, Competition, Restraints, Drivers, Value, Trends, Investment Opportunities, Insights, Forecast, Revenue, Strategy, Growth, Share, Demand, Analysis, Challenges, Companies, segmentation, Pricing
- Azerbaijan Electric Appliance Rental Market (2026-2032) | Trends, Investment Opportunities, Restraints, Insights, Strategy, Competition, Value, Growth, Demand, Drivers, Analysis, Forecast, Size, Share, Outlook, segmentation, Pricing, Challenges, Revenue, Companies
- Australia Electric Appliance Rental Market (2026-2032) | Challenges, Restraints, Forecast, Demand, Size, Competition, Pricing, Investment Opportunities, Revenue, Trends, Drivers, Growth, Outlook, Analysis, Strategy, Value, segmentation, Insights, Companies, Share
- Argentina Electric Appliance Rental Market (2026-2032) | Growth, Trends, Insights, Outlook, Forecast, Size, Drivers, Analysis, Restraints, Challenges, Share, Revenue, Investment Opportunities, Strategy, Demand, Value, Companies, segmentation, Competition, Pricing
- Algeria Electric Appliance Rental Market (2026-2032) | Share, Size, Value, Strategy, Competition, Outlook, Challenges, Companies, Trends, Pricing, Insights, Forecast, Investment Opportunities, Revenue, Growth, Restraints, segmentation, Analysis, Demand, Drivers
Industry Events and Analyst Meet

HIMTEX 2026

India Refining Summit 2026

India EV Show 2026

EV tech India Expo 2026

Auto Tech Asia 2026
Whitepaper
- Middle East & Africa Commercial Security Market Click here to view more.
- Middle East & Africa Fire Safety Systems & Equipment Market Click here to view more.
- GCC Drone Market Click here to view more.
- Middle East Lighting Fixture Market Click here to view more.
- GCC Physical & Perimeter Security Market Click here to view more.
6WResearch In News
- Doha a strategic location for EV manufacturing hub: IPA Qatar
- Demand for luxury TVs surging in the GCC, says Samsung
- Empowering Growth: The Thriving Journey of Bangladesh’s Cable Industry
- Demand for luxury TVs surging in the GCC, says Samsung
- Video call with a traditional healer? Once unthinkable, it’s now common in South Africa
- Intelligent Buildings To Smooth GCC’s Path To Net Zero