Croatia Lactic Acid Market (2025-2031) | Outlook, Trends, Analysis, Revenue, Value, Share, Forecast, Industry, Growth, Segmentation, Companies & Size
Market Forecast By Raw Material (Corn, Sugarcane, Cassava, Other Crops), By Applications (Industrial, Food & Beverages, Pharmaceuticals, Personal Care, Polylactic Acid, Others) And Competitive Landscape
| Product Code: ETC4683218 | Publication Date: Nov 2023 | Updated Date: Oct 2025 | Product Type: Market Research Report | |
| Publisher: 6Wresearch | Author: Shubham Deep | No. of Pages: 60 | No. of Figures: 30 | No. of Tables: 5 |
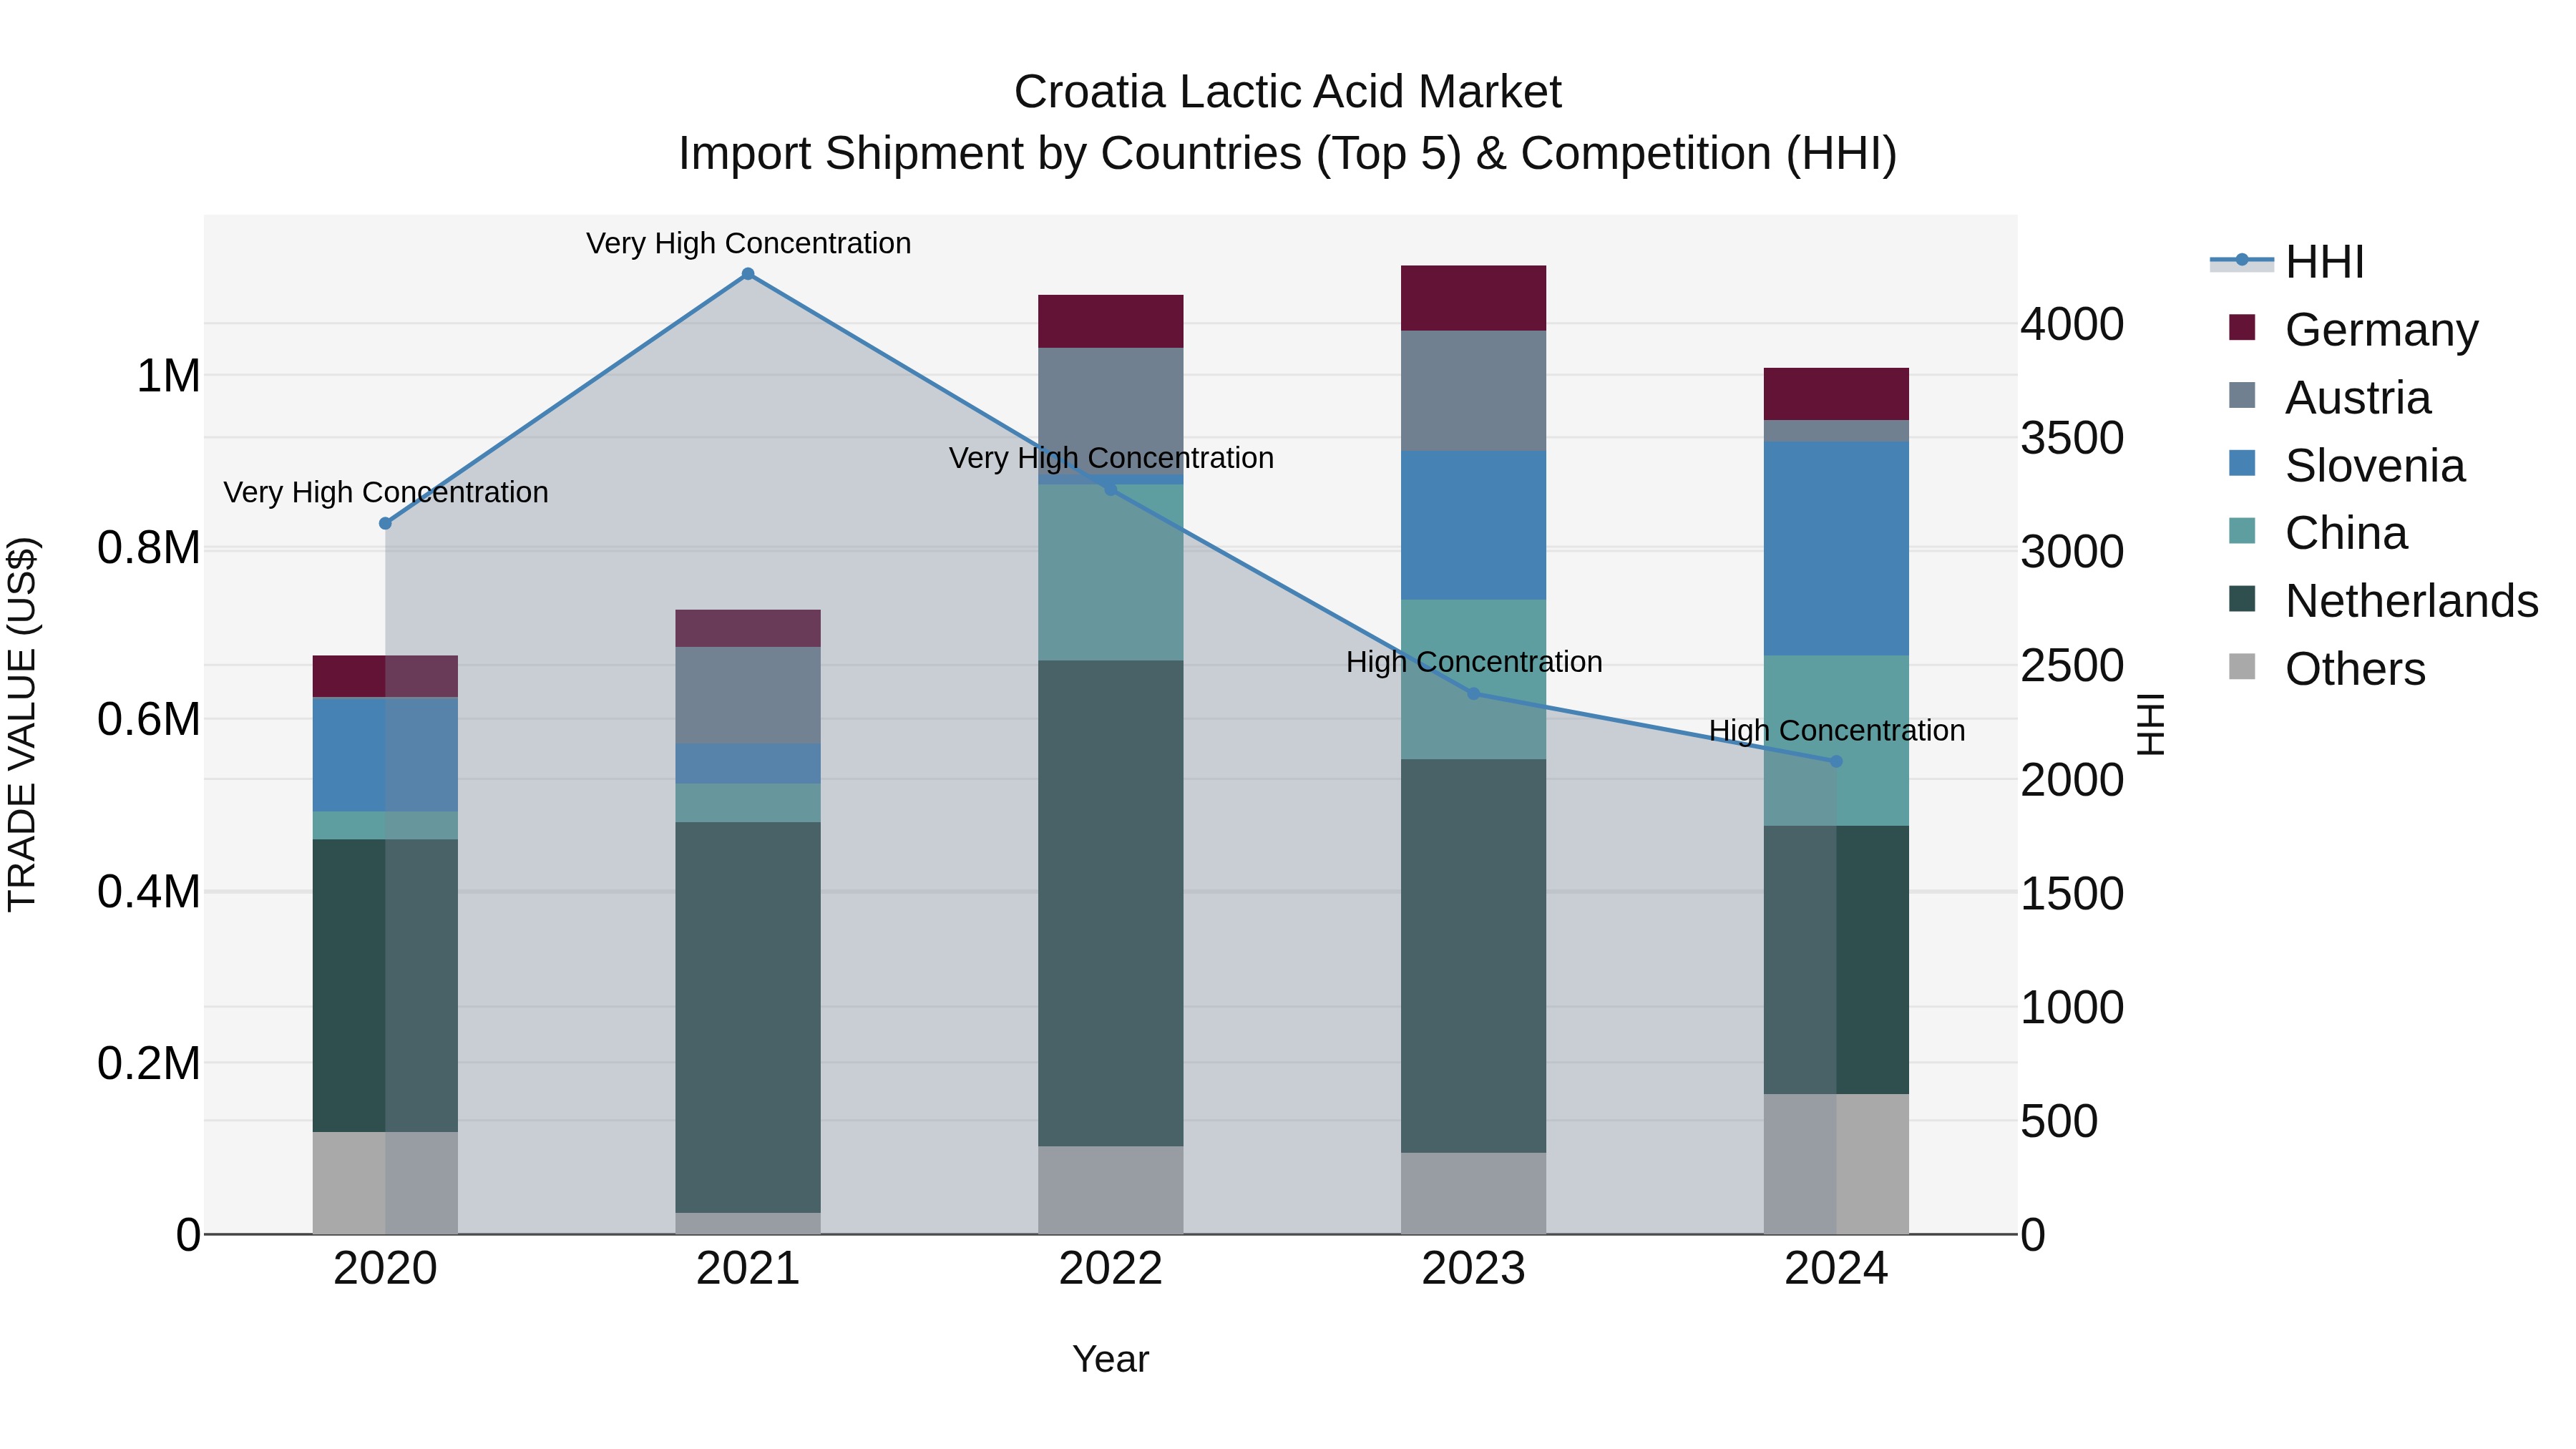
Croatia Lactic Acid Market Top 5 Importing Countries and Market Competition (HHI) Analysis
Croatia lactic acid import market in 2024 saw significant contributions from top exporting countries like the Netherlands, Slovenia, China, Belgium, and Germany. The high Herfindahl-Hirschman Index (HHI) indicates a concentrated market landscape. Despite a notable compound annual growth rate (CAGR) of 10.61% from 2020 to 2024, there was a slight decline in growth rate from 2023 to 2024 at -10.56%. This trend suggests a stable market with room for potential shifts in the coming years, possibly influenced by various factors impacting global trade dynamics.
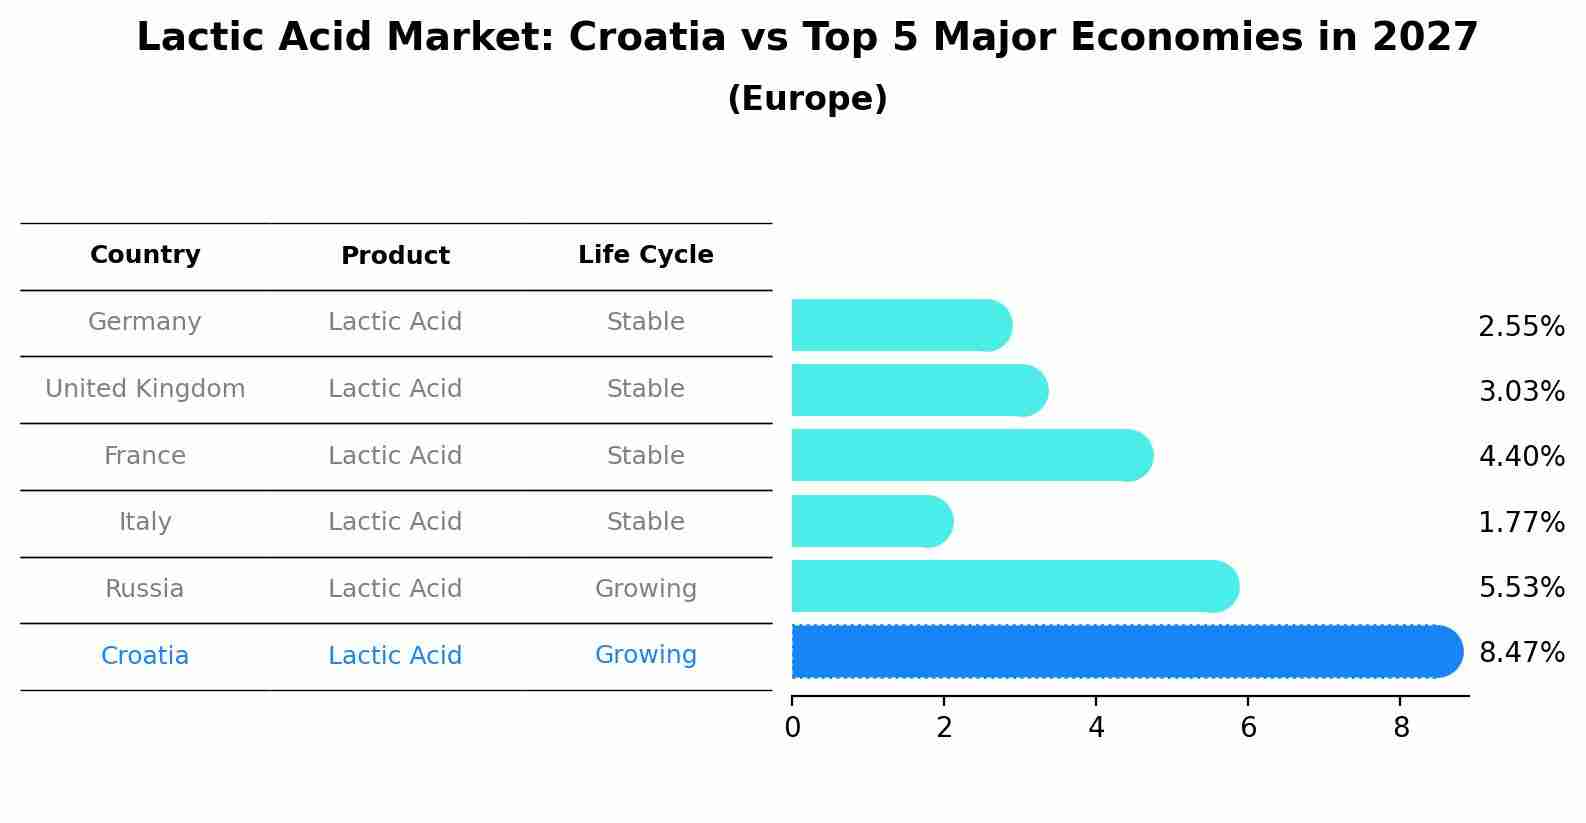
Lactic Acid Market: Croatia vs Top 5 Major Economies in 2027 (Europe)
The Lactic Acid market in Croatia is projected to grow at a growing growth rate of 8.47% by 2027, highlighting the country's increasing focus on advanced technologies within the Europe region, where Germany holds the dominant position, followed closely by United Kingdom, France, Italy and Russia, shaping overall regional demand.
Croatia Lactic Acid Market Overview
Croatia`s lactic acid market is experiencing growth due to its wide application in industries such as food and beverage, pharmaceuticals, and cosmetics. Lactic acid is used as a preservative, pH regulator, and flavoring agent, with increasing demand for its natural and biodegradable properties. The growing focus on sustainable and organic products is a key driver for this market.
Drivers of the market
The lactic acid market in Croatia is driven by its growing applications in the food and beverage, pharmaceutical, and cosmetics industries. Increased consumer interest in natural and eco-friendly products and expanding use of lactic acid in bioplastics contribute to the markets growth.
Challenges of the market
The Lactic Acid Market in Croatia experiences challenges due to the high cost of production and the complexity of the fermentation process required to manufacture lactic acid. Additionally, competition from synthetic chemical alternatives puts pressure on pricing. Regulatory challenges concerning the use of lactic acid in certain applications, particularly in food and beverages, further complicate the market environment.
Government Policy of the market
The production and use of lactic acid in Croatia are regulated under food safety and industrial manufacturing policies. Government policies focus on ensuring that lactic acid used in food, beverages, and pharmaceuticals complies with safety standards as dictated by both local and EU regulations. These policies have a significant impact on market trends, as producers must adhere to strict manufacturing protocols.
Key Highlights of the Report:
- Croatia Lactic Acid Market Outlook
- Market Size of Croatia Lactic Acid Market, 2024
- Forecast of Croatia Lactic Acid Market, 2031
- Historical Data and Forecast of Croatia Lactic Acid Revenues & Volume for the Period 2021-2031
- Croatia Lactic Acid Market Trend Evolution
- Croatia Lactic Acid Market Drivers and Challenges
- Croatia Lactic Acid Price Trends
- Croatia Lactic Acid Porter`s Five Forces
- Croatia Lactic Acid Industry Life Cycle
- Historical Data and Forecast of Croatia Lactic Acid Market Revenues & Volume By Raw Material for the Period 2021-2031
- Historical Data and Forecast of Croatia Lactic Acid Market Revenues & Volume By Corn for the Period 2021-2031
- Historical Data and Forecast of Croatia Lactic Acid Market Revenues & Volume By Sugarcane for the Period 2021-2031
- Historical Data and Forecast of Croatia Lactic Acid Market Revenues & Volume By Cassava for the Period 2021-2031
- Historical Data and Forecast of Croatia Lactic Acid Market Revenues & Volume By Other Crops for the Period 2021-2031
- Historical Data and Forecast of Croatia Lactic Acid Market Revenues & Volume By Applications for the Period 2021-2031
- Historical Data and Forecast of Croatia Lactic Acid Market Revenues & Volume By Industrial for the Period 2021-2031
- Historical Data and Forecast of Croatia Lactic Acid Market Revenues & Volume By Food & Beverages for the Period 2021-2031
- Historical Data and Forecast of Croatia Lactic Acid Market Revenues & Volume By Pharmaceuticals for the Period 2021-2031
- Historical Data and Forecast of Croatia Lactic Acid Market Revenues & Volume By Personal Care for the Period 2021-2031
- Historical Data and Forecast of Croatia Lactic Acid Market Revenues & Volume By Polylactic Acid for the Period 2021-2031
- Historical Data and Forecast of Croatia Lactic Acid Market Revenues & Volume By Others for the Period 2021-2031
- Croatia Lactic Acid Import Export Trade Statistics
- Market Opportunity Assessment By Raw Material
- Market Opportunity Assessment By Applications
- Croatia Lactic Acid Top Companies Market Share
- Croatia Lactic Acid Competitive Benchmarking By Technical and Operational Parameters
- Croatia Lactic Acid Company Profiles
- Croatia Lactic Acid Key Strategic Recommendations
Frequently Asked Questions About the Market Study (FAQs):
6Wresearch actively monitors the Croatia Lactic Acid Market and publishes its comprehensive annual report, highlighting emerging trends, growth drivers, revenue analysis, and forecast outlook. Our insights help businesses to make data-backed strategic decisions with ongoing market dynamics. Our analysts track relevent industries related to the Croatia Lactic Acid Market, allowing our clients with actionable intelligence and reliable forecasts tailored to emerging regional needs.
Yes, we provide customisation as per your requirements. To learn more, feel free to contact us on sales@6wresearch.com
1 Executive Summary |
2 Introduction |
2.1 Key Highlights of the Report |
2.2 Report Description |
2.3 Market Scope & Segmentation |
2.4 Research Methodology |
2.5 Assumptions |
3 Croatia Lactic Acid Market Overview |
3.1 Croatia Country Macro Economic Indicators |
3.2 Croatia Lactic Acid Market Revenues & Volume, 2021 & 2031F |
3.3 Croatia Lactic Acid Market - Industry Life Cycle |
3.4 Croatia Lactic Acid Market - Porter's Five Forces |
3.5 Croatia Lactic Acid Market Revenues & Volume Share, By Raw Material, 2021 & 2031F |
3.6 Croatia Lactic Acid Market Revenues & Volume Share, By Applications, 2021 & 2031F |
4 Croatia Lactic Acid Market Dynamics |
4.1 Impact Analysis |
4.2 Market Drivers |
4.3 Market Restraints |
5 Croatia Lactic Acid Market Trends |
6 Croatia Lactic Acid Market Segmentations |
6.1 Croatia Lactic Acid Market, By Raw Material |
6.1.1 Overview and Analysis |
6.1.2 Croatia Lactic Acid Market Revenues & Volume, By Corn, 2021-2031F |
6.1.3 Croatia Lactic Acid Market Revenues & Volume, By Sugarcane, 2021-2031F |
6.1.4 Croatia Lactic Acid Market Revenues & Volume, By Cassava, 2021-2031F |
6.1.5 Croatia Lactic Acid Market Revenues & Volume, By Other Crops, 2021-2031F |
6.2 Croatia Lactic Acid Market, By Applications |
6.2.1 Overview and Analysis |
6.2.2 Croatia Lactic Acid Market Revenues & Volume, By Industrial, 2021-2031F |
6.2.3 Croatia Lactic Acid Market Revenues & Volume, By Food & Beverages, 2021-2031F |
6.2.4 Croatia Lactic Acid Market Revenues & Volume, By Pharmaceuticals, 2021-2031F |
6.2.5 Croatia Lactic Acid Market Revenues & Volume, By Personal Care, 2021-2031F |
6.2.6 Croatia Lactic Acid Market Revenues & Volume, By Polylactic Acid, 2021-2031F |
6.2.7 Croatia Lactic Acid Market Revenues & Volume, By Others, 2021-2031F |
7 Croatia Lactic Acid Market Import-Export Trade Statistics |
7.1 Croatia Lactic Acid Market Export to Major Countries |
7.2 Croatia Lactic Acid Market Imports from Major Countries |
8 Croatia Lactic Acid Market Key Performance Indicators |
9 Croatia Lactic Acid Market - Opportunity Assessment |
9.1 Croatia Lactic Acid Market Opportunity Assessment, By Raw Material, 2021 & 2031F |
9.2 Croatia Lactic Acid Market Opportunity Assessment, By Applications, 2021 & 2031F |
10 Croatia Lactic Acid Market - Competitive Landscape |
10.1 Croatia Lactic Acid Market Revenue Share, By Companies, 2024 |
10.2 Croatia Lactic Acid Market Competitive Benchmarking, By Operating and Technical Parameters |
11 Company Profiles |
12 Recommendations | 13 Disclaimer |
Global Go To Market Strategy - 2030
Export potential enables firms to identify high-growth global markets with greater confidence by combining advanced trade intelligence with a structured quantitative methodology. The framework analyzes emerging demand trends and country-level import patterns while integrating macroeconomic and trade datasets such as GDP and population forecasts, bilateral import–export flows, tariff structures, elasticity differentials between developed and developing economies, geographic distance, and import demand projections. Using weighted trade values from 2020–2024 as the base period to project country-to-country export potential for 2030, these inputs are operationalized through calculated drivers such as gravity model parameters, tariff impact factors, and projected GDP per-capita growth. Through an analysis of hidden potentials, demand hotspots, and market conditions that are most favorable to success, this method enables firms to focus on target countries, maximize returns, and global expansion with data, backed by accuracy.
By factoring in the projected importer demand gap that is currently unmet and could be potential opportunity, it identifies the potential for the Exporter (Country) among 190 countries, against the general trade analysis, which identifies the biggest importer or exporter.
To discover high-growth global markets and optimize your business strategy:
Click Here
Pricing
- Single User License$ 1,995
- Department License$ 2,400
- Site License$ 3,120
- Global License$ 3,795

Leadership Perspectives from Industry Events
Search
Thought Leadership and Analyst Meet


Our Clients
6WResearch In News
- Doha a strategic location for EV manufacturing hub: IPA Qatar
- Demand for luxury TVs surging in the GCC, says Samsung
- Empowering Growth: The Thriving Journey of Bangladesh’s Cable Industry
- Demand for luxury TVs surging in the GCC, says Samsung
- Video call with a traditional healer? Once unthinkable, it’s now common in South Africa
- Intelligent Buildings To Smooth GCC’s Path To Net Zero
Latest Reports
- New Zealand Aseptic Manufacturing Market (2026-2032)
- Netherlands Aseptic Manufacturing Market (2026-2032)
- Nauru Aseptic Manufacturing Market (2026-2032)
- Namibia Aseptic Manufacturing Market (2026-2032)
- Mozambique Aseptic Manufacturing Market (2026-2032)
- Montenegro Aseptic Manufacturing Market (2026-2032)
- Mongolia Aseptic Manufacturing Market (2026-2032)
- Monaco Aseptic Manufacturing Market (2026-2032)
- Micronesia Aseptic Manufacturing Market (2026-2032)
- Mauritius Aseptic Manufacturing Market (2026-2032)
Industry Events and Analyst Meet

HIMTEX 2026

India Refining Summit 2026

India EV Show 2026

EV tech India Expo 2026

Auto Tech Asia 2026
Whitepaper
- Middle East & Africa Commercial Security Market Click here to view more.
- Middle East & Africa Fire Safety Systems & Equipment Market Click here to view more.
- GCC Drone Market Click here to view more.
- Middle East Lighting Fixture Market Click here to view more.
- GCC Physical & Perimeter Security Market Click here to view more.