Croatia Lignin Derivatives Market (2026-2032) | Consumer Insights, Forecast, Growth, Segments, Opportunities, Size, Investment Trends, Industry, Share, Restraints, Drivers, Challenges, Outlook, Segmentation, Revenue, Demand, Strategy, Companies, Strategic Insights, Competitive, Competition, Supply, Trends, Pricing Analysis, Value, Analysis
Market Forecast By Technology Type (Sulfonation, Oxidation, Hydrogenation), By Application (Concrete Additives, Animal Feed, Cosmetics, Dye Production), By End User (Construction Companies, Livestock Farmers, Personal Care Manufacturers, Textile Industries), By Product Type (Lignosulfonates, Vanillin, Phenolic Resins, Kraft Lignin) And Competitive Landscape
| Product Code: ETC12535637 | Publication Date: Apr 2025 | Updated Date: Apr 2026 | Product Type: Market Research Report | |
| Publisher: 6Wresearch | Author: Sachin Kumar Rai | No. of Pages: 65 | No. of Figures: 34 | No. of Tables: 19 |
Croatia Lignin Derivatives Market Size (2020-2030)
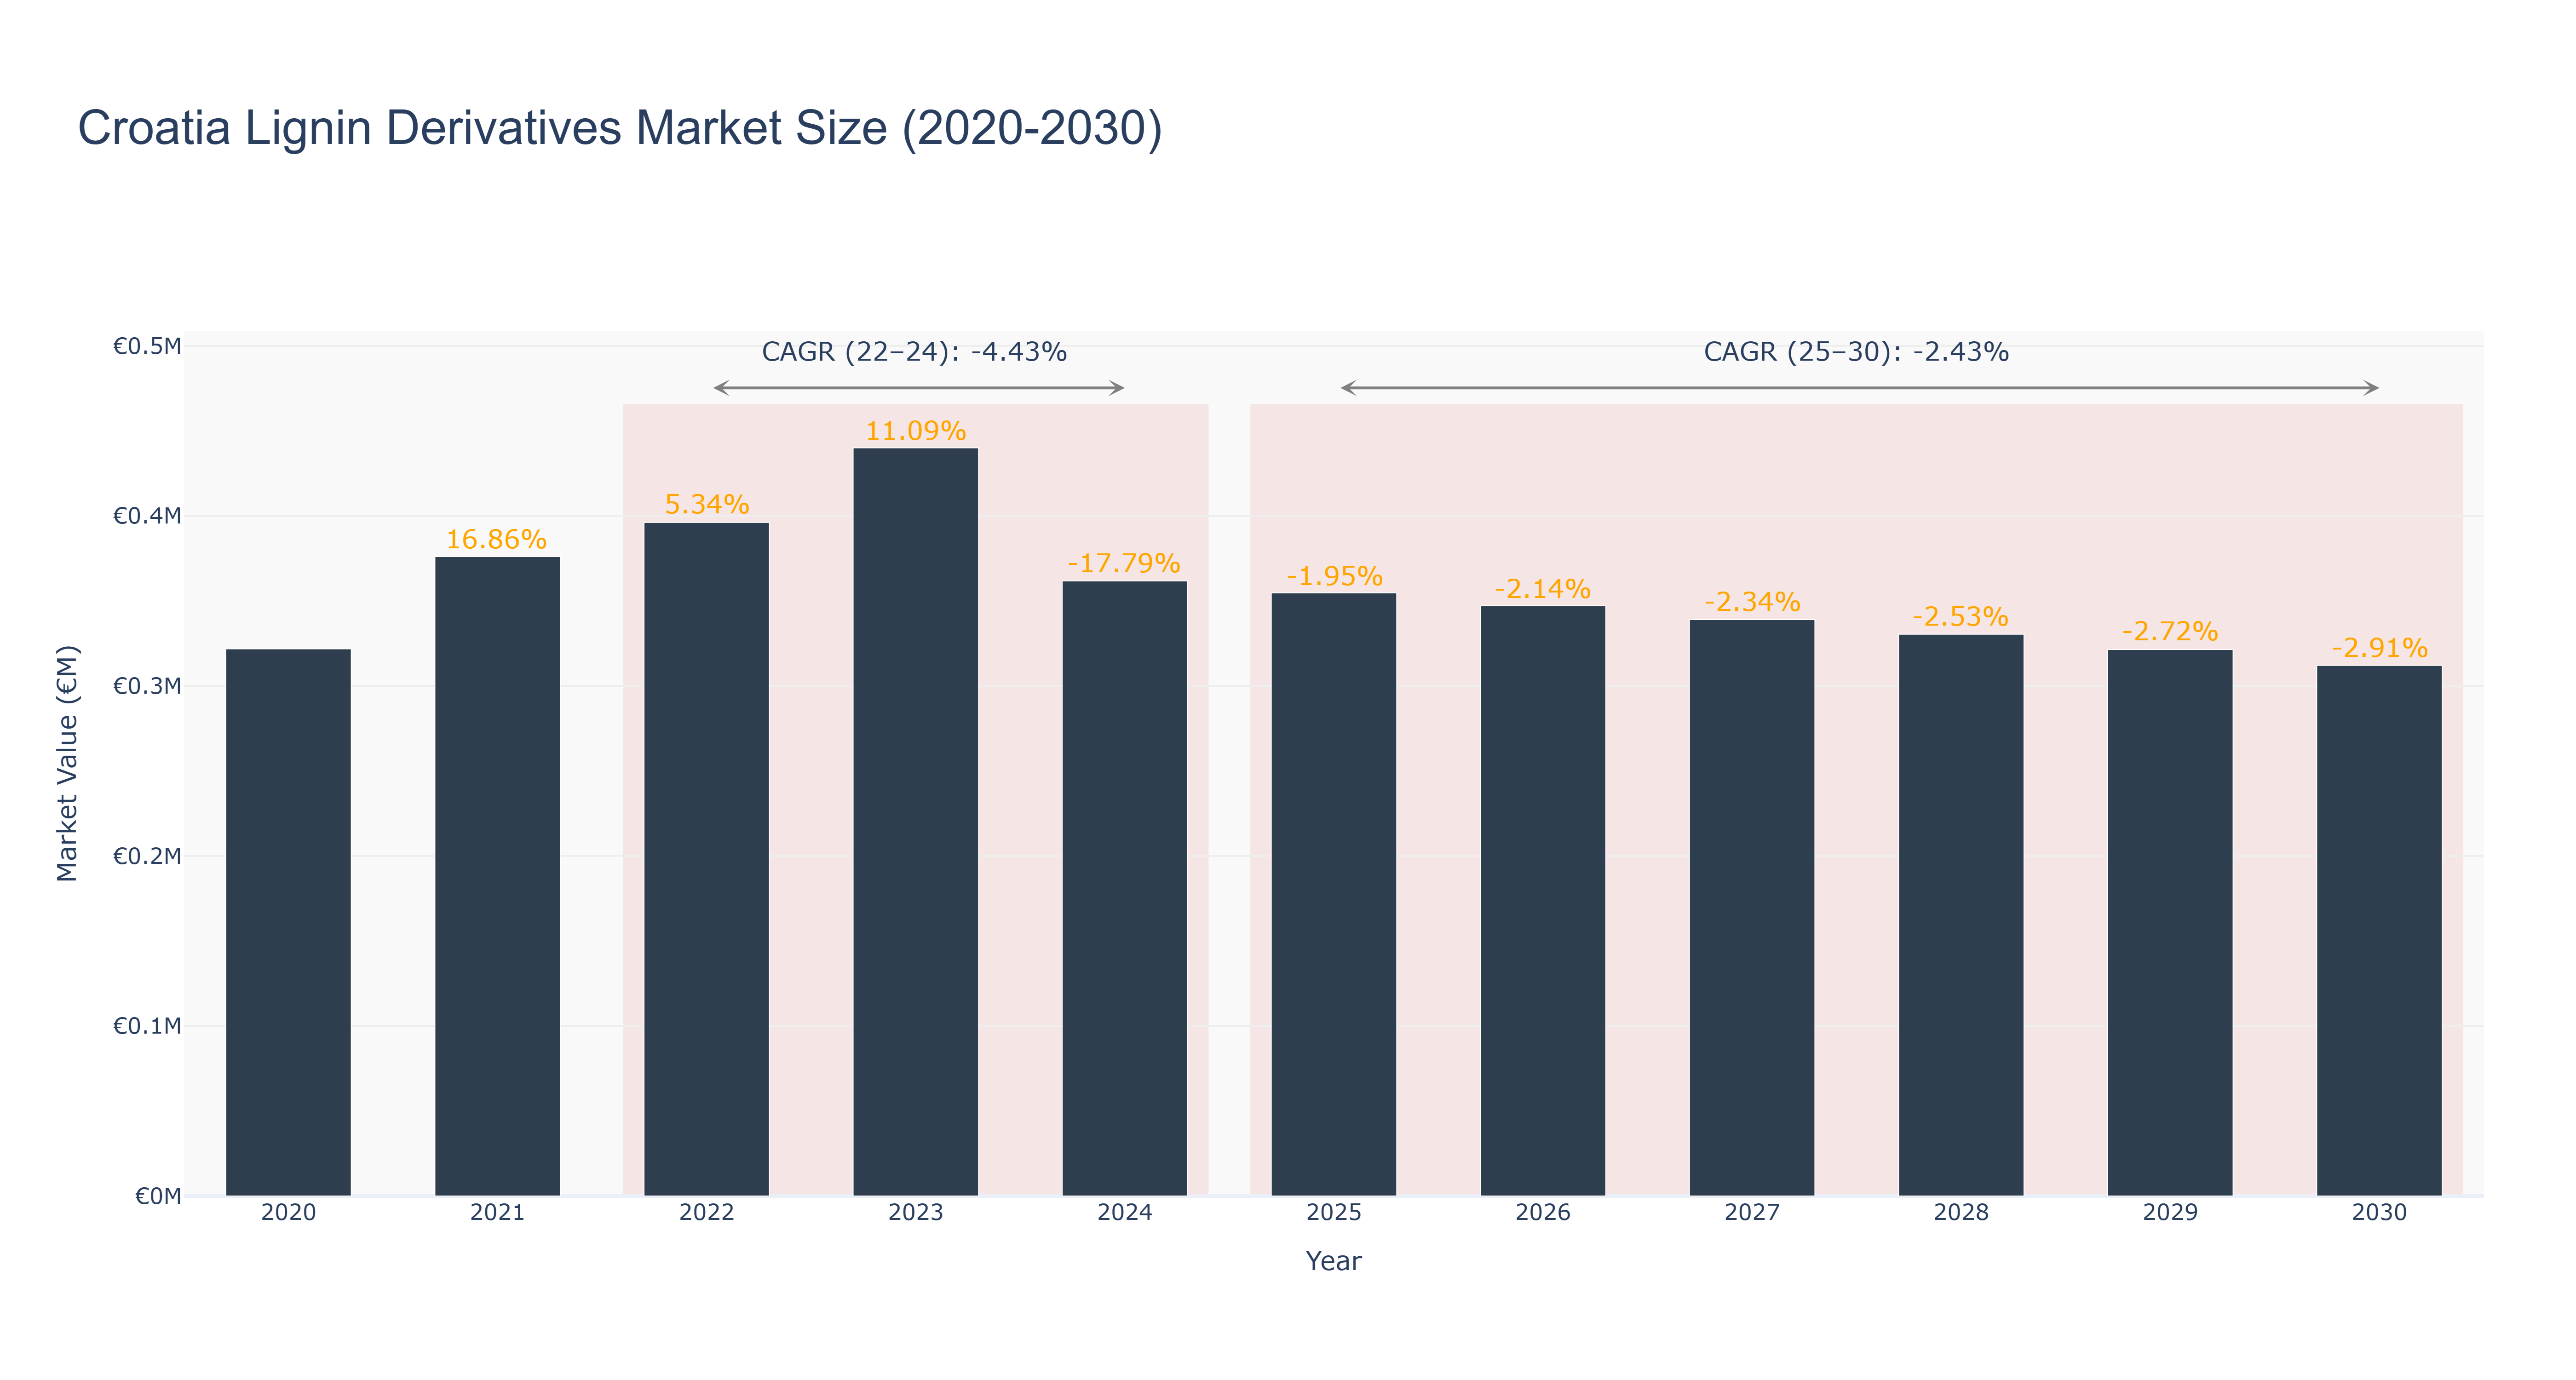
Croatia's Lignin Derivatives Market experienced a peak market size of €0.44 million in 2023, followed by a decline to €0.36 million in 2024. The market is forecasted to continue its downward trend, with an expected size of €0.31 million by 2030. The CAGR for the period 2022-24 was -4.43%, while for 2025-30, it is projected to be -2.43%. The market faced challenges due to factors such as regulatory changes impacting production costs and a decrease in demand from key industries. Looking ahead, Croatia's lignin derivatives market is expected to see investments in sustainable production methods and collaborations with research institutions to develop innovative applications for lignin-based products. These initiatives aim to revitalize the market and drive future growth despite current challenges.
Croatia Lignin Derivatives Market: Production & Trade Performance (2019-2025)
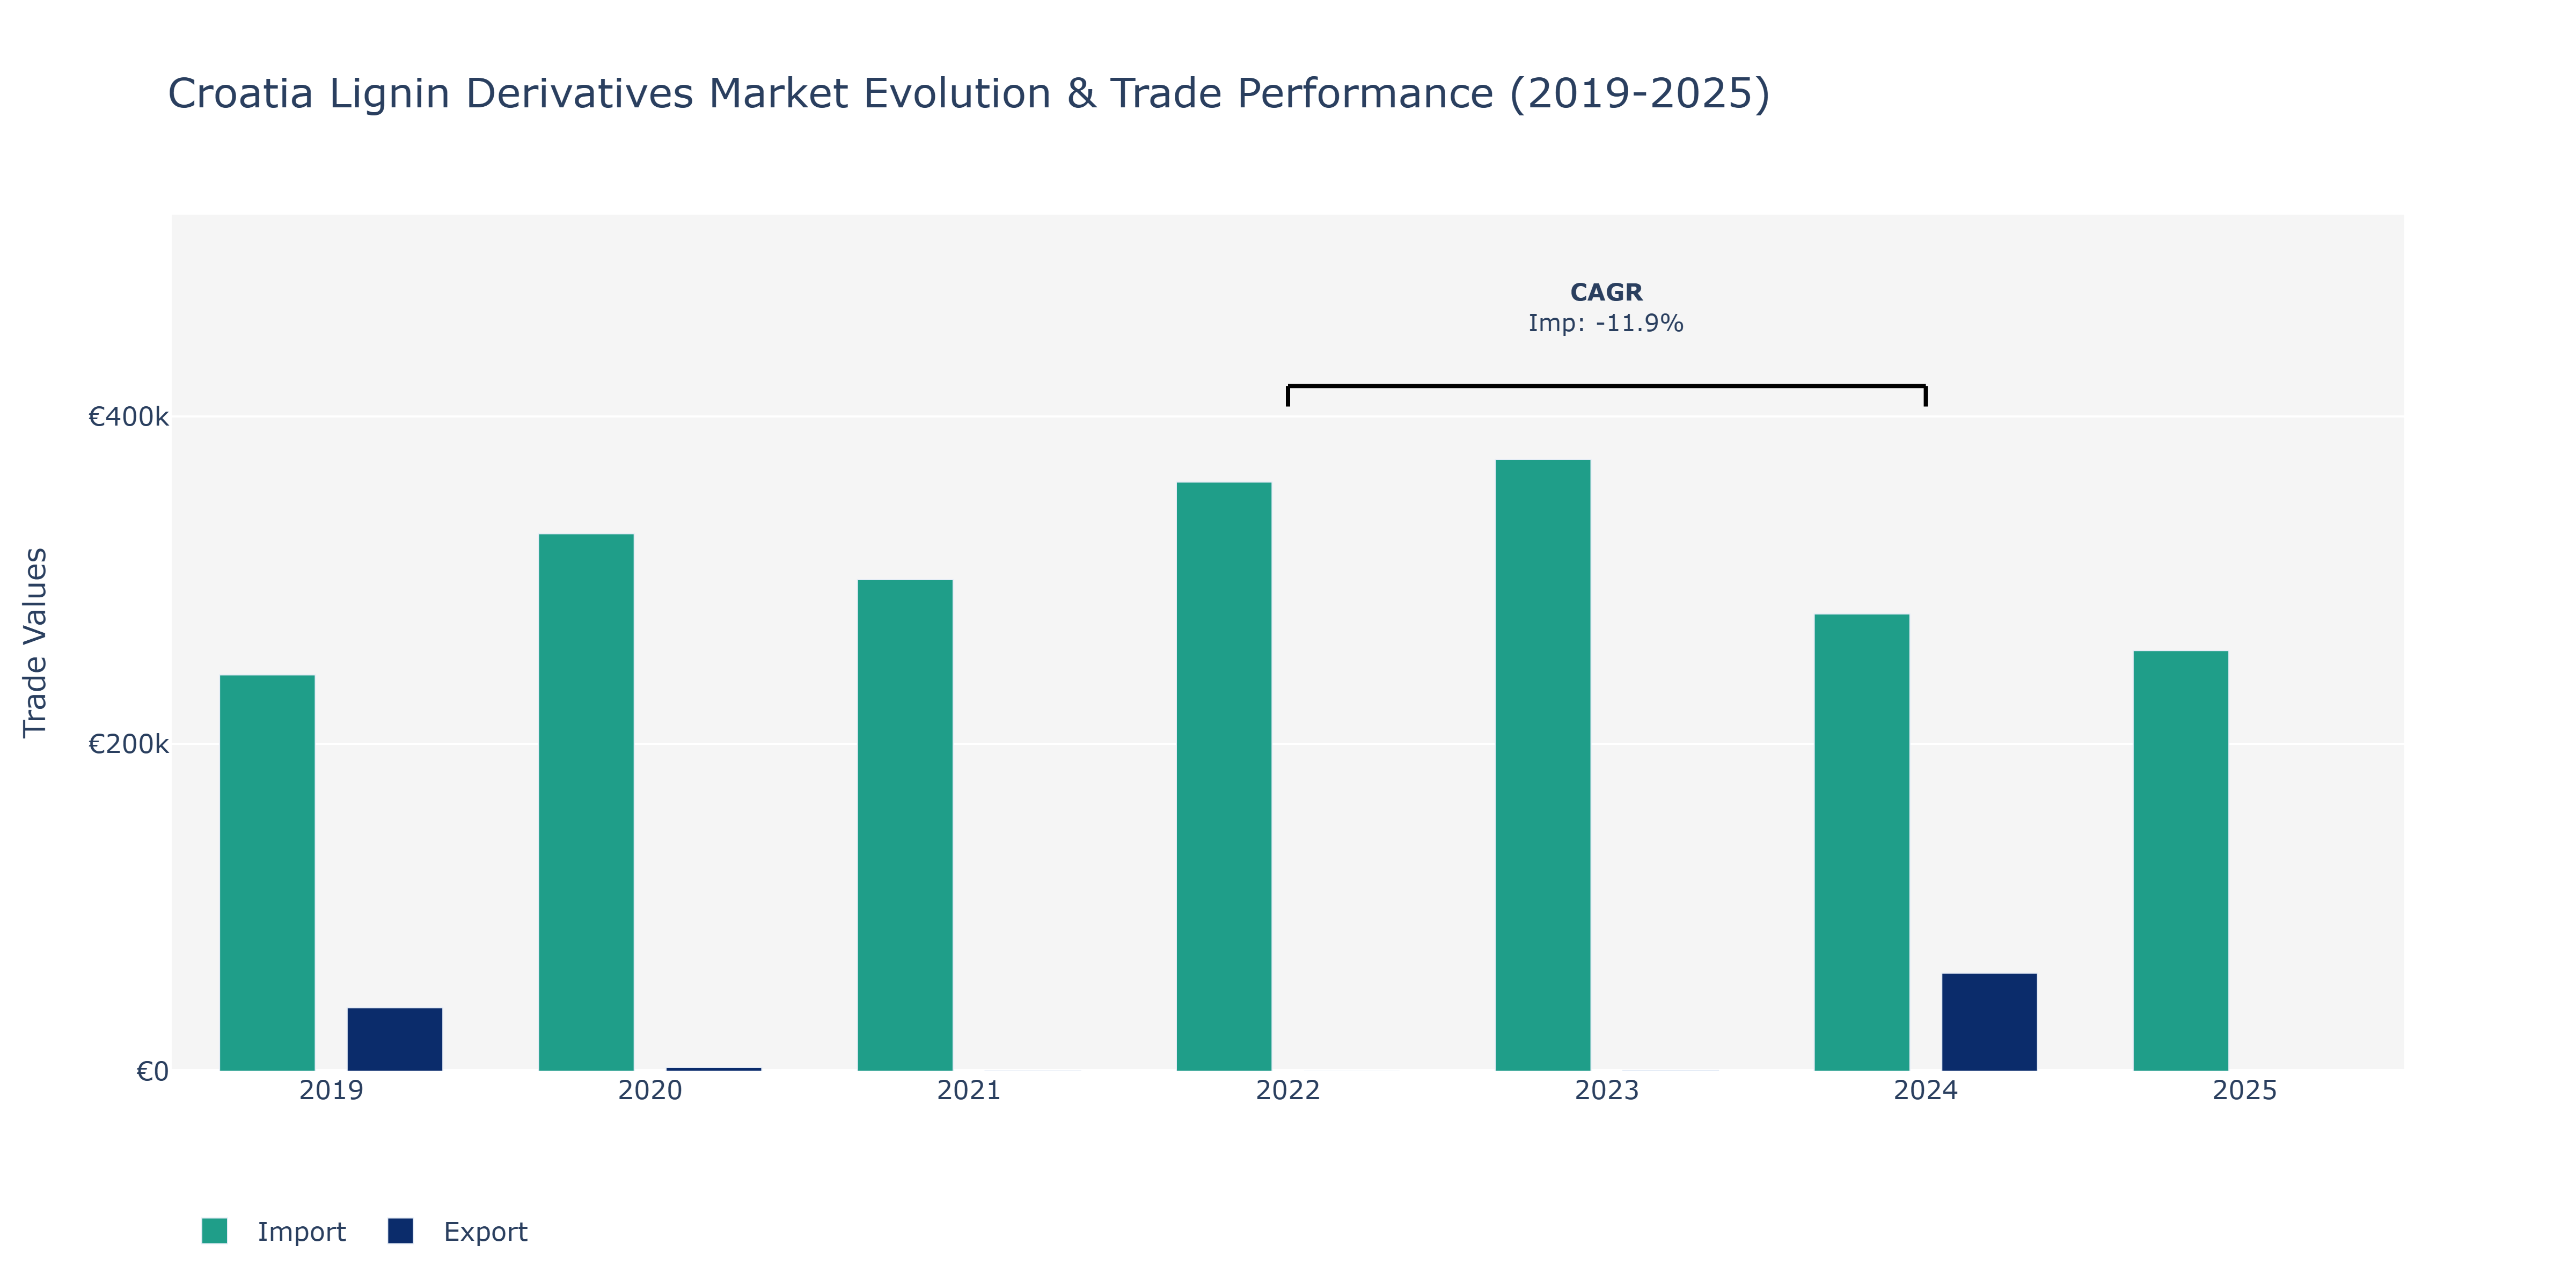
In the Croatia Lignin Derivatives Market, exports experienced notable fluctuations over the years. In 2019, exports were at €38.74 thousand, decreasing significantly to €2.28 thousand in 2020, before plummeting to just €146 thousand in 2021. However, a substantial recovery was seen in 2024, with exports reaching €59.84 thousand. On the other hand, imports followed a different trajectory, standing at €242.11 thousand in 2019, increasing to €328.35 thousand in 2020, and then slightly decreasing to €300.39 thousand in 2021. The lowest point for imports was in 2022 at €359.9 thousand, followed by a recovery to €373.79 thousand in 2023 and then dropping to €279.33 thousand in 2024, with a slight uptick to €256.97 thousand in 2025. Such fluctuations could be attributed to various factors, including market demand shifts, changes in global trade policies impacting Croatia, and developments in the domestic lignin derivatives industry.
Key Highlights of the Report:
- Croatia Lignin Derivatives Market Outlook
- Market Size of Croatia Lignin Derivatives Market, 2025
- Forecast of Croatia Lignin Derivatives Market, 2032
- Historical Data and Forecast of Croatia Lignin Derivatives Revenues & Volume for the Period 2022 - 2032F
- Croatia Lignin Derivatives Market Trend Evolution
- Croatia Lignin Derivatives Market Drivers and Challenges
- Croatia Lignin Derivatives Price Trends
- Croatia Lignin Derivatives Porter's Five Forces
- Croatia Lignin Derivatives Industry Life Cycle
- Historical Data and Forecast of Croatia Lignin Derivatives Market Revenues & Volume By Technology Type for the Period 2022 - 2032F
- Historical Data and Forecast of Croatia Lignin Derivatives Market Revenues & Volume By Sulfonation for the Period 2022 - 2032F
- Historical Data and Forecast of Croatia Lignin Derivatives Market Revenues & Volume By Oxidation for the Period 2022 - 2032F
- Historical Data and Forecast of Croatia Lignin Derivatives Market Revenues & Volume By Hydrogenation for the Period 2022 - 2032F
- Historical Data and Forecast of Croatia Lignin Derivatives Market Revenues & Volume By Application for the Period 2022 - 2032F
- Historical Data and Forecast of Croatia Lignin Derivatives Market Revenues & Volume By Concrete Additives for the Period 2022 - 2032F
- Historical Data and Forecast of Croatia Lignin Derivatives Market Revenues & Volume By Animal Feed for the Period 2022 - 2032F
- Historical Data and Forecast of Croatia Lignin Derivatives Market Revenues & Volume By Cosmetics for the Period 2022 - 2032F
- Historical Data and Forecast of Croatia Lignin Derivatives Market Revenues & Volume By Dye Production for the Period 2022 - 2032F
- Historical Data and Forecast of Croatia Lignin Derivatives Market Revenues & Volume By End User for the Period 2022 - 2032F
- Historical Data and Forecast of Croatia Lignin Derivatives Market Revenues & Volume By Construction Companies for the Period 2022 - 2032F
- Historical Data and Forecast of Croatia Lignin Derivatives Market Revenues & Volume By Livestock Farmers for the Period 2022 - 2032F
- Historical Data and Forecast of Croatia Lignin Derivatives Market Revenues & Volume By Personal Care Manufacturers for the Period 2022 - 2032F
- Historical Data and Forecast of Croatia Lignin Derivatives Market Revenues & Volume By Textile Industries for the Period 2022 - 2032F
- Historical Data and Forecast of Croatia Lignin Derivatives Market Revenues & Volume By Product Type for the Period 2022 - 2032F
- Historical Data and Forecast of Croatia Lignin Derivatives Market Revenues & Volume By Lignosulfonates for the Period 2022 - 2032F
- Historical Data and Forecast of Croatia Lignin Derivatives Market Revenues & Volume By Vanillin for the Period 2022 - 2032F
- Historical Data and Forecast of Croatia Lignin Derivatives Market Revenues & Volume By Phenolic Resins for the Period 2022 - 2032F
- Historical Data and Forecast of Croatia Lignin Derivatives Market Revenues & Volume By Kraft Lignin for the Period 2022 - 2032F
- Croatia Lignin Derivatives Import Export Trade Statistics
- Market Opportunity Assessment By Technology Type
- Market Opportunity Assessment By Application
- Market Opportunity Assessment By End User
- Market Opportunity Assessment By Product Type
- Croatia Lignin Derivatives Top Companies Market Share
- Croatia Lignin Derivatives Competitive Benchmarking By Technical and Operational Parameters
- Croatia Lignin Derivatives Company Profiles
- Croatia Lignin Derivatives Key Strategic Recommendations
Frequently Asked Questions About the Market Study (FAQs):
6Wresearch actively monitors the Croatia Lignin Derivatives Market and publishes its comprehensive annual report, highlighting emerging trends, growth drivers, revenue analysis, and forecast outlook. Our insights help businesses to make data-backed strategic decisions with ongoing market dynamics. Our analysts track relevent industries related to the Croatia Lignin Derivatives Market, allowing our clients with actionable intelligence and reliable forecasts tailored to emerging regional needs.
Yes, we provide customisation as per your requirements. To learn more, feel free to contact us on sales@6wresearch.com
1 Executive Summary |
2 Introduction |
2.1 Key Highlights of the Report |
2.2 Report Description |
2.3 Market Scope & Segmentation |
2.4 Research Methodology |
2.5 Assumptions |
3 Croatia Lignin Derivatives Market Overview |
3.1 Croatia Country Macro Economic Indicators |
3.2 Croatia Lignin Derivatives Market Revenues & Volume, 2022 & 2032F |
3.3 Croatia Lignin Derivatives Market - Industry Life Cycle |
3.4 Croatia Lignin Derivatives Market - Porter's Five Forces |
3.5 Croatia Lignin Derivatives Market Revenues & Volume Share, By Technology Type, 2022 & 2032F |
3.6 Croatia Lignin Derivatives Market Revenues & Volume Share, By Application, 2022 & 2032F |
3.7 Croatia Lignin Derivatives Market Revenues & Volume Share, By End User, 2022 & 2032F |
3.8 Croatia Lignin Derivatives Market Revenues & Volume Share, By Product Type, 2022 & 2032F |
4 Croatia Lignin Derivatives Market Dynamics |
4.1 Impact Analysis |
4.2 Market Drivers |
4.2.1 Increasing demand for eco-friendly products and sustainable solutions in various industries |
4.2.2 Growing awareness about the benefits of lignin derivatives as a renewable and bio-based alternative |
4.2.3 Government initiatives and regulations promoting the use of bio-based materials in Croatia |
4.3 Market Restraints |
4.3.1 High initial investment required for setting up lignin derivatives production facilities |
4.3.2 Limited availability of raw materials for lignin extraction in Croatia |
4.3.3 Competition from other bio-based materials and synthetic alternatives in the market |
5 Croatia Lignin Derivatives Market Trends |
6 Croatia Lignin Derivatives Market, By Types |
6.1 Croatia Lignin Derivatives Market, By Technology Type |
6.1.1 Overview and Analysis |
6.1.2 Croatia Lignin Derivatives Market Revenues & Volume, By Technology Type, 2022 - 2032F |
6.1.3 Croatia Lignin Derivatives Market Revenues & Volume, By Sulfonation, 2022 - 2032F |
6.1.4 Croatia Lignin Derivatives Market Revenues & Volume, By Oxidation, 2022 - 2032F |
6.1.5 Croatia Lignin Derivatives Market Revenues & Volume, By Hydrogenation, 2022 - 2032F |
6.2 Croatia Lignin Derivatives Market, By Application |
6.2.1 Overview and Analysis |
6.2.2 Croatia Lignin Derivatives Market Revenues & Volume, By Concrete Additives, 2022 - 2032F |
6.2.3 Croatia Lignin Derivatives Market Revenues & Volume, By Animal Feed, 2022 - 2032F |
6.2.4 Croatia Lignin Derivatives Market Revenues & Volume, By Cosmetics, 2022 - 2032F |
6.2.5 Croatia Lignin Derivatives Market Revenues & Volume, By Dye Production, 2022 - 2032F |
6.3 Croatia Lignin Derivatives Market, By End User |
6.3.1 Overview and Analysis |
6.3.2 Croatia Lignin Derivatives Market Revenues & Volume, By Construction Companies, 2022 - 2032F |
6.3.3 Croatia Lignin Derivatives Market Revenues & Volume, By Livestock Farmers, 2022 - 2032F |
6.3.4 Croatia Lignin Derivatives Market Revenues & Volume, By Personal Care Manufacturers, 2022 - 2032F |
6.3.5 Croatia Lignin Derivatives Market Revenues & Volume, By Textile Industries, 2022 - 2032F |
6.4 Croatia Lignin Derivatives Market, By Product Type |
6.4.1 Overview and Analysis |
6.4.2 Croatia Lignin Derivatives Market Revenues & Volume, By Lignosulfonates, 2022 - 2032F |
6.4.3 Croatia Lignin Derivatives Market Revenues & Volume, By Vanillin, 2022 - 2032F |
6.4.4 Croatia Lignin Derivatives Market Revenues & Volume, By Phenolic Resins, 2022 - 2032F |
6.4.5 Croatia Lignin Derivatives Market Revenues & Volume, By Kraft Lignin, 2022 - 2032F |
7 Croatia Lignin Derivatives Market Import-Export Trade Statistics |
7.1 Croatia Lignin Derivatives Market Export to Major Countries |
7.2 Croatia Lignin Derivatives Market Imports from Major Countries |
8 Croatia Lignin Derivatives Market Key Performance Indicators |
8.1 Research and Development (RD) investment in lignin derivatives technology |
8.2 Number of partnerships and collaborations with key industry players for product development and market expansion |
8.3 Percentage increase in the use of lignin derivatives in different applications |
8.4 Environmental impact metrics related to the production and utilization of lignin derivatives |
8.5 Adoption rate of lignin derivatives in industries such as construction, agriculture, and pharmaceuticals |
9 Croatia Lignin Derivatives Market - Opportunity Assessment |
9.1 Croatia Lignin Derivatives Market Opportunity Assessment, By Technology Type, 2022 & 2032F |
9.2 Croatia Lignin Derivatives Market Opportunity Assessment, By Application, 2022 & 2032F |
9.3 Croatia Lignin Derivatives Market Opportunity Assessment, By End User, 2022 & 2032F |
9.4 Croatia Lignin Derivatives Market Opportunity Assessment, By Product Type, 2022 & 2032F |
10 Croatia Lignin Derivatives Market - Competitive Landscape |
10.1 Croatia Lignin Derivatives Market Revenue Share, By Companies, 2025 |
10.2 Croatia Lignin Derivatives Market Competitive Benchmarking, By Operating and Technical Parameters |
11 Company Profiles |
12 Recommendations |
13 Disclaimer |
Export potential assessment - trade Analytics for 2030
Export potential enables firms to identify high-growth global markets with greater confidence by combining advanced trade intelligence with a structured quantitative methodology. The framework analyzes emerging demand trends and country-level import patterns while integrating macroeconomic and trade datasets such as GDP and population forecasts, bilateral import–export flows, tariff structures, elasticity differentials between developed and developing economies, geographic distance, and import demand projections. Using weighted trade values from 2020–2024 as the base period to project country-to-country export potential for 2030, these inputs are operationalized through calculated drivers such as gravity model parameters, tariff impact factors, and projected GDP per-capita growth. Through an analysis of hidden potentials, demand hotspots, and market conditions that are most favorable to success, this method enables firms to focus on target countries, maximize returns, and global expansion with data, backed by accuracy.
By factoring in the projected importer demand gap that is currently unmet and could be potential opportunity, it identifies the potential for the Exporter (Country) among 190 countries, against the general trade analysis, which identifies the biggest importer or exporter.
To discover high-growth global markets and optimize your business strategy:
Click Here
Pricing
- Single User License$ 1,995
- Department License$ 2,400
- Site License$ 3,120
- Global License$ 3,795

Search
Thought Leadership and Analyst Meet


Our Clients
Latest Reports
- France Thermally Conductive Filler Dispersants Market (2026-2032) | Challenges, Restraints, Value, Share, Size, segmentation, Analysis, Trends, Investment Opportunities, Outlook, Pricing, Demand, Forecast, Revenue, Companies, Growth, Drivers, Strategy, Insights, Competition
- Egypt Thermally Conductive Filler Dispersants Market (2026-2032) | Competition, Forecast, Strategy, Value, Insights, Outlook, Investment Opportunities, Pricing, Demand, Share, segmentation, Drivers, Size, Companies, Restraints, Growth, Trends, Revenue, Challenges, Analysis
- Czech Republic Thermally Conductive Filler Dispersants Market (2026-2032) | Forecast, Pricing, Analysis, Drivers, Insights, Size, Demand, Growth, Challenges, segmentation, Competition, Outlook, Trends, Investment Opportunities, Companies, Strategy, Revenue, Share, Value, Restraints
- Colombia Thermally Conductive Filler Dispersants Market (2026-2032) | segmentation, Trends, Share, Drivers, Strategy, Companies, Demand, Insights, Size, Challenges, Value, Competition, Analysis, Growth, Revenue, Restraints, Forecast, Pricing, Outlook, Investment Opportunities
- China Thermally Conductive Filler Dispersants Market (2026-2032) | Restraints, Investment Opportunities, Pricing, Companies, Share, Size, Challenges, Trends, Outlook, Value, Analysis, Competition, Revenue, Drivers, Forecast, Demand, Insights, Growth, Strategy, segmentation
- Chile Thermally Conductive Filler Dispersants Market (2026-2032) | Investment Opportunities, Trends, Value, Restraints, Share, Companies, Forecast, segmentation, Pricing, Challenges, Demand, Size, Analysis, Drivers, Outlook, Growth, Competition, Strategy, Revenue, Insights
- Cambodia Thermally Conductive Filler Dispersants Market (2026-2032) | Analysis, Share, Outlook, Strategy, Pricing, Demand, Size, Growth, segmentation, Insights, Revenue, Forecast, Challenges, Competition, Companies, Investment Opportunities, Trends, Restraints, Value, Drivers
- Brazil Thermally Conductive Filler Dispersants Market (2026-2032) | Restraints, Forecast, Competition, Size, Revenue, Value, Investment Opportunities, Trends, Insights, Outlook, Growth, Analysis, Drivers, segmentation, Pricing, Challenges, Strategy, Share, Companies, Demand
- Bangladesh Thermally Conductive Filler Dispersants Market (2026-2032) | Restraints, Trends, Analysis, Competition, Insights, Forecast, Value, Investment Opportunities, Pricing, Share, Demand, Outlook, Revenue, segmentation, Companies, Drivers, Growth, Size, Challenges, Strategy
- Bahrain Thermally Conductive Filler Dispersants Market (2026-2032) | Trends, Outlook, Pricing, Demand, Value, Competition, Forecast, Growth, segmentation, Revenue, Companies, Analysis, Insights, Size, Drivers, Challenges, Strategy, Investment Opportunities, Share, Restraints
Industry Events and Analyst Meet

HIMTEX 2026

India Refining Summit 2026

India EV Show 2026

EV tech India Expo 2026

Auto Tech Asia 2026
Whitepaper
- Middle East & Africa Commercial Security Market Click here to view more.
- Middle East & Africa Fire Safety Systems & Equipment Market Click here to view more.
- GCC Drone Market Click here to view more.
- Middle East Lighting Fixture Market Click here to view more.
- GCC Physical & Perimeter Security Market Click here to view more.
6WResearch In News
- Doha a strategic location for EV manufacturing hub: IPA Qatar
- Demand for luxury TVs surging in the GCC, says Samsung
- Empowering Growth: The Thriving Journey of Bangladesh’s Cable Industry
- Demand for luxury TVs surging in the GCC, says Samsung
- Video call with a traditional healer? Once unthinkable, it’s now common in South Africa
- Intelligent Buildings To Smooth GCC’s Path To Net Zero